Philadelphia Eagles vs Minnesota Vikings Match Player Stats
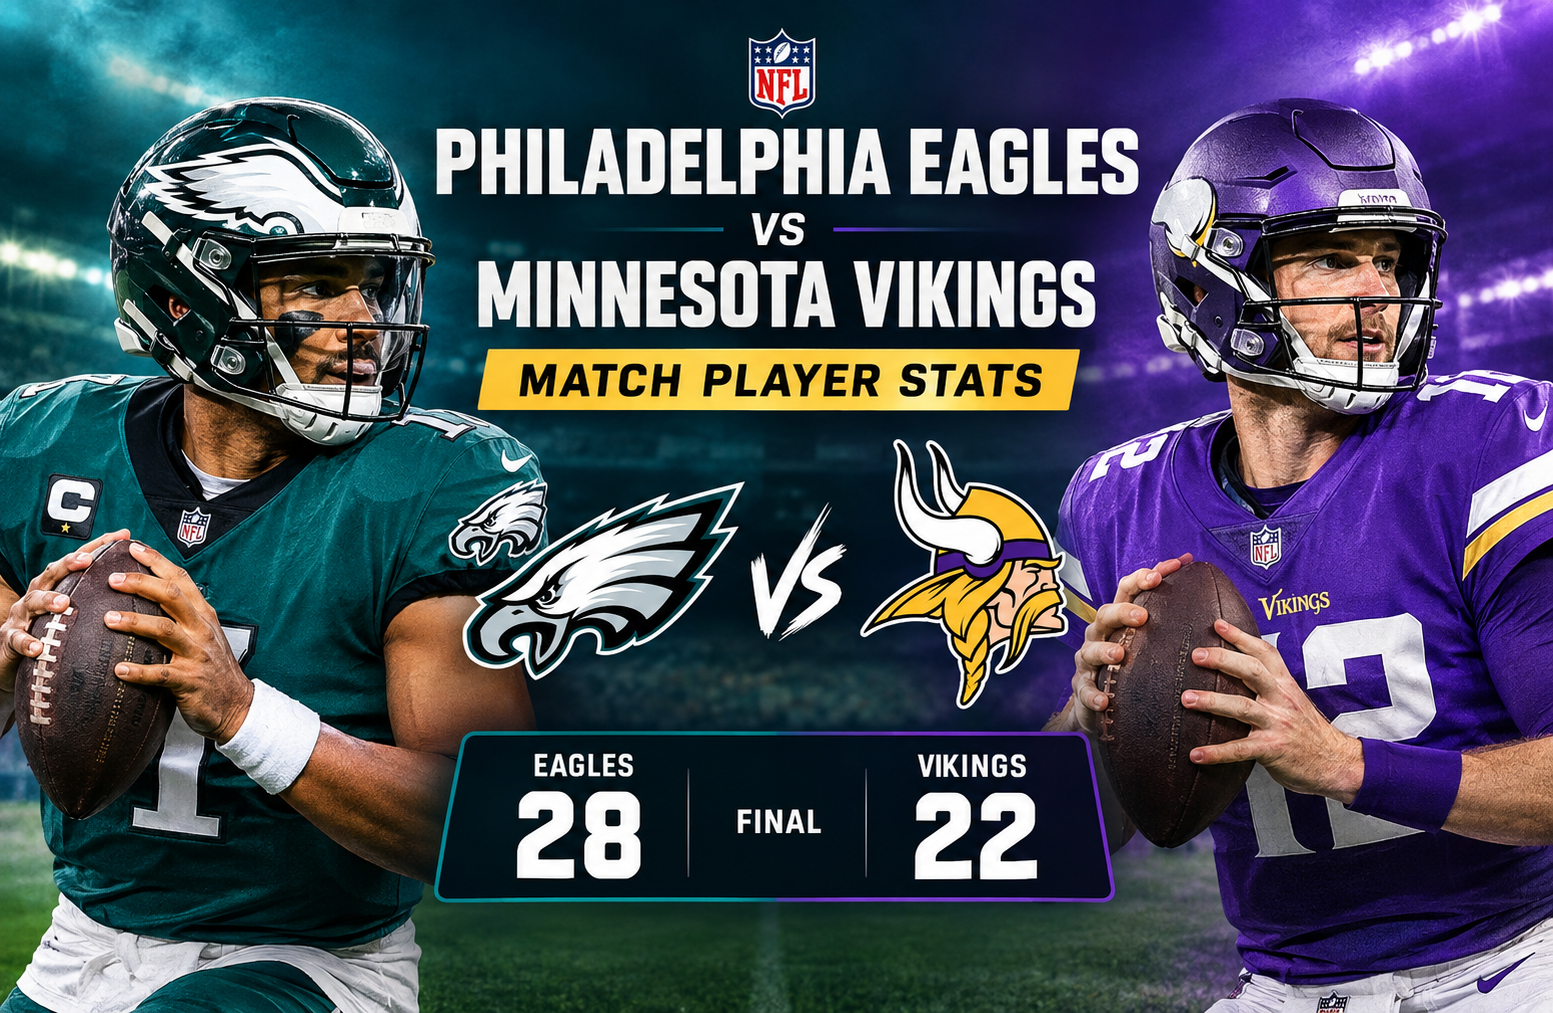
The Philadelphia Eagles vs Minnesota Vikings Match Player Stats from October 19, 2025, tell the story of an NFL regular-season game decided by efficient passing, explosive receiving plays, and a crucial defensive touchdown. Philadelphia defeated Minnesota 28-22, with quarterback Jalen Hurts delivering three passing touchdowns and 326 passing yards. Wide receiver DeVonta Smith added 183 receiving yards, while A.J. Brown scored twice through the air. Minnesota produced competitive offensive numbers, but Carson Wentz’s two interceptions and the Eagles’ defensive playmaking helped shape the final result.
The matchup offered an interesting contrast between two offensive approaches. Philadelphia converted its passing opportunities into touchdowns, while Minnesota moved the ball through a combination of short completions, productive receiving performances, and field goals. Jordan Addison led the Vikings with 128 receiving yards, and running back Jordan Mason contributed 57 rushing yards and a touchdown. However, a 42-yard interception return for a touchdown by Eagles defender Jalyx Hunt proved to be an important part of Philadelphia’s winning performance.
This statistical breakdown examines the final score, quarterback efficiency, rushing production, receiving leaders, defensive contributions, special teams, and the numbers that explain how the Eagles secured the six-point victory. It also distinguishes raw production from game-changing plays, helping readers understand why certain statistics mattered more than others.
Philadelphia Eagles vs Minnesota Vikings Match Player Stats: Game Overview
The Eagles and Vikings met during the 2025 NFL regular season on October 19. Philadelphia finished the contest with 28 points, while Minnesota recorded 22. The Eagles scored seven points in every quarter, demonstrating consistent scoring production throughout the game.
Minnesota’s scoring pattern was different. The Vikings scored three points in each of the first two quarters, added 10 in the third, and finished with six in the fourth. Their second-half production kept the contest competitive, but Philadelphia maintained its advantage.
Final Score and Team Records
| Match Detail | Philadelphia Eagles | Minnesota Vikings |
| Final score | 28 | 22 |
| Game result | Win | Loss |
| Record listed with game | 5-2 | 3-3 |
| Home or away record listed | Away: 3-1 | Home: 1-2 |
| First-quarter points | 7 | 3 |
| Second-quarter points | 7 | 3 |
| Third-quarter points | 7 | 10 |
| Fourth-quarter points | 7 | 6 |
| Total points | 28 | 22 |
Philadelphia’s four consecutive seven-point quarters provided a stable scoring pattern. Minnesota, meanwhile, depended more heavily on its third-quarter surge to remain within reach.
The six-point final margin does not fully explain the difference between the teams. Minnesota accumulated 313 passing yards, compared with Philadelphia’s 326, and actually produced more rushing yards. The more revealing differences were passing touchdowns, interceptions, and the Eagles’ defensive touchdown.
Quarter-by-Quarter Scoring Analysis
| Quarter | Eagles | Vikings | What the Numbers Show |
| First | 7 | 3 | Philadelphia established an early scoring advantage. |
| Second | 7 | 3 | The Eagles extended their lead with another seven points. |
| Third | 7 | 10 | Minnesota produced its strongest scoring quarter. |
| Fourth | 7 | 6 | Philadelphia maintained its scoring pace and finished with the lead. |
| Final | 28 | 22 | Philadelphia won by six points. |
One important detail is the Eagles’ consistency. They scored in every quarter rather than relying on one isolated scoring burst. Minnesota’s third-quarter response showed its ability to stay competitive, but the Vikings could not match Philadelphia’s overall touchdown production.
For readers evaluating game performance, quarter-by-quarter scoring is useful because it adds context to the final score. It reveals whether a team built an early lead, recovered after falling behind, or maintained a consistent level of production.
Jalen Hurts vs Carson Wentz: Quarterback Statistics
Quarterback efficiency was one of the clearest differences in this matchup. Jalen Hurts completed 19 of 23 passes for 326 yards and three touchdowns without throwing an interception. Carson Wentz completed 26 of 42 passes for 313 yards but did not throw a touchdown and was intercepted twice.
The contrast is especially notable because Minnesota’s quarterback attempted substantially more passes. Despite completing seven more passes, Wentz finished with 13 fewer passing yards and no passing touchdowns.
Complete Quarterback Comparison
| Statistic | Jalen Hurts | Carson Wentz |
| Completions | 19 | 26 |
| Pass attempts | 23 | 42 |
| Completion percentage | 82.6% | 61.9% |
| Passing yards | 326 | 313 |
| Yards per attempt | 14.2 | 7.5 |
| Passing touchdowns | 3 | 0 |
| Interceptions | 0 | 2 |
| Sacks taken | 3 | 2 |
| Sack yards lost | 10 | 15 |
| ESPN QBR | 96.2 | 50.8 |
| Passer rating | 158.3 | 64.9 |
Completion percentages are calculated from the supplied completions and attempts. Other figures follow the supplied game statistics.
Jalen Hurts Delivered High-Value Passing Production
Hurts’ performance combined accuracy with substantial downfield production. His 82.6% completion rate was supported by 14.2 yards per attempt, a combination that indicates his completed passes generated considerably more yardage than short, low-risk throws alone would typically produce.
Three statistics stand out:
- 326 passing yards: Hurts generated the majority of Philadelphia’s listed offensive passing production.
- Three passing touchdowns: He converted passing opportunities into direct scoring contributions.
- Zero interceptions: He avoided the turnovers that can erase the value of productive drives.
His 158.3 passer rating was also substantially higher than Wentz’s 64.9. The passer rating and ESPN QBR are different measurements, so they should not be treated as interchangeable. The supplied figures nevertheless point in the same direction: Hurts produced a more efficient passing performance.
The key insight is that Philadelphia did not need an unusually high number of completions to generate its passing total. Hurts averaged 14.2 yards per attempt, showing how explosive gains can reduce the number of plays needed to move downfield.
Carson Wentz Moved the Ball but Struggled to Finish Drives
Wentz’s 313 passing yards show that Minnesota was able to gain meaningful yardage through the air. He completed 26 passes, and the Vikings’ receivers combined for several productive individual performances.
However, his 42 attempts produced an average of just 7.5 yards per attempt. More importantly, he finished without a passing touchdown and threw two interceptions.
The distinction between passing volume and passing efficiency matters here. A quarterback can accumulate a respectable yardage total through repeated completions without consistently producing scoring plays. Minnesota’s five successful field goals demonstrate that the offense could reach scoring range, but its passing attack did not turn those opportunities into passing touchdowns.
Wentz also took two sacks for a combined loss of 15 yards. Although the supplied statistics do not establish the exact impact of each sack on a particular drive, negative plays can make third-down conversions and red-zone execution more difficult.
Why the Quarterback Comparison Matters
Hurts attempted 23 passes and completed 19. Wentz attempted 42 and completed 26. Philadelphia therefore generated more passing yards despite attempting 19 fewer passes.
| Efficiency Measure | Eagles | Vikings |
| Team passing yards | 326 | 313 |
| Passing attempts | 23 | 42 |
| Yards per attempt | 14.2 | 7.5 |
| Passing touchdowns | 3 | 0 |
| Interceptions thrown | 0 | 2 |
The numbers suggest that Philadelphia extracted more value from its passing opportunities. This does not mean every passing attempt was successful, nor does it establish that passing efficiency alone decided the game. It does show why the Eagles could score 28 points while Minnesota finished with 22 despite recording a similar passing-yard total.
Philadelphia Eagles Rushing Stats
Philadelphia’s rushing attack produced 45 yards on 23 team attempts, an average of 2.0 yards per carry. Those figures were modest compared with Minnesota’s ground production, but the Eagles’ passing game helped offset the limited rushing output.
Saquon Barkley handled most of Philadelphia’s listed rushing workload. He recorded 18 carries for 44 yards, averaging 2.4 yards per attempt, with no rushing touchdowns. Tank Bigsby gained 11 yards on one attempt, while Hurts recorded four carries for minus 10 yards.
Eagles Rushing Leaders
| Player | Attempts | Rushing Yards | Average | Rushing TDs |
| Saquon Barkley | 18 | 44 | 2.4 | 0 |
| Tank Bigsby | 1 | 11 | 11.0 | 0 |
| Jalen Hurts | 4 | -10 | -2.5 | 0 |
| Team total | 23 | 45 | 2.0 | 0 |
Saquon Barkley’s Workload and Efficiency
Barkley’s 18 carries represented most of Philadelphia’s rushing attempts. However, his 44 yards meant that the Eagles could not consistently rely on the traditional running game to produce large gains.
His workload remains important when interpreting the team’s offensive balance. A running back can be central to the game plan even when the average gain per carry is low. Carries may help manage down and distance, influence defensive alignments, and keep the offense from becoming entirely dependent on passing.
Still, the statistics show a clear limitation: Philadelphia recorded no rushing touchdowns. All three of its listed offensive touchdowns through the air came from Hurts’ passing production.
Tank Bigsby Produced the Eagles’ Best Listed Rushing Average
Bigsby gained 11 yards on his single recorded rushing attempt. His 11.0-yard average was the best among Philadelphia’s listed rushers.
That figure should be interpreted carefully. One attempt is a very small sample, so it cannot establish that Bigsby was more effective overall than Barkley. It does demonstrate that his limited rushing contribution included a positive gain that lifted the team’s ground total.
Hurts’ negative rushing total also affected Philadelphia’s overall average. His four carries resulted in minus 10 yards, making his rushing line considerably different from his passing performance.
The broader conclusion is that Philadelphia won without dominating on the ground. Its ability to generate explosive passing plays and score through the air compensated for a running game that averaged only two yards per attempt.
Minnesota Vikings Rushing Stats
Minnesota produced stronger rushing numbers than Philadelphia, recording 89 yards on 23 attempts at an average of 3.9 yards per carry. The Vikings also scored one rushing touchdown, giving them a scoring contribution on the ground that the Eagles did not have.
Jordan Mason led Minnesota’s rushing attack with 57 yards and one touchdown on 15 carries. Carson Wentz added 28 rushing yards on four attempts, while Zavier Scott recorded four carries for four yards.
Vikings Rushing Leaders
| Player | Attempts | Rushing Yards | Average | Rushing TDs |
| Jordan Mason | 15 | 57 | 3.8 | 1 |
| Carson Wentz | 4 | 28 | 7.0 | 0 |
| Zavier Scott | 4 | 4 | 1.0 | 0 |
| Team total | 23 | 89 | 3.9 | 1 |
Jordan Mason Led the Ground Game
Mason supplied Minnesota with its most substantial rushing contribution. His 57 yards represented a large share of the team’s 89 rushing yards, and his touchdown gave the Vikings an important scoring option beyond field goals.
He averaged 3.8 yards per carry across 15 attempts. Although that average was not especially explosive, his workload gave Minnesota a consistent rushing presence.
Mason’s performance also illustrates why rushing statistics should be evaluated alongside passing numbers. Minnesota gained more yards on the ground than Philadelphia, but the Vikings still lost because total rushing production does not automatically translate into more points.
Carson Wentz Added a Running Threat
Wentz recorded 28 rushing yards on four attempts, averaging seven yards per carry. His rushing production was more efficient than his passing output on a per-attempt basis, although the two figures measure different types of plays.
Quarterback rushing can create additional defensive challenges. When a quarterback gains yards on designed runs or scrambles, defenders must account for a potential runner as well as receivers downfield.
However, Wentz’s ground production could not erase the consequences of his two interceptions and lack of passing touchdowns. Minnesota’s offense generated yardage in multiple ways, but its scoring output remained below Philadelphia’s.
Rushing Comparison: Which Team Had the Statistical Edge?
| Rushing Measure | Eagles | Vikings |
| Attempts | 23 | 23 |
| Rushing yards | 45 | 89 |
| Yards per carry | 2.0 | 3.9 |
| Rushing touchdowns | 0 | 1 |
Minnesota gained 44 more rushing yards on the same number of attempts. The Vikings also averaged 1.9 more yards per carry.
This is a meaningful difference because it challenges the assumption that the team with the stronger running performance will necessarily win. Philadelphia’s advantage came from other areas, particularly passing touchdowns and defensive scoring.
For a complete evaluation, rushing yards should be considered alongside turnovers, explosive passes, touchdowns, and special teams. No single statistical category fully explains the final result.
Philadelphia Eagles Receiving Stats
Philadelphia’s receiving production was one of the defining features of the matchup. The Eagles recorded 19 receptions for 326 yards and three touchdowns. DeVonta Smith and A.J. Brown accounted for the most prominent individual performances.
Smith finished with nine catches for 183 yards and one touchdown. Brown added four catches for 121 yards and two touchdowns. Together, they produced 304 receiving yards and all three of Philadelphia’s listed passing touchdowns.
Eagles Receiving Leaders
| Player | Receptions | Targets | Receiving Yards | Average per Catch | TDs | Longest Catch |
| DeVonta Smith | 9 | 11 | 183 | 20.3 | 1 | 79 yards |
| A.J. Brown | 4 | 6 | 121 | 30.3 | 2 | 45 yards |
| Dallas Goedert | 3 | Not supplied | 18 | 6.0 | 0 | Not supplied |
| Will Shipley | 1 | Not supplied | 7 | 7.0 | 0 | Not supplied |
| Tank Bigsby | 1 | Not supplied | -1 | -1.0 | 0 | Not supplied |
| Saquon Barkley | 1 | Not supplied | -2 | -2.0 | 0 | Not supplied |
| Team total | 19 | Not fully supplied | 326 | 17.2 | 3 | 79 yards |
Individual averages are calculated from receiving yards divided by receptions. Targets and longest catches are shown only where supplied.
DeVonta Smith Delivered the Biggest Yardage Total
Smith’s nine receptions for 183 yards made him Philadelphia’s leading receiver by yardage. He averaged 20.3 yards per catch, showing that his production involved substantial gains rather than a series of short completions.
His longest reception was 79 yards, a play that demonstrates how one explosive completion can significantly influence a receiver’s final statistics.
Smith also caught one touchdown pass. His combination of volume, yardage, and scoring made him a central part of the Eagles’ offensive success.
One useful way to evaluate his performance is to compare his catches with his targets. Smith caught nine of 11 passes directed his way, giving him a catch rate of approximately 81.8%. That is a strong conversion rate for a receiver who averaged more than 20 yards per reception.
The numbers do not reveal every detail of his routes or the coverage he faced, but they establish that Smith combined reliable hands with big-play production.
A.J. Brown Turned Four Catches into Two Touchdowns
Brown recorded 121 yards on four receptions, averaging 30.3 yards per catch. He also scored two touchdowns, making him Philadelphia’s leading receiver in touchdown production.
His longest reception covered 45 yards. Brown’s 30.3-yard average exceeded Smith’s, although Smith accumulated more total yards through five additional catches.
Brown’s line is a useful example of the difference between receiving volume and receiving impact. Smith generated more yardage overall, while Brown converted a greater share of his limited receptions into touchdowns.
Together, the two receivers gave Hurts multiple ways to attack Minnesota’s defense. Smith supplied the larger yardage total, and Brown provided two direct scoring contributions.
Dallas Goedert and the Supporting Receivers
Goedert caught three passes for 18 yards. His receiving total was much smaller than those of Smith and Brown, but his three receptions added to Philadelphia’s total of 19 completions.
Will Shipley recorded one catch for seven yards. Bigsby and Barkley each had one reception, with their receiving lines showing minus one yard and minus two yards respectively.
These supporting contributions matter when reviewing the full team total, even though they were not the main drivers of the result.
A complete receiving analysis should not focus exclusively on the top two players. The supporting cast helps explain how a team distributes targets and builds its overall passing production. In this game, however, Smith and Brown accounted for most of Philadelphia’s receiving yardage.
Minnesota Vikings Receiving Stats
Minnesota’s receivers accumulated 313 yards on 26 receptions, but the team did not record a passing touchdown. Jordan Addison led the group with 128 yards, followed by Justin Jefferson with 79 yards and T.J. Hockenson with 43.
The Vikings had more receptions than Philadelphia, yet their passing attack produced fewer yards and no passing touchdowns. This is another example of why reception totals alone do not determine offensive effectiveness.
Vikings Receiving Leaders
| Player | Receptions | Targets | Receiving Yards | Average per Catch | TDs | Longest Catch |
| Jordan Addison | 9 | 12 | 128 | 14.2 | 0 | 34 yards |
| Justin Jefferson | 5 | 10 | 79 | 15.8 | 0 | 40 yards |
| T.J. Hockenson | 6 | Not supplied | 43 | 7.2 | 0 | Not supplied |
| Jalen Nailor | 2 | Not supplied | 37 | 18.5 | 0 | Not supplied |
| Adam Thielen | 1 | Not supplied | 10 | 10.0 | 0 | Not supplied |
| Josh Oliver | 1 | Not supplied | 9 | 9.0 | 0 | Not supplied |
| C.J. Ham | 1 | Not supplied | 5 | 5.0 | 0 | Not supplied |
| Zavier Scott | 1 | Not supplied | 2 | 2.0 | 0 | Not supplied |
| Team total | 26 | Not fully supplied | 313 | 12.0 | 0 | 40 yards |
Jordan Addison Led Minnesota in Receiving
Addison caught nine passes for 128 yards on 12 targets. His 14.2 yards per reception gave Minnesota a productive downfield option, and he led the Vikings in both receptions and receiving yards.
His catch rate was 75%, calculated by dividing nine receptions by 12 targets. That figure indicates that he converted most of the opportunities directed his way.
Despite the yardage total, Addison did not record a receiving touchdown. His performance helped Minnesota advance the ball, but it did not produce the same direct scoring return as the combined work of Smith and Brown.
This distinction is important when assessing individual statistics. A receiver can perform well in terms of catches and yards without necessarily having the touchdown numbers that most directly affect the scoreboard.
Justin Jefferson Added 79 Receiving Yards
Jefferson finished with five receptions for 79 yards on 10 targets. His longest reception covered 40 yards, and he averaged 15.8 yards per catch.
Jefferson’s catch rate was 50%, based on the supplied figures. That is lower than Addison’s rate, but the statistics alone do not explain why each target was or was not completed. Factors such as defensive coverage, throw placement, route depth, and down-and-distance situations would require more detailed play-by-play information.
His 79 yards still provided Minnesota with an important receiving contribution. The Vikings had two receivers, Addison and Jefferson, finish with at least 79 yards, demonstrating that they could generate meaningful production through their wideouts.
T.J. Hockenson and Minnesota’s Supporting Cast
Hockenson caught six passes for 43 yards, giving him the second-highest reception total among the listed Vikings receivers. His average of approximately 7.2 yards per catch suggests that his production came through shorter gains.
Jalen Nailor recorded two catches for 37 yards, averaging 18.5 yards per reception. Adam Thielen, Josh Oliver, C.J. Ham, and Zavier Scott each added one reception.
These contributions helped Minnesota reach 313 passing yards. Yet the lack of receiving touchdowns remained a defining difference between the teams.
Receiving Comparison: Eagles vs Vikings
| Receiving Measure | Eagles | Vikings |
| Team receptions | 19 | 26 |
| Team receiving yards | 326 | 313 |
| Average yards per reception | 17.2 | 12.0 |
| Receiving touchdowns | 3 | 0 |
| Leading receiver | DeVonta Smith | Jordan Addison |
| Leading receiver’s yards | 183 | 128 |
Philadelphia recorded 13 fewer receptions but gained 13 more receiving yards. Its average of 17.2 yards per catch was 5.2 yards higher than Minnesota’s 12.0.
The more important distinction was scoring. The Eagles converted their passing production into three touchdowns, while the Vikings did not record a passing score. This difference explains more about the result than the small gap in total receiving yards.
Defensive Player Stats: The Difference-Making Plays
Defense was another major part of Philadelphia’s victory. The Eagles recorded two interceptions, eight quarterback hits, six tackles for loss, and one defensive touchdown. Minnesota recorded three sacks and eight tackles for loss, but its defense did not produce an interception or defensive score.
The most decisive individual defensive contribution in the supplied statistics came from Jalyx Hunt, who intercepted a pass and returned it 42 yards for a touchdown.
Team Defensive Comparison
| Defensive Statistic | Eagles | Vikings |
| Total tackles | 62 | 63 |
| Solo tackles | 42 | 36 |
| Sacks | 2 | 3 |
| Tackles for loss | 6 | 8 |
| Passes defended | 3 | 1 |
| Quarterback hits | 8 | 4 |
| Interceptions | 2 | 0 |
| Defensive touchdowns | 1 | 0 |
Jalyx Hunt’s Interception Return Touchdown
Hunt recorded an interception and returned it 42 yards for a touchdown. This play stands out because defensive touchdowns can change the scoreboard without requiring the offense to complete a drive.
Philadelphia’s offense supplied three passing touchdowns, but Hunt’s defensive score added another scoring contribution. His play also directly punished a Minnesota passing mistake.
A defensive touchdown has value beyond its points. It can alter momentum, increase pressure on the opposing offense, and force the trailing team to reconsider its approach. Those broader effects are difficult to quantify from the box score alone, but the immediate scoring impact is clear.
Andrew Mukuba Added Another Interception
Mukuba recorded Philadelphia’s second interception. His interception return covered zero yards in the supplied statistics, meaning the play did not add return yardage, but the takeaway still ended a Minnesota passing opportunity.
Together, Hunt and Mukuba accounted for the Eagles’ two interceptions. Minnesota recorded none.
That difference is important because interceptions can interrupt promising drives and create additional possessions for the opposing team. While the exact value of each takeaway depends on field position and game situation, two interceptions without a corresponding interception thrown by Philadelphia represent a clear turnover advantage.
Zack Baun Led Philadelphia in Tackles
Baun recorded 10 total tackles, the highest individual total among the listed Eagles defenders. Cooper DeJean followed with eight, while Nakobe Dean recorded six.
Other listed contributors included Kelee Ringo with five tackles and Quinyon Mitchell with four.
These totals show how defensive work was distributed across the lineup. Tackles alone do not measure the quality of every defensive performance, but they provide a useful view of involvement in stopping plays.
Minnesota’s Defense Generated Pressure
The Vikings recorded three sacks and eight tackles for loss, both more than Philadelphia’s listed totals of two sacks and six tackles for loss. Their defense also recorded four quarterback hits.
Joshua Metellus led Minnesota’s listed defenders with eight tackles. Eric Wilson had six, Theo Jackson recorded five, and Harrison Smith and Jonathan Allen each recorded four.
Minnesota’s defensive numbers show that it generated pressure and made plays behind the line of scrimmage. However, it did not record an interception or defensive touchdown.
This contrast demonstrates why defensive statistics should be assessed as a group. Sacks and tackles for loss show disruption, while interceptions and defensive scores show how directly a defense turned its work into possession changes or points.
Turnovers and Game-Changing Statistics
Turnovers help explain why two teams with similar passing-yard totals can finish with different scores. Philadelphia recorded two interceptions and no fumbles in the supplied team statistics. Minnesota recorded two interceptions thrown by its quarterback and two team fumbles, but no fumbles were lost.
Turnover Summary
| Turnover Measure | Eagles | Vikings |
| Interceptions thrown | 0 | 2 |
| Interceptions recorded by defense | 2 | 0 |
| Team fumbles recorded | None | 2 |
| Fumbles lost | None recorded | 0 |
| Defensive touchdowns | 1 | 0 |
The supplied data records one fumble by Wentz and one by Blake Brandel. Minnesota lost neither fumble, so these plays should not be counted as lost-ball turnovers.
The distinction matters because a fumble is not automatically a turnover. A team can recover its own fumble and retain possession. Interceptions, by contrast, transfer possession to the defense unless the play is affected by a later ruling.
Philadelphia’s two interceptions were especially significant because one became a defensive touchdown. The Eagles therefore gained possession on two interception plays and scored directly on one of them.
It would be misleading to claim that turnovers alone explain every point in the game. However, the difference between two interceptions thrown by Minnesota and none thrown by Philadelphia is one of the strongest statistical explanations for the final outcome.
Special Teams Player Stats
Special teams provided another layer of context to the Eagles’ 28-22 win. Minnesota was perfect on field goals, converting five of five attempts, while Philadelphia missed its only field-goal attempt. The Vikings’ kicking performance kept them competitive, but it could not compensate fully for the difference in offensive touchdowns and defensive scoring.
Field-Goal and Extra-Point Comparison
| Statistic | Eagles | Vikings |
| Field goals made | 0 | 5 |
| Field goals attempted | 1 | 5 |
| Field-goal percentage | 0.0% | 100% |
| Extra points made | 4 | 1 |
| Extra points attempted | 4 | 1 |
| Kicker | Jake Elliott | Will Reichard |
| Points by kicker | 4 | 16 |
| Longest field goal | Not supplied | 59 yards |
Will Reichard scored 16 points through his five field goals and one extra point. His longest successful field goal was 59 yards, highlighting the range he demonstrated in the supplied game statistics.
Jake Elliott recorded four points from four successful extra points. Philadelphia’s only field-goal attempt was unsuccessful.
The difference between the teams’ kicking output is striking. Minnesota scored 15 more points through field goals than Philadelphia, yet still lost by six. This illustrates how field goals can sustain a team’s scoring without matching the value of offensive and defensive touchdowns.
Kick Return Production
| Statistic | Eagles | Vikings |
| Kick returns | 7 | 3 |
| Kick-return yards | 186 | 74 |
| Average yards per return | 26.6 | 24.7 |
| Longest return | 37 yards | 38 yards |
| Leading listed returner | Xavier Gipson | Myles Price |
Philadelphia returned seven kicks for 186 yards, averaging 26.6 yards per return. Xavier Gipson handled five returns for 128 yards, while Will Shipley recorded two returns for 58 yards.
Minnesota returned three kicks for 74 yards. Myles Price recorded two returns for 57 yards, and Tai Felton added one return for 17 yards.
Philadelphia’s total kick-return yardage exceeded Minnesota’s by 112 yards. Although both teams recorded similar average return distances, the Eagles had more return opportunities and generated a higher cumulative total.
Return yardage can influence offensive starting field position, but total return yards should not be confused with net field position gained. The exact starting positions of the following drives would be needed to measure that effect precisely.
Punting Statistics
| Statistic | Braden Mann, Eagles | Ryan Wright, Vikings |
| Punts | 3 | 1 |
| Total punting yards | 146 | 34 |
| Average punt | 48.7 yards | 34.0 yards |
| Touchbacks | 1 | 0 |
| Punts inside the 20 | 1 | 1 |
| Longest punt | 53 yards | 34 yards |
Mann punted three times for 146 yards, averaging 48.7 yards per punt. Wright punted once for 34 yards.
These figures indicate that Philadelphia punted more often, while Minnesota recorded only one punt. Punting frequency alone does not establish which offense performed better, since it can be affected by failed third downs, field position, and the number of possessions.
The Eagles’ longest punt was 53 yards, compared with 34 yards for Minnesota. Both punters recorded one punt inside the 20 according to the supplied data.
Team Statistics Comparison: Eagles vs Vikings
Looking at team-level statistics helps connect the individual performances to the final score. Philadelphia finished with 326 passing yards and 45 rushing yards, while Minnesota recorded 313 passing yards and 89 rushing yards.
The Vikings generated more rushing yardage, but Philadelphia produced more receiving yards and substantially more passing touchdowns.
Complete Offensive and Defensive Comparison
| Category | Philadelphia Eagles | Minnesota Vikings |
| Final score | 28 | 22 |
| Passing yards | 326 | 313 |
| Rushing yards | 45 | 89 |
| Passing touchdowns | 3 | 0 |
| Rushing touchdowns | 0 | 1 |
| Defensive touchdowns | 1 | 0 |
| Interceptions thrown | 0 | 2 |
| Sacks recorded | 2 | 3 |
| Tackles for loss | 6 | 8 |
| Quarterback hits | 8 | 4 |
| Team receptions | 19 | 26 |
| Kick-return yards | 186 | 74 |
| Field goals made | 0 | 5 |
The figures reflect the supplied box-score data. Total offensive yards can be calculated by adding passing and rushing yards, but that sum is not necessarily the same as net total offense when sack yardage is accounted for differently.
Passing Production Favored Philadelphia
Philadelphia finished with 13 more passing yards than Minnesota despite attempting far fewer passes. The Eagles also recorded three passing touchdowns, while the Vikings recorded none.
This difference was central to the scoring comparison. Minnesota’s five field goals produced 15 points, while Philadelphia’s three passing touchdowns and four extra points accounted for 25 points. Hunt’s defensive touchdown and its associated scoring sequence contributed to the Eagles’ remaining points.
Rushing Production Favored Minnesota
Minnesota recorded 44 more rushing yards than Philadelphia and averaged 3.9 yards per carry compared with the Eagles’ 2.0.
This advantage helped the Vikings maintain a ground-game presence, but it was not enough to determine the winner. Philadelphia compensated with more productive passing and a defensive touchdown.
Defensive Disruption Was Mixed
Minnesota recorded more sacks and tackles for loss, suggesting it disrupted Philadelphia’s offense in those categories. The Eagles, however, registered more quarterback hits and passes defended, and they intercepted Wentz twice.
The statistics therefore show different types of defensive production rather than a complete advantage for one team in every category. The most consequential distinction was that Philadelphia converted defensive work into a touchdown.
Three Statistical Lessons from the Game
The matchup offers several useful lessons for readers who want to understand more than the final score.
1. Efficiency Can Matter More Than Volume
Wentz completed 26 passes, seven more than Hurts, but Hurts generated 13 additional passing yards and three passing touchdowns. Hurts also avoided interceptions.
The comparison demonstrates why passing attempts and completions should be read alongside yards per attempt, touchdowns, and turnovers. Volume describes how much a player did, while efficiency helps explain the value of that production.
This principle also applies to receivers. Smith caught nine passes for 183 yards, while Brown gained 121 yards on four catches. Both performances were productive, but they created value in different ways.
2. A Defense Can Change the Score Directly
Hunt’s interception return touchdown was more than a defensive statistic. It was a direct scoring play that did not require the Eagles’ offense to advance the ball.
Defensive scores are relatively uncommon compared with ordinary offensive scoring plays, but their impact can be substantial. They can add points, interrupt the opponent’s momentum, and change the strategic demands of the remaining game.
Mukuba’s interception also mattered because it ended another Minnesota passing opportunity. Together, the two interceptions illustrate how defensive playmaking can affect a game even when the opposing offense continues to accumulate yardage.
3. Yardage Does Not Guarantee Touchdowns
Minnesota produced 402 combined passing and rushing yards using the supplied figures, while Philadelphia recorded 371. Yet the Eagles won by six points.
This simple comparison is useful, but it requires context. The calculation adds the supplied passing and rushing totals and does not adjust for how sack yardage is treated in official total-offense accounting.
More importantly, yardage measures movement, not scoring efficiency. Touchdowns, field goals, turnovers, and failed scoring opportunities determine how that movement translates into points.
Minnesota’s five field goals showed that it could generate scoring chances. Philadelphia’s passing touchdowns and defensive score, however, provided a different scoring profile.
How to Read NFL Player Statistics Correctly
For readers checking a box score, the most useful approach is to examine several connected categories instead of relying on a single headline number.
Start with the Final Score and Quarter Scores
The final score tells you who won, but quarter scores reveal how the game developed. Philadelphia scored seven points in every quarter, while Minnesota’s scoring varied between three and 10 points.
That difference helps explain each team’s scoring rhythm without requiring assumptions about individual drives.
Compare Quarterback Efficiency
Look beyond passing yards. The most informative basic measures include:
- Completion percentage, which shows the proportion of passes completed.
- Yards per attempt, which helps measure how much passing yardage an offense generated per throw.
- Touchdowns and interceptions, which reveal scoring production and passing mistakes.
- Sacks, which indicate plays where the quarterback was brought down behind the line of scrimmage.
- Passer rating and QBR, which use different methods to assess quarterback performance.
No one measure gives a complete picture. The best assessment combines these statistics with the game situation and available play-by-play information.
Separate Rushing and Receiving Production
Rushing yards and receiving yards describe different roles. A running back’s rushing average should not be compared directly with a wide receiver’s yards per reception as if they measured the same activity.
In this game, Mason’s 3.8 yards per carry reflected ground production, while Smith’s 20.3 yards per catch reflected receiving production. Both figures are useful within their own categories.
Evaluate Defensive Statistics as a Group
Tackles indicate involvement in stopping plays, while sacks and tackles for loss measure certain forms of disruption. Passes defended and interceptions describe activity against passing plays.
The Eagles’ 62 tackles and Minnesota’s 63 tackles were nearly identical totals, but Philadelphia recorded two interceptions and a defensive touchdown. That is why tackle counts alone would miss an important part of the game.
Check the Source Before Repeating a Statistic
When publishing sports content, verify the player names, final score, and individual totals against the original box score. Pay particular attention to totals that can be confused, such as a fumble versus a lost fumble, or a passing touchdown versus a defensive touchdown.
For the official game record and detailed statistical categories, consult the ESPN box score for Philadelphia Eagles vs Minnesota Vikings.
Using the primary box score helps readers distinguish confirmed statistics from interpretations of how the game unfolded.
Frequently Asked Questions
1. Who won the Philadelphia Eagles vs Minnesota Vikings game on October 19, 2025?
The Philadelphia Eagles defeated the Minnesota Vikings 28-22 in their October 19, 2025, NFL regular-season matchup.
2. How many passing yards did Jalen Hurts record against the Vikings?
Jalen Hurts threw for 326 yards, completing 19 of 23 passes with three touchdowns and no interceptions.
3. Who was the leading receiver in the game?
DeVonta Smith led all listed receivers with 183 receiving yards on nine catches. He also recorded one touchdown and a longest reception of 79 yards.
4. How did Carson Wentz perform against Philadelphia?
Carson Wentz completed 26 of 42 passes for 313 yards. He threw no passing touchdowns and was intercepted twice, finishing with a listed passer rating of 64.9.
5. Which defensive player scored a touchdown?
Eagles defender Jalyx Hunt returned an interception 42 yards for a defensive touchdown. Andrew Mukuba recorded Philadelphia’s other interception.
6. Why did Philadelphia win despite Minnesota gaining more rushing yards?
Minnesota recorded 89 rushing yards compared with Philadelphia’s 45, but the Eagles produced three passing touchdowns, avoided interceptions, and scored a defensive touchdown. Those scoring contributions helped Philadelphia win 28-22 despite Minnesota’s rushing advantage.
Conclusion
The Philadelphia Eagles’ 28-22 victory over the Minnesota Vikings on October 19, 2025, was shaped by efficient quarterback play, explosive receiving performances, and a defense that created decisive opportunities. Jalen Hurts completed 19 of 23 passes for 326 yards and three touchdowns without an interception. DeVonta Smith led the receiving group with 183 yards, while A.J. Brown added 121 yards and two touchdown receptions.
Minnesota also produced meaningful offensive numbers. Carson Wentz passed for 313 yards, Jordan Addison gained 128 receiving yards, and Jordan Mason led the rushing attack with 57 yards and a touchdown. The Vikings’ five successful field goals kept the score competitive, but their two interceptions and lack of passing touchdowns proved important differences in the statistical comparison.
Philadelphia’s defensive contribution was especially significant. Jalyx Hunt’s 42-yard interception return touchdown added a direct scoring play, while Andrew Mukuba’s interception gave the Eagles another takeaway. Minnesota generated more rushing yards, sacks, and tackles for loss, showing that the game was not a one-sided contest in every statistical category.
The clearest lesson from the matchup is that football performance cannot be judged by yardage alone. Passing efficiency, scoring conversions, turnovers, and defensive plays all contribute to the final result. Examining these categories together provides a more complete understanding of how Philadelphia secured its six-point win.