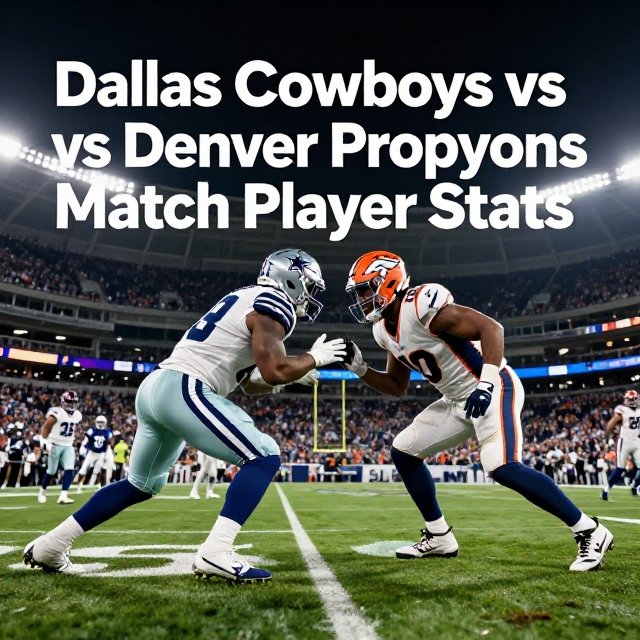
Dallas Cowboys vs Denver Broncos Match Player Stats
Dallas Cowboys vs Denver Broncos match player stats tell the story of a game where Denver’s explosive offense and opportunistic defense overwhelmed Dallas in a 44-24 Week 8 victory. The Broncos turned strong quarterback play, efficient red-zone execution, a productive running game, and three takeaways into a convincing home win at Empower Field at Mile High.
The game was officially played on October 26, 2025, with Denver improving to 6-2 and Dallas moving to 3-4-1 after the result. The Broncos also remained unbeaten at home at 4-0, while the Cowboys dropped to 1-4 on the road. The final score does not fully explain how the game developed, however. Denver built a significant early advantage, Dallas showed some offensive resistance after halftime, and the Broncos responded with another strong fourth quarter to close out the win.
For readers studying the box score, the most important lesson is that this was not simply a quarterback-versus-quarterback contest. Bo Nix’s four touchdown passes were central, but Denver’s 179 rushing yards, 12 pass defenses, eight quarterback hits, and three interceptions created the larger statistical gap.
Dallas Cowboys vs Denver Broncos Match Player Stats at a Glance
The headline numbers immediately show why Denver controlled the game.
| Category | Dallas Cowboys | Denver Broncos |
| Final Score | 24 | 44 |
| Passing Yards | 231 | 247 |
| Passing TDs | 1 | 4 |
| Interceptions Thrown | 2 | 1 |
| Rushing Yards | 108 | 179 |
| Rushing TDs | 2 | 2 |
| Total Receiving Yards | 246 | 247 |
| Receiving TDs | 1 | 4 |
| Team Tackles | 62 | 81 |
| Sacks | 0 | 2 |
| Interceptions Made | 1 | 3 |
| Pass Defenses | 2 | 12 |
| QB Hits | 1 | 8 |
One of the clearest differences is that the passing yardage was relatively close, but the passing production was not.
Dallas finished with 231 passing yards compared with Denver’s 247. That is only a 16-yard difference. Yet Denver scored four passing touchdowns while Dallas managed one. That gap in finishing drives became one of the defining statistical differences of the afternoon.
Quarter-by-Quarter Breakdown
The scoring pattern provides important context for the individual player numbers.
| Quarter | Dallas Cowboys | Denver Broncos |
| 1st | 3 | 14 |
| 2nd | 7 | 13 |
| 3rd | 7 | 3 |
| 4th | 7 | 14 |
| Total | 24 | 44 |
Denver scored 27 points before halftime, giving the Cowboys a major deficit to overcome.
Dallas did respond after the break. The Cowboys scored seven points in each of the final three quarters, including a 7-3 advantage in the third period. That third-quarter response briefly changed the feel of the contest.
The problem was that Dallas could not sustain enough defensive pressure to complete the comeback.
Denver answered with 14 fourth-quarter points and restored control.
Dak Prescott’s Passing Performance
Dak Prescott completed 19 of 31 passes for 188 yards with no touchdowns and two interceptions.
His final passer rating was 51.5, according to the game box score.
The raw completion percentage was:
19 completions / 31 attempts = 61.3%
That completion rate looks respectable in isolation, but the lack of touchdown production and two interceptions significantly reduced the overall value of the passing performance.
Prescott also added 31 rushing yards on six carries. That was an important contribution because Dallas’ offense was not completely one-dimensional. Still, the quarterback’s two interceptions created opportunities that Denver’s defense was able to capitalize on.
The first major issue was efficiency in scoring situations. Dallas moved the ball for 231 total passing yards as a team, but only one passing touchdown came from the entire offense.
The contrast with Denver was dramatic.
Bo Nix produced almost the same amount of passing yardage while throwing four touchdown passes.
That is why the box score should not be evaluated simply by comparing total passing yards.
Prescott’s Final Line
- Completions: 19
- Attempts: 31
- Completion rate: 61.3%
- Passing yards: 188
- Passing touchdowns: 0
- Interceptions: 2
- Sacks: 2 for 15 yards
- Rushing attempts: 6
- Rushing yards: 31
The two interceptions were particularly costly because Denver also recorded two additional interceptions from other Dallas offensive possessions, giving the Broncos three takeaways through the air.
Joe Milton III Provided a Late Spark
Joe Milton III completed 3 of 4 passes for 58 yards and one touchdown.
That produced a much stronger statistical line than Prescott’s on a per-attempt basis, although Milton’s opportunities came in a very different game situation.
His numbers were:
- 3 completions
- 4 attempts
- 58 passing yards
- 1 touchdown
- 0 interceptions
- 156.2 passer rating
Milton’s appearance illustrates why box score statistics require context.
A perfect-looking passer rating over four attempts does not mean a player necessarily outperformed a starting quarterback over a full game. It does, however, show that Dallas found some late passing efficiency and that the offense was capable of producing explosive plays even after falling behind.
Bo Nix Was the Offensive Difference-Maker
Bo Nix delivered one of the strongest statistical performances of the matchup.
He completed 19 of 29 passes for 247 yards, four touchdowns, and one interception.
His completion rate was:
19 / 29 = 65.5%
His passer rating was 117.4.
The most important number, however, was the four passing touchdowns.
Nix averaged 8.5 yards per attempt, compared with Prescott’s 6.1 yards per attempt. That difference demonstrates that Denver was not simply completing short passes to accumulate yardage. The Broncos consistently generated more valuable passing plays.
Nix’s final line:
- Completions: 19
- Attempts: 29
- Completion rate: 65.5%
- Passing yards: 247
- Passing touchdowns: 4
- Interceptions: 1
- Sacks: 0
- Passer rating: 117.4
The zero sacks are also important.
Dallas failed to record a sack on Nix despite attempting to pressure him. Denver’s ability to protect its quarterback allowed Nix to operate without the disruption that can often derail a passing attack.
NFL analysis after the game noted that Dallas generated only seven quarterback pressures and no sacks on Nix’s 29 dropbacks. (NFL)
That is a major reason why the Broncos were able to maintain offensive rhythm.
Javonte Williams Led Dallas on the Ground
Javonte Williams finished with 13 carries for 41 yards and two rushing touchdowns.
His average was:
41 yards / 13 carries = 3.2 yards per carry
The efficiency was not spectacular, but the touchdowns made his performance important.
Williams provided Dallas with both of its rushing touchdowns, which means he accounted for the entire rushing touchdown total of the Cowboys.
That is significant because Dallas was not completely shut down offensively. The Cowboys produced 108 rushing yards and two rushing scores.
The problem was that Denver produced considerably more.
Dak Prescott Added 31 Rushing Yards
Prescott rushed six times for 31 yards.
That equals:
31 / 6 = 5.2 yards per carry
His rushing contribution helped Dallas finish with 108 total rushing yards despite Williams averaging only 3.2 yards per attempt.
Quarterback rushing can be especially valuable when a defense is focused on containing traditional running backs. Prescott’s ability to gain 31 yards gave Dallas another way to move the chains.
However, those yards could not compensate for the difference in passing efficiency and turnovers.
Denver’s Rushing Attack Was More Efficient
J.K. Dobbins produced the biggest rushing performance for Denver with 15 carries for 111 yards.
That works out to:
111 / 15 = 7.4 yards per carry
That was one of the most efficient individual rushing performances of the game.
RJ Harvey added seven carries for 46 yards and two touchdowns, averaging approximately 6.6 yards per carry.
Together, Dobbins and Harvey gave Denver a strong combination of efficiency and scoring production.
Denver finished with:
- 28 carries
- 179 rushing yards
- 2 rushing touchdowns
- 6.4 yards per carry
Dallas finished with:
- 31 carries
- 108 rushing yards
- 2 rushing touchdowns
- 3.5 yards per carry
This is one of the clearest statistical explanations for Denver’s victory.
Dallas actually ran the ball three more times, but Denver gained 71 more rushing yards.
That means the Broncos were getting much more production from each rushing opportunity.
J.K. Dobbins Was a Major Offensive Factor
Dobbins did not score a rushing touchdown, but his 111 yards were highly valuable.
A running back crossing the 100-yard mark while averaging 7.4 yards per carry creates problems for an opposing defense because it forces defenders to respect the run.
That can create more favorable passing opportunities later in the game.
Dobbins’ performance also helped Denver control the balance of the offense. Nix did not need to throw 40 or 50 passes because the Broncos could move the ball efficiently on the ground.
That balance is an important part of understanding the matchup.
RJ Harvey Added Two Touchdowns
RJ Harvey carried the ball seven times for 46 yards and scored two rushing touchdowns.
His statistical contribution was particularly valuable in the red zone.
Harvey averaged approximately 6.6 yards per carry while finding the end zone twice. Those touchdowns helped convert Denver’s offensive production into scoreboard pressure.
This is an important distinction when evaluating player stats.
A player can gain fewer yards than another teammate but still have a greater impact on the final score because of where those plays occur.
Harvey’s two rushing touchdowns are a perfect example.
George Pickens Led Dallas Receivers
George Pickens recorded seven receptions for 78 yards.
His average gain per reception was:
78 / 7 = 11.1 yards
Pickens was Dallas’ leading receiver by yardage.
His seven catches also tied CeeDee Lamb for the team lead in receptions.
Pickens’ performance showed that Dallas could create receiving production despite the difficult game script.
The Cowboys finished with 25 receptions for 246 yards and one receiving touchdown.
CeeDee Lamb Remained a Major Part of the Passing Game
CeeDee Lamb caught seven passes for 74 yards.
His average was approximately 10.6 yards per reception.
Lamb’s seven receptions matched Pickens’ total, but Pickens finished four yards ahead in receiving yardage.
The important takeaway is that Dallas did not completely lose its ability to involve its primary receiving options.
Instead, the larger problem was what happened after the catches and in scoring situations.
Dallas had 246 receiving yards, but only one receiving touchdown.
That tells us the Cowboys moved the ball through the air without converting enough of those possessions into touchdowns.
Jalen Tolbert Produced Dallas’ Receiving Touchdown
Jalen Tolbert caught two passes for 47 yards and one touchdown.
His average of 23.5 yards per reception made him one of Dallas’ most explosive receiving threats in the game.
Tolbert’s two receptions accounted for nearly one-fifth of Dallas’ receiving yards.
That is a useful example of why reception totals alone do not measure offensive impact.
A player with two catches can have a major statistical influence if those catches are explosive or result in touchdowns.
Troy Franklin Was Denver’s Receiving Star
Troy Franklin finished with six receptions for 89 yards and two touchdowns.
His average was:
89 / 6 = 14.8 yards per reception
Franklin was Denver’s leading receiver by yardage and also led the Broncos in receiving touchdowns.
His two touchdown catches were a major part of Nix’s four-touchdown passing performance.
Franklin’s numbers also demonstrate Denver’s ability to generate explosive receiving plays without relying on a single high-volume target.
The Broncos finished with only 19 receptions but still produced 247 receiving yards.
That is an average of approximately 13.0 yards per reception.
Dallas had 25 receptions for 246 yards, or approximately 9.8 yards per reception.
So the Cowboys actually caught six more passes, but Denver gained one more receiving yard.
The difference was efficiency.
Courtland Sutton Provided Veteran Stability
Courtland Sutton recorded four receptions for 67 yards.
His average was 16.8 yards per reception.
Sutton did not lead Denver in catches or touchdowns, but his 67 yards provided a valuable intermediate and downfield contribution.
His presence alongside Franklin and the other Denver receivers made it more difficult for Dallas to focus its defensive attention on a single target.
Pat Bryant Also Found the End Zone
Pat Bryant recorded two receptions for 40 yards and one touchdown.
His 20.0 yards per reception average was excellent.
Bryant’s touchdown was another example of Denver spreading its scoring production across multiple players.
Nix threw four touchdowns, with Franklin accounting for two and Bryant accounting for one. The remaining passing touchdown also contributed to Denver’s unusually efficient scoring performance.
Dallas vs Denver Defensive Comparison
The defensive numbers may be even more revealing than the offensive statistics.
Dallas recorded:
- 62 total tackles
- 33 solo tackles
- 0 sacks
- 3 tackles for loss
- 2 pass defenses
- 1 quarterback hit
- 1 interception
Denver recorded:
- 81 total tackles
- 31 solo tackles
- 2 sacks
- 3 tackles for loss
- 12 pass defenses
- 8 quarterback hits
- 3 interceptions
The biggest difference is pressure and disruption.
Denver produced eight quarterback hits compared with one for Dallas.
The Broncos also defended 12 passes compared with only two by Dallas.
That indicates Denver’s defense was consistently affecting the passing game.
Denver’s Three Interceptions Changed the Game
Dallas threw two interceptions through Prescott, while Denver threw one interception through Nix.
The Cowboys did get one interception of their own, with Trikweze Bridges returning it seven yards.
Denver, however, generated two interceptions from Dondrea Tillman and Jahdae Barron.
Dondrea Tillman’s interception was particularly valuable because he returned it 36 yards.
These plays mattered because turnovers are not merely negative passing statistics. They can immediately change field position and possession value.
Denver finished the game with three interceptions.
Dallas finished with one.
That two-interception advantage helped the Broncos create additional opportunities while preventing Dallas from sustaining offensive momentum.
Dallas’ Defensive Pressure Was Not Enough
One of the biggest concerns for Dallas was the lack of quarterback pressure.
Nix threw 29 passes and was not sacked.
Dallas managed only one quarterback hit according to the supplied defensive statistics.
By contrast, Denver recorded eight quarterback hits and two sacks.
That imbalance allowed Nix to operate with much more comfort than Prescott.
The Broncos’ defensive front also benefited from Dallas having to throw while playing from behind. Once Denver established a significant lead, the Cowboys had fewer opportunities to dictate the game through a balanced attack.
Special Teams Statistics
Special teams were not the primary reason for the final score, but several individual performances are worth noting.
KaVontae Turpin
Turpin returned three kickoffs for 86 yards.
His average was 28.7 yards per return, with a long return of 33 yards.
That gave Dallas respectable starting field position on kickoff opportunities.
Marvin Mims Jr.
Mims returned three kickoffs for 93 yards and added two punt returns for 26 yards.
His kickoff average was 31.0 yards per return.
His punt return average was 13.0 yards.
That combination made Mims a significant field-position contributor for Denver.
Brandon Aubrey
Aubrey converted his only field-goal attempt from 24 yards and made all three extra-point attempts.
He finished with six points.
Wil Lutz
Lutz converted a 42-yard field goal and all five extra-point attempts.
He finished with eight points.
Punting Comparison
Dallas punter Bryan Anger recorded five punts for 252 yards.
His average was 50.4 yards per punt, with three punts landing inside the 20-yard line.
His longest punt traveled 58 yards.
Denver punter Jeremy Crawshaw had two punts for 80 yards, averaging 40.0 yards, with a long of 47 yards.
The difference in punt volume is telling.
Dallas punted five times, while Denver needed only two punts.
That suggests Denver was sustaining drives more consistently and finishing possessions more effectively.
Why Denver Won the Game
The simplest explanation is that Denver won in several areas simultaneously.
1. Denver was more efficient passing the ball
Nix and Prescott produced similar passing yardage totals.
Nix:
247 yards, 4 touchdowns, 1 interception
Prescott:
188 yards, 0 touchdowns, 2 interceptions
The difference in touchdown production was enormous.
2. Denver dominated rushing efficiency
Denver averaged 6.4 yards per rushing attempt.
Dallas averaged 3.5.
That gave Denver an additional offensive advantage.
3. Denver generated more defensive disruption
Eight quarterback hits and two sacks gave the Broncos a significant pressure advantage.
Dallas recorded only one quarterback hit and no sacks.
4. Denver won the turnover battle
The Broncos intercepted Dallas three times.
Dallas intercepted Denver once.
5. Denver was better at converting production into points
This may be the most important overall observation.
Dallas produced:
- 231 passing yards
- 108 rushing yards
- 246 receiving yards
Denver produced:
- 247 passing yards
- 179 rushing yards
- 247 receiving yards
The offensive yardage totals were not separated by an enormous margin in the passing game.
Yet the final score was 44-24.
The explanation is efficiency, turnovers, touchdowns, and defensive pressure.
What the Box Score Says About Dallas
The Cowboys’ offensive numbers were not disastrous in every category.
They had 231 passing yards.
They had 108 rushing yards.
They produced 25 receptions for 246 yards.
They scored 24 points.
But the offense was not efficient enough when the game was most competitive.
Prescott’s two interceptions were costly.
The passing game produced only one touchdown.
The rushing attack averaged just 3.5 yards per carry.
Most importantly, the defense could not consistently stop Denver.
That combination created a difficult situation: Dallas had enough offensive production to score 24 points but not enough defensive resistance to keep Denver from reaching 44.
What the Box Score Says About Denver
Denver’s numbers show a balanced and efficient team.
The Broncos did not need an extreme passing volume.
They did not need Nix to throw 40 passes.
Instead, they produced 247 passing yards, 179 rushing yards, and six total touchdowns.
The defense then added three interceptions and two sacks.
That is a formula that can produce decisive wins.
The Broncos also had several different players contributing rather than relying entirely on one star.
Nix controlled the passing game.
Dobbins led the rushing attack.
Harvey scored twice on the ground.
Franklin scored twice through the air.
Bryant also scored a receiving touchdown.
That distribution made Denver difficult to contain.
The Most Important Statistical Mismatch
If one statistic had to be selected to explain the game, it would be offensive efficiency per opportunity rather than total yardage.
Dallas actually generated 246 receiving yards compared with Denver’s 247.
That is almost identical.
Yet Denver scored four receiving touchdowns while Dallas scored one.
The Broncos also averaged 6.4 yards per carry compared with Dallas’ 3.5.
Denver combined explosive passing with efficient rushing.
Dallas generated yardage but did not consistently turn that yardage into touchdowns.
That is the central statistical lesson from this matchup.
Player Impact Rankings
Based strictly on the supplied game statistics, the most influential individual performances can be summarized as follows.
1. Bo Nix
Nix completed 19 of 29 passes for 247 yards, four touchdowns, and one interception.
His efficiency and touchdown production made him the most influential offensive player.
2. J.K. Dobbins
Dobbins rushed for 111 yards on only 15 attempts.
His 7.4 yards per carry helped Denver maintain balance.
3. Troy Franklin
Franklin caught six passes for 89 yards and two touchdowns.
His two scores directly contributed to Nix’s excellent passing line.
4. RJ Harvey
Harvey produced 46 rushing yards and two touchdowns on seven carries.
His red-zone impact was significant.
5. George Pickens
Pickens led Dallas with 78 receiving yards on seven catches.
He remained one of the Cowboys’ most productive passing-game players.
6. Dak Prescott
Prescott produced 188 passing yards and 31 rushing yards, but his two interceptions and lack of passing touchdowns limited his overall impact.
Dallas Cowboys vs Denver Broncos Match Player Stats: What to Remember
The most useful way to interpret Dallas Cowboys vs Denver Broncos match player stats is to look beyond the final score and individual yardage totals.
Denver won because its production was more efficient.
Nix turned 29 pass attempts into 247 yards and four touchdowns.
Dobbins turned 15 carries into 111 yards.
Harvey added two rushing touchdowns.
Franklin produced 89 receiving yards and two touchdowns.
The defense then added three interceptions, two sacks, 12 pass defenses, and eight quarterback hits.
Dallas had productive individual performances as well.
Pickens caught seven passes for 78 yards.
Lamb caught seven for 74.
Williams scored twice on the ground.
Prescott added 31 rushing yards.
But the Cowboys could not match Denver’s efficiency or defensive disruption.
How These Stats Can Be Used for Future Match Analysis
A useful approach to NFL player-stat analysis is to avoid judging a game from one category.
Instead, compare five areas:
- Passing efficiency: Look at completion percentage, yards per attempt, touchdowns, interceptions, and sacks.
- Rushing efficiency: Compare yards per carry rather than rushing yards alone.
- Receiving efficiency: Examine yards per reception alongside catches and touchdowns.
- Defensive disruption: Track sacks, quarterback hits, tackles for loss, pass defenses, and interceptions.
- Scoring conversion: Determine whether offensive yardage is being converted into touchdowns.
Using this framework makes the Denver victory easier to understand.
Dallas and Denver were relatively close in passing and receiving yardage.
They were not close in rushing efficiency, passing touchdowns, quarterback pressure, or interceptions.
That is where the game was actually decided.
Frequently Asked Questions
What was the final score between the Cowboys and Broncos?
The Denver Broncos defeated the Dallas Cowboys 44-24 in Week 8 of the 2025 NFL season.
Who was the leading passer?
Denver quarterback Bo Nix was the leading passer. He completed 19 of 29 attempts for 247 yards, four touchdowns, and one interception.
How did Dak Prescott perform?
Dak Prescott completed 19 of 31 passes for 188 yards with no passing touchdowns and two interceptions. He also rushed for 31 yards on six carries.
Who led the game in rushing?
J.K. Dobbins led the game with 111 rushing yards on 15 carries for Denver. He averaged 7.4 yards per carry.
Who was the leading receiver?
Troy Franklin led Denver with 89 receiving yards and two touchdowns. Dallas was led by George Pickens with 78 yards on seven receptions.
How many turnovers did each team have?
Dallas threw three interceptions in total according to the defensive interception statistics, while Denver threw one interception. The Cowboys also recorded one interception against Denver’s offense, while the Broncos recorded three.
Conclusion
The Dallas Cowboys vs Denver Broncos match player stats show a game decided by efficiency rather than raw yardage alone.
Denver finished with 247 passing yards and 179 rushing yards while producing six total touchdowns. Bo Nix delivered four touchdown passes, J.K. Dobbins surpassed 100 rushing yards, RJ Harvey scored twice on the ground, and Troy Franklin caught two touchdown passes.
Dallas still generated meaningful offensive production. George Pickens and CeeDee Lamb each caught seven passes, Javonte Williams scored twice rushing, and the Cowboys finished with 231 passing yards and 108 rushing yards.
The difference came from execution.
Denver averaged more yards per rushing attempt, produced four passing touchdowns, generated three interceptions, recorded two sacks, and created significantly more quarterback pressure. Dallas could not turn its offensive yardage into points at the same rate.
The 44-24 result therefore reflects more than a simple statistical advantage. It shows how explosive plays, red-zone execution, turnovers, defensive pressure, and rushing efficiency can combine to create a decisive NFL result even when the passing and receiving yardage totals appear relatively close.
For anyone analyzing this matchup, the most valuable lesson is to read the complete statistical picture rather than relying on one headline number. Yardage explains how teams moved the ball, but efficiency and turnovers often explain why one team actually won.