New Orleans Pelicans vs Celtics Match Player Stats
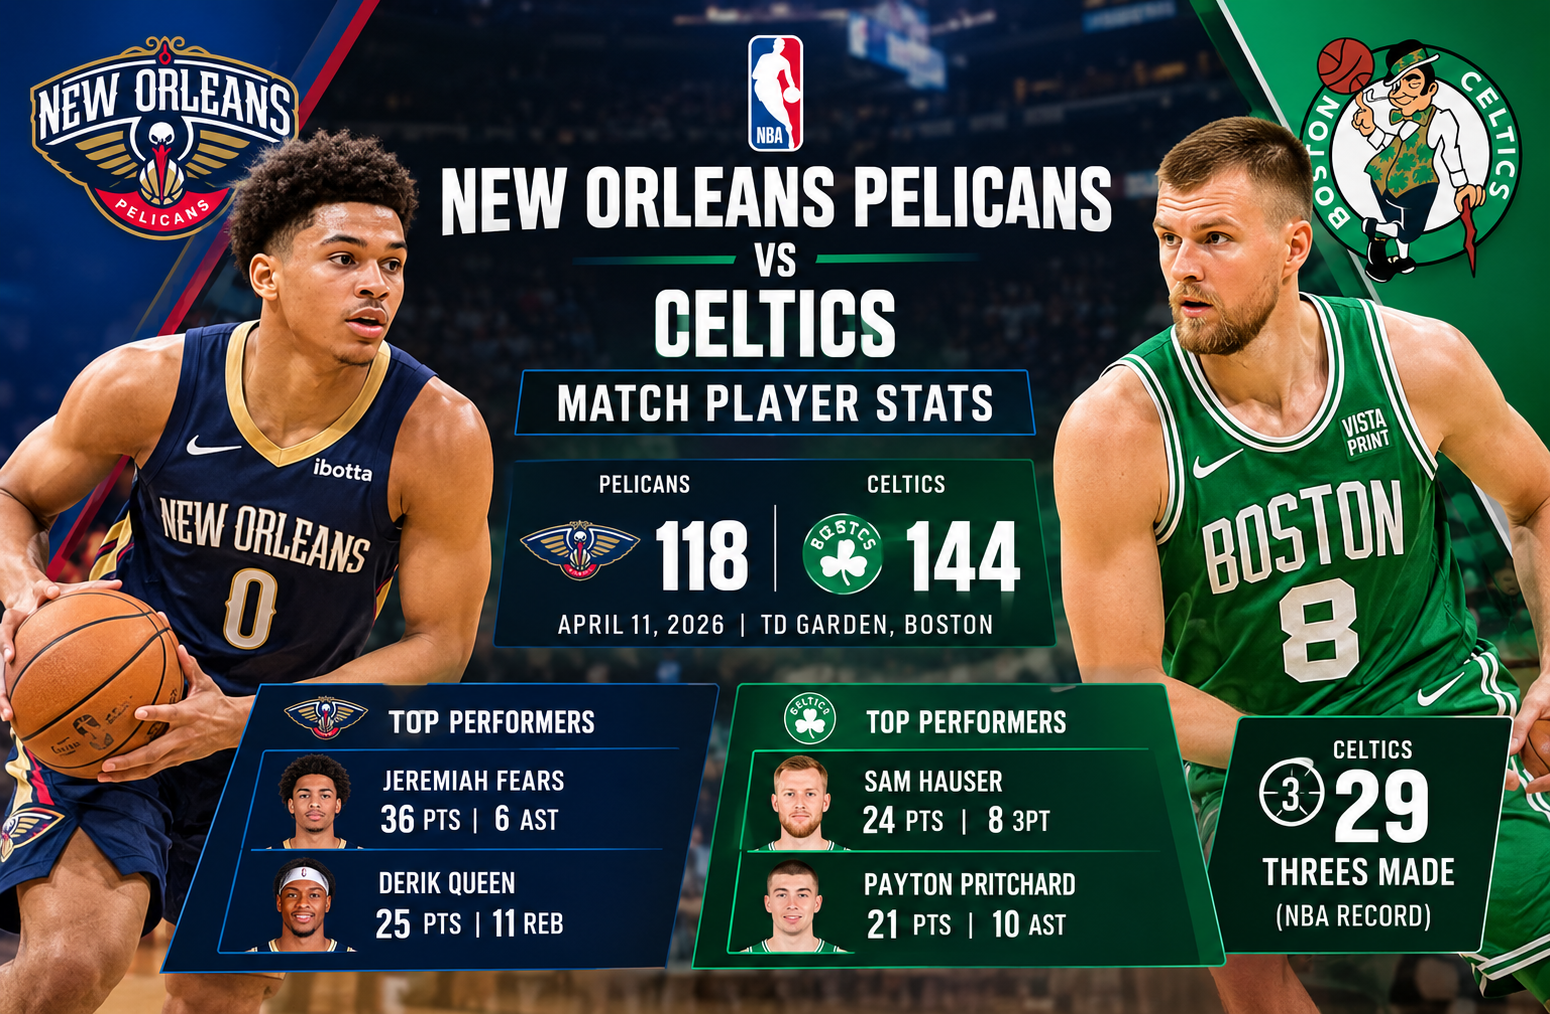
The New Orleans Pelicans vs Celtics match player stats from the April 10, 2026 matchup tell a much bigger story than the final score alone. Boston defeated New Orleans 144-118 at TD Garden, but the defining feature of the game was not simply the 26-point margin. The Celtics produced an extraordinary three-point shooting display, tying the NBA record with 29 made threes while building a 22-point lead after the opening quarter. (NBA)
There is one date detail worth clarifying for readers. The official NBA and ESPN records list the game as Friday, April 10, 2026 in Boston, while viewers in Pakistan and other locations ahead of U.S. Eastern Time may have experienced the game during the early hours of April 11. The official box score is therefore best treated as an April 10 Boston game. (ESPN)
The result also completed Boston’s 2-0 season sweep of New Orleans. More importantly, it showed why raw points alone can be misleading when evaluating an NBA performance. Jeremiah Fears scored 36 points and Derik Queen posted 25 points and 11 rebounds for the Pelicans, yet Boston’s spacing, three-point volume, passing and early offensive pressure made the game difficult to recover.
Game Overview
The Celtics entered the contest at 54-26 and needed one more victory to secure the No. 2 seed in the Eastern Conference. They got it in emphatic fashion, moving to 55-26 after the 144-118 victory. The Pelicans fell to 26-55. (NBA)
The official game information lists:
| Category | New Orleans Pelicans | Boston Celtics |
| Final score | 118 | 144 |
| First quarter | 25 | 44 |
| Second quarter | 26 | 38 |
| Third quarter | 31 | 34 |
| Fourth quarter | 36 | 28 |
| Field goals | 44-96 | 52-96 |
| Field-goal percentage | 46% | 54% |
| Three-pointers | 9-32 | 29-59 |
| Three-point percentage | 28% | 49% |
| Free throws | 21-30 | 11-15 |
| Rebounds | 44 | 44 |
| Assists | 22 | 35 |
| Turnovers | 13 | 13 |
| Steals | 6 | 9 |
| Blocks | 3 | 5 |
The numbers immediately reveal the central difference. Both teams attempted exactly 96 field goals and collected exactly 44 rebounds. Both committed 13 turnovers. Boston nevertheless scored 26 more points.
The explanation is Boston’s three-point production.
The Celtics made 29 threes compared with only nine for New Orleans. That is a 60-point difference in three-point scoring alone. Boston also shot 49% from deep, while New Orleans shot 28%. (ESPN)
That shooting gap overwhelmed several areas where the teams were otherwise relatively close.
New Orleans Pelicans vs Celtics Match Player Stats: Key Performers
The individual numbers provide a clearer picture of how the game developed.
Jeremiah Fears Leads New Orleans
Jeremiah Fears was the standout offensive player for New Orleans.
He finished with:
- 36 points
- 13-of-29 shooting
- 3-of-10 from three
- 7-of-11 from the free-throw line
- 3 rebounds
- 6 assists
- 3 steals
- 1 turnover
Fears played 44 minutes and was responsible for a substantial portion of the Pelicans’ offense. His six assists also show that his contribution was not limited to scoring. (ESPN)
His 36 points were particularly notable because Boston’s defensive pressure made efficient scoring difficult for much of the night. Fears had to take 29 field-goal attempts to reach that total.
That does not make his performance poor. Quite the opposite. For a young guard operating against a team playing with playoff-level urgency, producing 36 points and six assists is significant.
The issue was that New Orleans did not have enough efficient secondary scoring to match Boston’s offensive balance.
Derik Queen Provides a Strong Interior Performance
Derik Queen was New Orleans’ other major offensive contributor.
He recorded:
- 25 points
- 9-of-14 shooting
- 7-of-9 free throws
- 11 rebounds
- 4 assists
- 1 steal
- 3 blocks
Queen’s 64.3% field-goal shooting was one of the most efficient individual performances on either side. He also became the Pelicans’ leading rebounder. (NBA)
His 25-point, 11-rebound double-double matters because it demonstrates that New Orleans did have a productive interior option.
The problem was that Queen’s efficiency could not compensate for Boston’s perimeter advantage.
He shot 0-for-2 from three, while Boston repeatedly generated open perimeter attempts. That created a fundamental contrast between the teams. New Orleans could score efficiently in selected areas, but Boston consistently attacked the highest-value part of the floor.
Jordan Poole Has a Difficult Night
Jordan Poole finished with 11 points on 3-of-10 shooting.
His final line included:
- 11 points
- 3-of-10 field goals
- 2-of-5 three-pointers
- 3-of-5 free throws
- 3 rebounds
- 3 assists
- 5 turnovers
- 1 steal
The five turnovers were especially damaging because New Orleans had limited room for wasted possessions against an opponent shooting at such a high level.
Poole did contribute as a playmaker, but his five turnovers reduced the value of his offensive involvement. (ESPN)
Kevon Looney’s Defensive and Rebounding Role
Kevon Looney did not score, going 0-for-2 from the field, but his six rebounds and three assists show why box-score analysis should not focus exclusively on scoring.
He played nearly 25 minutes and contributed six rebounds, three assists and one steal. (NBA)
His offensive limitations, however, allowed Boston to devote more attention to other Pelicans players.
Micah Peavy Struggles From the Field
Micah Peavy finished with just two points on 1-of-7 shooting.
He added two rebounds and one assist while committing five fouls. His limited scoring became more important because Boston was already forcing New Orleans to rely heavily on Fears and Queen.
When two or three offensive players carry most of the scoring burden, an opponent with Boston’s shooting ability can create too large a gap too quickly.
Boston Celtics Player Stats
Boston’s box score was much more balanced.
Sam Hauser led the Celtics with 24 points, Jaylen Brown scored 23, and Payton Pritchard contributed 21 points and 10 assists. (NBA)
That distribution is important. Boston did not need one player to dominate the ball for 40-plus minutes.
Sam Hauser’s Eight Three-Pointers
Sam Hauser delivered the signature shooting performance of the night.
He finished with:
- 24 points
- 8-of-13 field goals
- 8-of-12 three-pointers
- 6 rebounds
- 4 assists
- 0 turnovers
- +21 plus/minus
His eight made threes were the centerpiece of Boston’s perimeter attack. (ESPN)
Hauser’s 8-for-12 shooting from deep is especially striking because he scored 24 points without attempting a free throw.
That is the purest example of Boston’s offensive identity in this game. Instead of relying on frequent drives and free throws, the Celtics generated an enormous number of high-value perimeter attempts.
Jaylen Brown Sets the Tone Early
Jaylen Brown scored 23 points in only 29 minutes.
He shot 8-of-13 overall, including 2-of-3 from three, and added five free throws. He also grabbed three rebounds and finished with a +24 plus/minus. (ESPN)
Brown’s importance was not just his final scoring total.
According to the official game recap, he scored 12 points in the first quarter, helping Boston establish a 44-25 advantage. He then sat out the entire fourth quarter. (NBA)
That sequence says a lot about how decisively Boston controlled the game.
Payton Pritchard Controls the Offense
Payton Pritchard had one of the most complete games on the Boston roster.
His line:
- 21 points
- 7-of-14 shooting
- 5-of-9 from three
- 2-of-2 free throws
- 3 rebounds
- 10 assists
- 1 steal
- 1 turnover
- +29 plus/minus
The 10 assists are particularly important.
Pritchard’s ability to create shots for teammates helped Boston reach 35 total assists. New Orleans had only 22. (ESPN)
The +29 was also the best plus/minus figure in the game.
That does not mean plus/minus should be treated as an isolated measure of individual quality, but in this particular contest it reinforces what the broader numbers already show: Boston’s lineups featuring Pritchard were extremely effective.
Neemias Queta Provides Interior Value
Neemias Queta scored seven points and grabbed 10 rebounds.
He shot 3-of-3 from the field and also recorded two assists and one block. More unusually, he made his only three-point attempt. (ESPN)
His 10 rebounds were the most for Boston.
Queta’s contribution also illustrates why Boston did not need its big men to dominate offensively. The Celtics were getting production from the perimeter while their interior players supplied rebounding, screens, passing and defensive support.
Derrick White’s Two-Way Contribution
Derrick White scored nine points on 3-of-9 shooting and made all three of his three-point attempts.
He also recorded five assists, two rebounds and one steal.
White’s offensive volume was modest, but his perfect 3-for-3 shooting from beyond the arc further contributed to Boston’s overall perimeter efficiency. (ESPN)
Why Boston Won by 26 Points
The final margin becomes easier to understand when the game is broken into possession-level categories.
1. The Three-Point Gap Was Massive
Boston made 29 threes.
New Orleans made nine.
That means Boston converted 20 more three-pointers.
Because every made three is worth three points, Boston gained 60 additional points from made threes compared with 18 for New Orleans.
The Celtics’ 29 made threes also tied the NBA record for most three-pointers by a team in one game. (NBA)
This was not merely a good shooting night. It was historically significant.
2. Boston Shot Better Overall
Boston went 52-of-96 from the field, compared with 44-of-96 for New Orleans.
That works out to 54% versus 46%.
Eight additional made field goals already provide a significant advantage. When those field goals are combined with 20 more made threes, the difference becomes overwhelming.
3. Passing Created Better Shot Quality
Boston finished with 35 assists.
New Orleans had 22.
That 13-assist difference is one of the clearest indicators of how the Celtics generated their offense.
Boston’s offense was not built around one player repeatedly creating difficult shots. The ball moved, shooters relocated and multiple players benefited.
Pritchard’s 10 assists were especially valuable.
4. Turnovers Were Not the Explanation
Both teams committed 13 turnovers.
That is important because it rules out one common explanation for a large NBA margin.
Boston did not win because New Orleans repeatedly gave the ball away while the Celtics protected every possession.
The teams were tied in turnovers.
Boston simply converted its possessions more efficiently.
5. Rebounding Was Even
Both teams grabbed 44 rebounds.
That makes the result even more interesting.
New Orleans did not get crushed on the glass. Queen had 11 rebounds, while Queta had 10 for Boston.
The Celtics won because of shot-making, offensive organization and perimeter efficiency rather than a dominant rebounding advantage.
The First Quarter Decided the Game
The opening period deserves special attention.
Boston scored 44 points.
New Orleans scored 25.
That created a 19-point difference after only 12 minutes.
Boston’s first-quarter attack was powered by Brown and the Celtics’ three-point shooting. The Pelicans were effectively forced into catch-up basketball almost immediately. (NBA)
The quarter-by-quarter progression was:
- Q1: Boston 44, New Orleans 25
- Q2: Boston 38, New Orleans 26
- Q3: Boston 34, New Orleans 31
- Q4: New Orleans 36, Boston 28
New Orleans actually won the fourth quarter by eight points.
That detail is easy to miss when looking only at the final score.
It also shows why the final margin should not be interpreted as four quarters of equal dominance. Boston created the decisive separation early, then controlled the game from a position of strength.
New Orleans Improved After Halftime
The Pelicans deserve credit for continuing to compete after falling behind.
They scored 31 points in the third quarter and 36 in the fourth.
Fears remained productive, Queen continued to score efficiently, and New Orleans finished the game with 118 points.
The issue was that Boston’s first-half advantage was too large.
A team cannot realistically expect to erase a 31-point halftime deficit against an opponent that is shooting 49% from three.
That is where game context matters more than the final box score.
What the Team Shooting Numbers Really Say
A useful way to analyze this matchup is to separate shot volume from shot efficiency.
Both teams:
- Attempted 96 field goals
- Collected 44 rebounds
- Committed 13 turnovers
So the Pelicans and Celtics were remarkably similar in several possession-related areas.
Yet their shooting profiles were completely different.
Boston:
- 52 field goals made
- 29 three-pointers made
- 54% overall shooting
- 49% three-point shooting
New Orleans:
- 44 field goals made
- 9 three-pointers made
- 46% overall shooting
- 28% three-point shooting
This is the central statistical lesson from the matchup.
Boston did not need more opportunities.
It made substantially more of the opportunities it received.
Free Throws Were Not the Main Difference
New Orleans actually attempted more free throws.
The Pelicans went 21-of-30.
Boston went 11-of-15.
That gave New Orleans 15 more free-throw attempts.
Yet Boston still won by 26 points.
This is important because free throws can sometimes hide a team’s shooting weakness. In this game, New Orleans received more opportunities at the line but could not overcome Boston’s three-point production.
The Celtics’ 29 made threes were simply too powerful a scoring advantage.
New Orleans Pelicans vs Celtics Match Player Stats and Plus/Minus
Plus/minus is not a perfect individual statistic, but it can add useful context when combined with the rest of the box score.
For Boston:
- Payton Pritchard: +29
- Jaylen Brown: +24
- Sam Hauser: +21
- Derrick White: +18
- Jordan Walsh: +17
For New Orleans, the starting lineup largely posted negative numbers, with Fears at -32 and Poole at -40.
The most interesting Pelicans bench result came from Josh Oduro, who finished +6 while scoring 12 points and grabbing 12 rebounds. (ESPN)
That is a useful reminder that plus/minus can reveal lineup impact that raw scoring totals do not immediately show.
What the Matchup Says About Boston
Boston’s performance demonstrated the value of spacing and offensive balance.
The Celtics had several players capable of punishing defensive mistakes from outside.
Hauser made eight threes.
Pritchard made five.
White made three.
Brown made two.
Jordan Walsh made two.
Several other Celtics also contributed from distance. Eight Boston players made at least two threes, according to the official recap. (NBA)
That distribution makes defensive planning extremely difficult.
A defense can focus on one primary scorer, but it becomes much harder to help aggressively when multiple players can punish a late rotation.
What the Matchup Says About New Orleans
For New Orleans, the game exposed the challenge of competing with an elite shooting team without matching its perimeter efficiency.
Fears showed significant scoring ability.
Queen demonstrated efficient interior production and rebounding.
But the Pelicans received only nine made threes from the entire roster.
Against a team making 29, that creates an enormous tactical problem.
The Pelicans also had only 22 assists, meaning their offensive attack was less collaborative than Boston’s.
There is nothing inherently wrong with a high-usage scorer carrying an offense, especially when that scorer is producing efficiently. But against a team that is spreading the floor and creating 35 assists, New Orleans needed more collective shot creation.
Season Series: Boston Sweeps New Orleans
The Celtics won both meetings during the season.
The first matchup ended 122-90 in Boston on October 28.
The second ended 144-118 on April 10.
That means Boston outscored New Orleans by 78 points across the two games.
The second meeting was even more explosive offensively, with Boston tying the NBA record for three-pointers made in a game. (NBA)
The season series therefore provides useful context. The 144-118 result was not an isolated statistical accident. Boston had already defeated New Orleans comfortably earlier in the season.
The Bigger Playoff Context
The Celtics’ victory had significance beyond the individual matchup.
Boston secured the No. 2 seed in the Eastern Conference with the win. The victory moved the Celtics to 55-26 with one regular-season game remaining. (NBA)
That context helps explain the urgency of the opening minutes.
Boston was not simply experimenting with lineups or treating the game as a meaningless late-season contest.
The team had a specific competitive objective and achieved it decisively.
The Pelicans, meanwhile, entered the game at 26-55 and were already out of postseason contention.
That difference in competitive circumstances is worth mentioning whenever readers compare the raw numbers.
A Practical Way to Read This Box Score
If you are researching this matchup for fantasy analysis, historical comparison, team evaluation or player-performance research, the best approach is to examine the numbers in layers.
Start With the Score
Boston won 144-118.
That establishes the outcome but explains very little by itself.
Check Shooting
The next question should be how the teams produced those points.
Boston shot 54% overall and 49% from three.
New Orleans shot 46% overall and 28% from three.
Now the margin starts to make sense.
Check Assists
Boston had 35 assists compared with 22 for New Orleans.
That helps explain the difference in offensive flow.
Check Turnovers
Both teams had 13.
This tells us turnovers were not the primary cause of the defeat.
Check Rebounds
Both teams had 44.
Again, rebounding was not the decisive factor.
Check Individual Usage
Fears attempted 29 shots.
Queen attempted 14.
Those two players accounted for 43 field-goal attempts for New Orleans.
Boston’s scoring was distributed more broadly, allowing the Celtics to maintain efficiency without relying on one player to carry every possession.
Player Comparison Table
| Player | Team | Points | Rebounds | Assists | FG | 3PT |
| Jeremiah Fears | Pelicans | 36 | 3 | 6 | 13-29 | 3-10 |
| Derik Queen | Pelicans | 25 | 11 | 4 | 9-14 | 0-2 |
| Jordan Poole | Pelicans | 11 | 3 | 3 | 3-10 | 2-5 |
| Josh Oduro | Pelicans | 12 | 12 | 1 | 5-8 | 0-2 |
| Sam Hauser | Celtics | 24 | 6 | 4 | 8-13 | 8-12 |
| Jaylen Brown | Celtics | 23 | 3 | 1 | 8-13 | 2-3 |
| Payton Pritchard | Celtics | 21 | 3 | 10 | 7-14 | 5-9 |
| Nikola Vucevic | Celtics | 14 | 4 | 5 | 5-7 | 3-5 |
| Luka Garza | Celtics | 14 | 6 | 2 | 6-13 | 0-3 |
The table demonstrates the balance of Boston’s offense. Four Celtics players scored at least 14 points, while Hauser, Brown and Pritchard combined for 68.
Which Players Had the Biggest Statistical Impact?
If the goal is to identify the most important individual performances rather than simply the highest scorers, several players stand out.
Jeremiah Fears: Best scorer for New Orleans with 36 points and six assists.
Derik Queen: Most complete Pelicans interior performance with 25 points, 11 rebounds and three blocks.
Sam Hauser: Most explosive shooter with 24 points and eight made threes.
Payton Pritchard: Best overall statistical balance with 21 points, 10 assists and a game-best +29.
Jaylen Brown: Crucial early-game scorer who helped Boston build its decisive first-quarter advantage.
Neemias Queta: Strong rebounding performance with 10 boards and efficient 3-for-3 shooting.
Important Takeaways From the Box Score
Several conclusions stand out after separating the game into its main statistical components.
Boston’s Three-Point Shooting Was Historic
Twenty-nine made threes tied the NBA record.
That is the headline number from the game and the clearest explanation for the 144-point output. (NBA)
Fears Was Outstanding Despite the Loss
A 36-point performance should not be dismissed simply because it came in a defeat.
Fears also had six assists and three steals.
His individual production was one of the strongest positives for New Orleans.
Queen Was Extremely Efficient
Queen’s 9-of-14 shooting and 11 rebounds made him one of the game’s most efficient players.
His performance was especially impressive given Boston’s overall defensive control.
Pritchard’s Passing Was Critical
Ten assists from Pritchard helped Boston reach 35 team assists.
His +29 plus/minus also led every player in the game.
Rebounding Did Not Decide the Result
Both teams finished with 44 rebounds.
This is a classic example of why one cannot evaluate an NBA game by a single traditional category.
Turnovers Were Equal
Both teams had 13 turnovers.
Again, the difference came from what happened after possessions were successfully created, not from one team constantly giving possessions away.
Official Data Source
For readers who want to inspect the complete player-by-player box score, the official NBA box score provides the full shooting, rebounding, assists, steals, blocks, turnovers and plus/minus breakdown. Official NBA box score for Pelicans vs. Celtics
The NBA record confirms the 144-118 result, the 29 made threes and the individual performances discussed above. (NBA)
Frequently Asked Questions
Who led the Pelicans in scoring against the Celtics?
Jeremiah Fears led New Orleans with 36 points. He also recorded six assists and three steals.
Who led the Celtics in scoring?
Sam Hauser led Boston with 24 points. He made eight three-pointers on 12 attempts.
How many three-pointers did the Celtics make?
Boston made 29 three-pointers on 59 attempts. The 29 makes tied the NBA record for most three-pointers by a team in one game. (NBA)
What was Derik Queen’s stat line?
Derik Queen finished with 25 points, 11 rebounds, four assists, one steal and three blocks while shooting 9-of-14 from the field.
Who had the most assists?
Payton Pritchard led all players with 10 assists. He also scored 21 points and finished with a game-best +29 plus/minus.
Did Boston win the season series?
Yes. Boston won both meetings, including a 122-90 victory on October 28 and the 144-118 win in the final meeting.
Conclusion
The most useful way to understand the New Orleans Pelicans vs Celtics match player stats is to look beyond the 26-point final margin.
New Orleans had strong individual performances from Jeremiah Fears and Derik Queen. Fears produced 36 points and six assists, while Queen recorded a 25-point, 11-rebound double-double. The Pelicans also finished with the same number of rebounds and turnovers as Boston.
But Boston controlled the areas that mattered most.
The Celtics shot 54% from the field, made 29 three-pointers, produced 35 assists and received meaningful scoring contributions from several players. Sam Hauser’s eight threes, Jaylen Brown’s 23 points, and Payton Pritchard’s 21 points and 10 assists collectively illustrated an offense that was difficult to contain.
The first quarter ultimately created the game’s defining separation. Boston scored 44 points to New Orleans’ 25, then maintained enough control to protect the lead. New Orleans responded after halftime and won the fourth quarter, but the early deficit was too large to overcome.
The game also carried significant postseason meaning for Boston. The victory secured the Celtics the No. 2 seed in the Eastern Conference, turning an already impressive offensive performance into an important late-season result.
From an analytical perspective, the biggest lesson is simple: the teams were tied in rebounds and turnovers, yet Boston won comfortably because its shooting and passing were on another level. That combination, rather than any single box-score category, explains why the Celtics reached 144 points and completed a 2-0 season sweep of New Orleans. (NBA)