49ers vs Colts Match Player Stats
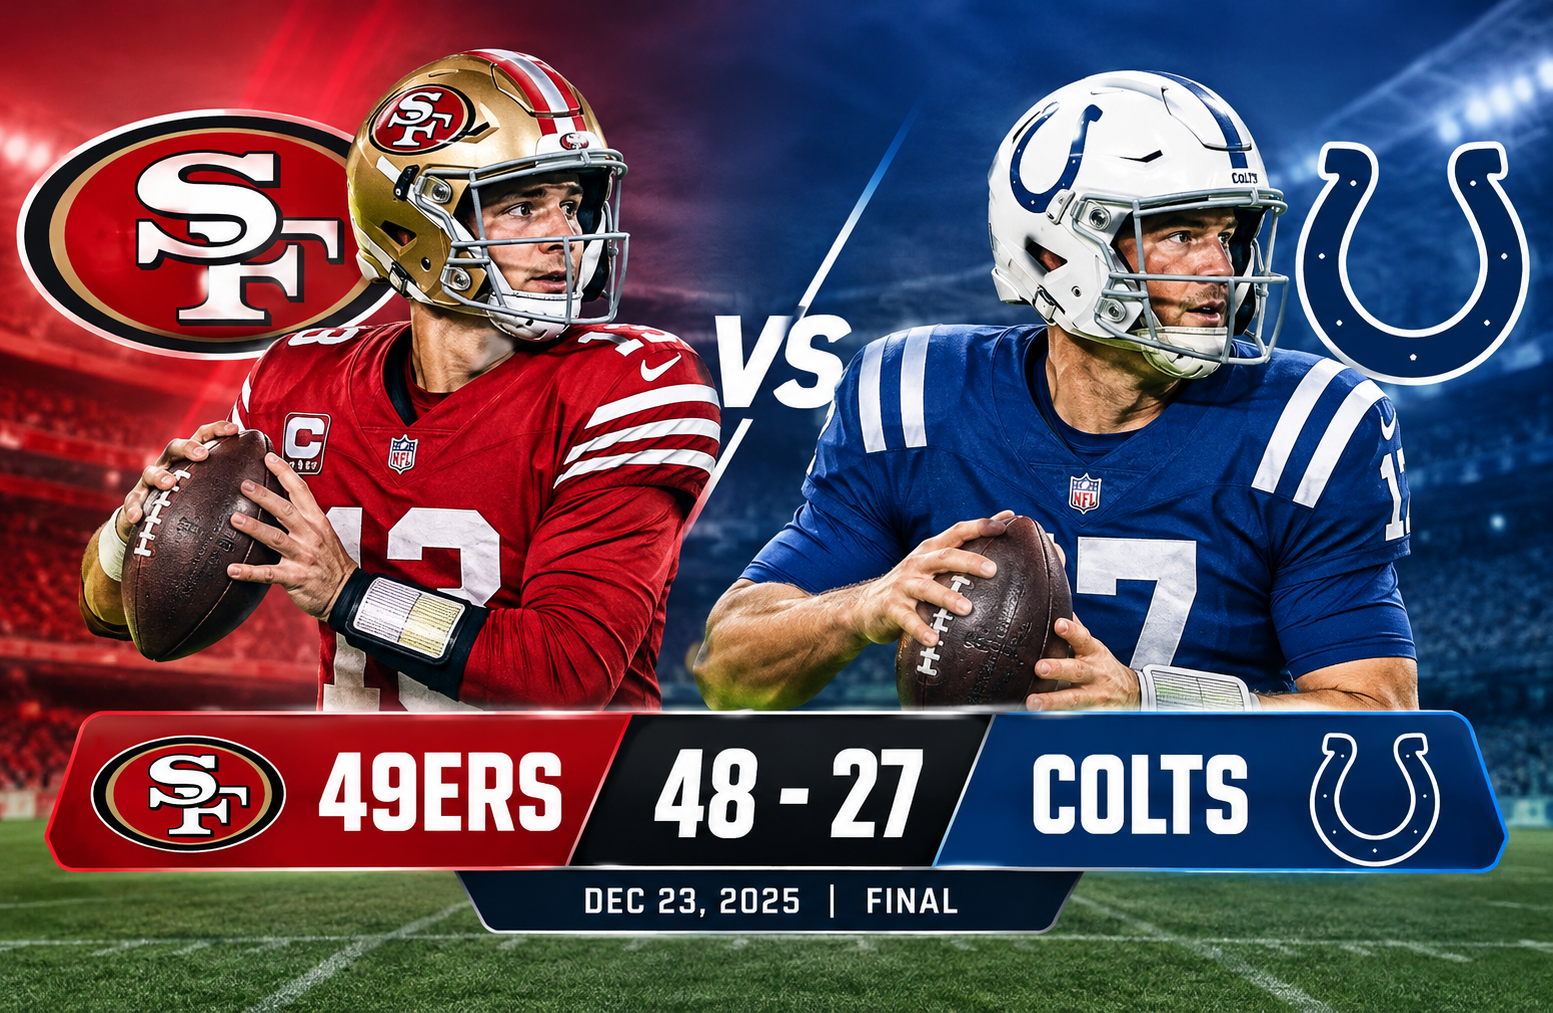
The 49ers vs colts match player stats from December 23, 2025, highlight a dominant offensive performance by the San Francisco 49ers, who defeated the Indianapolis Colts 48-27. San Francisco combined efficient quarterback play, a productive rushing attack, and multiple scoring contributions to secure the victory. Brock Purdy led the passing game with 295 yards and five touchdown passes, while Christian McCaffrey added 117 rushing yards and two receiving touchdowns. For Indianapolis, Philip Rivers passed for 277 yards and two touchdowns, and Alec Pierce caught four passes for 86 yards and two scores. Although the Colts generated several effective passing plays, their limited rushing production and San Francisco’s ability to turn key defensive opportunities into points shaped the final result.
This game offers a useful example of how individual performances contribute to a team’s overall success. Passing efficiency, red-zone execution, rushing consistency, defensive takeaways, and explosive receptions all help explain why a game can become one-sided even when both quarterbacks produce respectable passing totals. By examining the individual numbers alongside the team statistics, readers can better understand which players made the biggest contributions and where the Colts struggled to keep pace.
Game Overview: San Francisco 49ers vs Indianapolis Colts
The matchup took place on December 23, 2025, and finished with San Francisco ahead by 21 points. The 49ers scored in every quarter, while Indianapolis also found the scoreboard throughout the game but could not match the visitors’ scoring rate.
Final Score and Quarter-by-Quarter Breakdown
| Quarter | San Francisco 49ers | Indianapolis Colts |
| First quarter | 14 | 7 |
| Second quarter | 10 | 10 |
| Third quarter | 10 | 3 |
| Fourth quarter | 14 | 7 |
| Final score | 48 | 27 |
San Francisco established an early advantage with 14 points in the opening quarter. Indianapolis matched the 49ers’ 10-point second-quarter output, keeping the contest competitive through halftime. The difference became more pronounced in the third quarter, when San Francisco scored 10 points while limiting the Colts to a field goal.
The 49ers then added another 14 points in the fourth quarter. Indianapolis scored seven, but the late response was insufficient to overcome the accumulated deficit.
The quarter-by-quarter scoring reveals an important distinction: Indianapolis was not shut out for long stretches, but the team could not consistently produce enough points to challenge San Francisco’s pace. The 49ers’ ability to score in all four quarters made their advantage more difficult to erase.
Team Records Entering the Recorded Result
The supplied game data lists San Francisco at 11-4 overall, including a 7-2 away record, while Indianapolis was listed at 8-7 overall with a 6-2 home record.
Those figures provide context for the result. San Francisco’s road record indicated that the team had performed effectively away from home, while Indianapolis had also been competitive on its home field. The 48-27 result therefore stands out for the size of the winning margin, not merely because the 49ers won.
For historical accuracy, these records should be understood as the figures supplied with the game data rather than independently verified standings.
49ers vs Colts Match Player Stats: Key Performers
The most revealing individual numbers belong to Brock Purdy, Christian McCaffrey, George Kittle, Philip Rivers, Alec Pierce, and Jonathan Taylor. Each contributed in a different way, but their combined performances show how San Francisco created more scoring opportunities and converted them into a substantial lead.
San Francisco 49ers Player Statistics
| Player | Passing | Rushing | Receiving | Touchdowns |
| Brock Purdy | 25/34, 295 yards | 2 carries, 11 yards | Not listed as a receiver | 5 passing |
| Christian McCaffrey | Not applicable | 21 carries, 117 yards | 6 catches, 29 yards | 2 receiving |
| George Kittle | Not applicable | Not listed | 7 catches, 115 yards | 1 receiving |
| Jauan Jennings | Not applicable | Not listed | 5 catches, 71 yards | 1 receiving |
| Demarcus Robinson | Not applicable | Not listed | 2 catches, 23 yards | 1 receiving |
| Brian Robinson Jr. | Not applicable | 5 carries, 20 yards | 0 catches | 0 |
| Skyy Moore | Not applicable | Not listed | 1 catch, 23 yards | 0 |
Purdy’s five touchdown passes led the game and provided the central statistical storyline. McCaffrey contributed as both a runner and a receiver, while Kittle supplied the largest receiving-yardage total among the 49ers’ listed players.
Jennings and Robinson also found the end zone, demonstrating that San Francisco did not depend on a single receiver to finish scoring drives.
The table distinguishes passing touchdowns from receiving touchdowns. Purdy’s five touchdown passes are quarterback statistics, while the individual receiving touchdowns identify the players who caught scoring passes. These categories should not be added together as if they were separate team touchdowns, because they describe different sides of the same scoring plays.
Indianapolis Colts Player Statistics
| Player | Passing | Rushing | Receiving | Touchdowns |
| Philip Rivers | 23/35, 277 yards | Not listed | Not applicable | 2 passing |
| Riley Leonard | 0/1, 0 yards | Not listed | Not applicable | 0 |
| Jonathan Taylor | Not applicable | 16 carries, 46 yards | 3 catches, 33 yards | 1 rushing |
| Alec Pierce | Not applicable | Not listed | 4 catches, 86 yards | 2 receiving |
| Josh Downs | Not applicable | 1 carry, 3 yards | 5 catches, 65 yards | 0 |
| Michael Pittman Jr. | Not applicable | Not listed | 4 catches, 32 yards | 0 |
| Tyler Warren | Not applicable | Not listed | 3 catches, 30 yards | 0 |
Rivers produced 277 passing yards and two touchdown passes, while Pierce delivered the Colts’ most productive receiving performance by yardage and receiving touchdowns. Taylor contributed a rushing score, but his 46 yards on 16 attempts reflected a much less productive ground attack than McCaffrey’s.
The Colts’ individual passing and receiving figures show that the offense could move the ball through the air. The more difficult task was converting that production into enough points to match San Francisco.
Statistical note: The supplied data contains an inconsistency in Indianapolis’ passing totals. Rivers is listed with 277 passing yards, and the team receiving total is also 277 yards, while the team passing summary separately lists 254 passing yards. The individual player figures are reproduced as supplied, but the discrepancy should be checked against the official box score before publication as a definitive record.
Brock Purdy’s Five-Touchdown Performance
Brock Purdy delivered the most influential individual performance of the game. His passing line was 25 completions on 34 attempts for 295 yards, with five touchdowns and one interception. He averaged 8.7 yards per attempt, recorded an 88.6 QBR, and finished with a passer rating of 126.8.
Breaking Down Purdy’s Passing Numbers
| Statistic | Result |
| Completions | 25 |
| Attempts | 34 |
| Completion percentage | 73.5% |
| Passing yards | 295 |
| Yards per attempt | 8.7 |
| Passing touchdowns | 5 |
| Interceptions | 1 |
| Sacks taken | 1 |
| Passer rating | 126.8 |
| QBR | 88.6 |
Purdy completed approximately 73.5% of his passes, giving San Francisco a reliable foundation for sustained drives. His 8.7 yards per attempt also indicate that the offense was gaining meaningful yardage through the air rather than relying entirely on short completions.
The five touchdown passes are especially important because touchdowns measure the ability to finish possessions. Passing yards can accumulate between the 20-yard lines without necessarily producing points. Purdy’s scoring total shows that his production extended beyond moving the offense into favorable field position.
His one interception is a reminder that the performance was not flawless. Even so, the overall combination of completion rate, yardage, touchdown production, and passer rating was highly productive.
Why Five Touchdown Passes Matter
A quarterback’s performance should be assessed through several connected measures rather than one headline statistic.
- Completion percentage: Purdy completed most of his attempts, limiting the number of unsuccessful passing plays.
- Yards per attempt: His 8.7 average reflected strong gains across his passing volume.
- Touchdown production: Five scoring passes helped San Francisco maintain pressure on Indianapolis throughout the game.
- Turnover management: One interception created a negative play, but it did not erase the broader value of his performance.
- Passing efficiency: The 126.8 passer rating reflected a highly productive statistical outing.
These measures are most useful when considered together. A quarterback can post a large yardage total without producing many touchdowns, or throw several touchdowns while also making costly mistakes. Purdy combined high scoring output with strong completion efficiency.
The available figures establish the scale of his performance, although they do not provide enough detail to assign every touchdown to a specific defensive coverage, route combination, or play design.
How Purdy’s Performance Helped San Francisco
San Francisco’s offense scored 48 points, and Purdy’s five touchdown passes were central to that total. The passing game also benefited from contributions across several targets, including Kittle, Jennings, McCaffrey, and Robinson.
That distribution matters because a defense has more players to account for when multiple receiving options can produce meaningful gains. Kittle’s 115 yards forced Indianapolis to contend with a productive tight end, while Jennings added 71 yards and a touchdown. McCaffrey’s receiving scores gave San Francisco another way to exploit defensive attention.
The result was a passing attack that combined individual production with a broader range of scoring options.
Christian McCaffrey’s Dual-Threat Contribution
Christian McCaffrey provided San Francisco with balance. He recorded 21 rushing attempts for 117 yards, averaging 5.6 yards per carry, and added six receptions for 29 yards and two receiving touchdowns.
McCaffrey’s Rushing Statistics
| Statistic | Result |
| Rushing attempts | 21 |
| Rushing yards | 117 |
| Yards per carry | 5.6 |
| Rushing touchdowns | 0 |
| Longest run | 24 yards |
| Receiving receptions | 6 |
| Receiving yards | 29 |
| Receiving touchdowns | 2 |
McCaffrey averaged more than five yards on each rushing attempt. His longest run reached 24 yards, providing evidence of his ability to generate substantial gains on the ground.
Although he did not record a rushing touchdown in the supplied statistics, his two receiving touchdowns made him one of the game’s most important scoring contributors. His impact therefore cannot be understood by looking only at the rushing column.
Why McCaffrey’s Role Was Important
A running back who can contribute as both a runner and a receiver gives an offense additional flexibility. When the defense concentrates on stopping inside runs, passes to the back can provide an alternative. When defenders focus on covering receivers, the offense can use the running game to maintain balance.
McCaffrey’s 117 rushing yards helped San Francisco gain 145 rushing yards as a team. His six receptions added another option in the passing game, even though those catches produced 29 yards.
The distinction between volume and scoring value is important here. McCaffrey led the 49ers in rushing yardage, but his two receiving touchdowns were his clearest direct contribution to the scoreboard.
Comparing McCaffrey and Jonathan Taylor
The contrast between the two featured running backs was one of the most informative parts of the statistical matchup.
| Statistic | Christian McCaffrey | Jonathan Taylor |
| Rushing attempts | 21 | 16 |
| Rushing yards | 117 | 46 |
| Yards per carry | 5.6 | 2.9 |
| Longest run | 24 yards | 7 yards |
| Rushing touchdowns | 0 | 1 |
| Receptions | 6 | 3 |
| Receiving yards | 29 | 33 |
| Receiving touchdowns | 2 | 0 |
Taylor scored a rushing touchdown, but McCaffrey gained substantially more ground yardage. The difference in yards per carry was 2.7 yards, a meaningful gap across 21 attempts for McCaffrey and 16 for Taylor.
Taylor actually recorded four more receiving yards than McCaffrey, showing that his contribution through the air was not negligible. The larger difference came from rushing efficiency and McCaffrey’s ability to score through receptions.
This comparison does not mean that running backs alone determine the outcome of a game. Blocking, defensive fronts, down-and-distance situations, and game state all affect rushing production. However, the recorded numbers show that San Francisco extracted considerably more rushing yardage from its lead back.
George Kittle Leads the 49ers in Receiving
George Kittle recorded seven receptions for 115 yards and one touchdown on eight targets. His average was 16.4 yards per reception, and his longest catch covered 26 yards.
Kittle’s performance combined reliability with substantial gains. Catching seven of eight targets produced an 87.5% reception rate, while his yardage average showed that the catches were not limited to short gains.
Kittle’s Receiving Breakdown
| Statistic | Result |
| Targets | 8 |
| Receptions | 7 |
| Receiving yards | 115 |
| Yards per reception | 16.4 |
| Receiving touchdowns | 1 |
| Longest reception | 26 yards |
| Catch rate | 87.5% |
Kittle led the 49ers in receiving yards among the players listed in the supplied data. His 115 yards represented a significant portion of Purdy’s 295 passing yards.
The tight end position can create matchup challenges because the player may be asked to block on some plays and become a receiving option on others. Kittle’s production illustrates the receiving side of that role, although the box score alone cannot establish how many snaps he spent blocking or which coverages he faced.
Jauan Jennings and the Supporting Receivers
Jennings caught five passes for 71 yards and one touchdown on six targets. His 14.2 yards per reception indicate that his catches generated useful yardage, and his touchdown added another scoring option beyond Kittle.
Demarcus Robinson caught two passes for 23 yards and one touchdown. Skyy Moore recorded one reception for 23 yards, while Kendrick Bourne contributed three catches for 27 yards.
These contributions matter because offensive production becomes harder to defend when it is spread across multiple players. A defense cannot focus exclusively on the leading receiver if other targets are also capable of producing touchdowns.
San Francisco’s listed receiving statistics show a productive combination of volume, efficiency, and scoring distribution. Kittle led in yardage, Jennings provided another reliable option, and McCaffrey’s receiving touchdowns expanded the offense’s scoring range.
Philip Rivers’ Performance for the Indianapolis Colts
Philip Rivers finished the game with 23 completions on 35 attempts for 277 passing yards, two touchdown passes, and one interception according to his individual statistics in the supplied data. He averaged 7.9 yards per attempt, took two sacks for a combined loss of 23 yards, and recorded a passer rating of 97.0 with a QBR of 52.2.
The Rivers produced a respectable passing total, but the final score demonstrates the difference between gaining yardage and keeping pace with a highly productive opponent.
Rivers’ Passing Statistics
</tbody>
</tbody>
| Statistic | Result |
| Completions | 23 |
| Pass attempts | 35 |
| Completion percentage | 65.7% |
| Passing yards | 277 |
| Yards per attempt | 7.9 |
| Passing touchdowns | 2 |
| Interceptions | 1 |
| Sacks taken | 2 |
| Sack yardage lost | 23 |
| Passer rating | 97.0 |
| QBR | le=”font-weight: 400;”>52.2 |
Rivers completed approximately 65.7% of his passes. His 7.9 yards per attempt showed that Indianapolis could generate meaningful gains through the air, but San Francisco’s higher passing efficiency and five touchdown passes created a significant difference in offensive output.
The two sacks also deserve attention. Sacks can end promising possessions, create unfavorable down-and-distance situations, and push an offense out of field-goal range. Although two sacks alone do not explain the loss, they represent opportunities for the 49ers’ defense to disrupt Indianapolis.
Rivers also threw an interception. Turnovers can change field position and provide the opposing offense with additional opportunities, particularly when the other team is converting its possessions into touchdowns.
Evaluating Rivers Beyond Passing Yards
Passing yardage is useful, but it is not a complete measure of quarterback performance. An effective evaluation considers:
- Completion percentage and yards per attempt.
- Touchdown passes and interceptions.
- Sacks and lost yardage.
- Performance on third downs and in the red zone, when those figures are available.
- Whether the offense can sustain drives and produce points.
The supplied figures support a clear conclusion: Rivers moved the ball through the air, but Indianapolis did not produce enough overall offense to match San Francisco’s scoring pace.
The available data does not provide a complete breakdown of Rivers’ third-down conversions or red-zone efficiency. Those measures should not be guessed or presented as established facts.
Alec Pierce’s Two-Touchdown Receiving Performance
Alec Pierce was Indianapolis’ leading receiver by yardage and receiving touchdowns. He caught four passes for 86 yards and two touchdowns on four targets, averaging 21.5 yards per reception.
His numbers show why a receiver’s impact should not be judged by reception count alone. Pierce caught only four passes, but each reception averaged more than 21 yards. His two touchdowns also made him the Colts’ most productive scoring receiver in the supplied statistics.
Pierce’s Receiving Statistics
| Statistic | Result |
| Targets | 4 |
| Receptions | 4 |
| Receiving yards | 86 |
| Yards per reception | 21.5 |
| Receiving touchdowns | 2 |
| Longest reception | 33 yards |
| Catch rate | 100% |
Pierce caught every pass listed as a target. His longest reception covered 33 yards, giving Indianapolis a significant source of explosive passing production.
His performance also illustrates the difference between individual success and team success. Pierce produced two touchdowns, yet the Colts still lost by 21 points. A receiver can perform exceptionally well while the overall offense struggles to maintain the same level of production across all possessions.
Josh Downs and the Other Indianapolis Receivers
Josh Downs caught five passes for 65 yards on nine targets. His 13.0 yards per reception made him another useful option for Rivers, although his lower catch rate compared with Pierce indicates that more of his targets did not become receptions.
Michael Pittman Jr. recorded four receptions for 32 yards on five targets. Jonathan Taylor added three catches for 33 yards, while Tyler Warren caught three passes for 30 yards.
These players contributed different forms of production. Downs offered a combination of reception volume and yardage, Pittman supplied additional completions, and Taylor provided an option out of the backfield.
The numbers suggest that Indianapolis had several players capable of contributing through the air. The main challenge was converting that production into a total that could compete with San Francisco’s five passing touchdowns and 48 points.
Team Statistics: Where the 49ers Gained Their Advantage
Individual performances explain part of the result, but team statistics help identify the broader differences between the two offenses.
| Team statistic | San Francisco 49ers | Indianapolis Colts |
| Final points | 48 | 27 |
| Team rushing attempts | 31 | 20 |
| Team rushing yards | 145 | 58 |
| Yards per rushing attempt | 4.7 | 2.9 |
| Rushing touchdowns | 0 | 1 |
| Listed passing leader’s yards | 295 | 277 |
| Listed passing leader’s touchdowns | 5 | 2 |
| Listed receiving leader’s yards | 115 | 86 |
| Listed receiving leader’s touchdowns | 1 | 2 |
| Team fumbles | 1 | 2 |
| Fumbles lost | 0 | 1 |
The table uses the individual passing leader totals where the supplied team passing figures conflict with the individual statistics. It should therefore not be treated as a fully reconciled official team box score.
The Rushing Difference
San Francisco recorded 145 rushing yards on 31 attempts, averaging 4.7 yards per carry. Indianapolis managed 58 rushing yards on 20 attempts, averaging 2.9 yards per carry.
That difference of 87 rushing yards was one of the clearest statistical gaps in the game.
A productive rushing attack can help an offense in several ways. It can produce first downs, reduce the pressure on the quarterback, and give play-callers more flexibility. It can also help an offense remain balanced rather than relying entirely on passing plays.
San Francisco gained more yards per rushing attempt and recorded 11 more rushing attempts than Indianapolis. The 49ers did not score a rushing touchdown in the supplied statistics, but their ground production helped complement Purdy’s passing performance.
Indianapolis, by comparison, averaged fewer than three yards per rushing attempt. Taylor’s rushing touchdown was valuable, but his 46 yards on 16 carries did not provide the same overall yardage contribution as McCaffrey’s performance.
Passing Production and Scoring Efficiency
The individual quarterback figures show 295 passing yards for Purdy and 277 for Rivers. The difference in passing yardage was only 18 yards, yet the difference in passing touchdowns was three.
That contrast is central to understanding the final score.
Purdy threw five touchdown passes, while Rivers threw two. San Francisco also benefited from McCaffrey’s receiving touchdowns and contributions from Kittle, Jennings, and Robinson.
A passing offense can produce a respectable yardage total without matching another team’s scoring efficiency. The location of completions, the ability to finish drives, and the number of possessions ending in touchdowns all influence the scoreboard.
The supplied figures strongly suggest that San Francisco converted its passing production into points more effectively. However, a precise red-zone comparison would require verified red-zone attempts, touchdowns, and field-goal data.
Ball Security and Turnovers
The supplied fumble statistics list one San Francisco fumble with none lost, compared with two Indianapolis fumbles and one lost. Both teams are also listed with one interception recorded by their respective defenses.
San Francisco’s Dee Winters is credited with an interception returned for 74 yards and a touchdown. Indianapolis’ Cam Bynum is credited with an interception return of eight yards without a touchdown.
These events are important because turnovers can influence both possession and field position. A defensive interception returned for a touchdown provides points without requiring the offense to complete a scoring drive. It also prevents the opposing offense from continuing its possession.
The supplied data records the interception return touchdown for Winters. Because the play-by-play details are not included in the provided figures, it is best not to infer the exact sequence of events or attach the defensive score to a specific quarter without checking the detailed record.
Defensive Player Statistics and Game-Changing Plays
The 49ers’ offensive production was the main reason for their 48-point total, but defensive contributions also deserve attention. Tackles, sacks, interceptions, and pass breakups can influence the number and quality of opposing possessions.
San Francisco Defensive Leaders
| Player | Total tackles | Solo tackles | Sacks | Tackles for loss | Passes defended |
| Ji’Ayir Brown | 9 | 5 | 0 | 1 | 0 |
| Tatum Bethune | 9 | 4 | 0 | 0 | 1 |
| Malik Mustapha | 8 | 3 | 0 | 0 | 0 |
| Darrell Luter Jr. | 6 | 5 | 0 | 0 | 1 |
| Upton Stout | 6 | 3 | 0 | 0 | 2 |
| Dee Winters | 3 | 1 | 0 | 0 | 2 |
Ji’Ayir Brown and Tatum Bethune led the listed San Francisco defenders with nine total tackles each. Brown also recorded a tackle for loss, while Bethune added a pass defended.
Upton Stout recorded two passes defended, giving him the highest total in that category among the listed 49ers defenders. Dee Winters also recorded two passes defended and is credited with the interception return touchdown.
Tackles measure involvement in stopping offensive plays, but totals alone do not reveal the complete quality of a defender’s performance. A tackle after a short gain differs from a tackle that prevents a first down, and coverage statistics do not necessarily capture every contribution a defender makes.
Winters’ recorded defensive touchdown is particularly notable because it directly affected the scoreboard. His listed interception return of 74 yards indicates the scale of the play, while the touchdown shows that the turnover produced points rather than merely changing possession.
Indianapolis Defensive Leaders
| Player | Total tackles | Solo tackles | Sacks | Tackles for loss | Passes defended |
| Cam Bynum | 7 | 5 | 0 | 0 | 1 |
| Germaine Pratt | 6 | 4 | 0 | 0 | 1 |
| Nick Cross | 6 | 3 | 0 | 0 | 0 |
| DeForest Buckner | 5 | 4 | 0 | 0 | 0 |
| Laiatu Latu | 3 | 3 | 1 | 1 | 0 |
Cam Bynum led the listed Colts defenders with seven tackles and also recorded an interception. Germaine Pratt added six tackles and a pass defended, while Nick Cross recorded six tackles.
Laiatu Latu produced the Colts’ listed sack, finishing with three tackles, one sack, one tackle for loss, and one quarterback hit. His pressure contributed to a defensive effort that did generate some disruption, even though Indianapolis struggled to contain San Francisco’s scoring output.
The listed Colts defense recorded one sack compared with two for San Francisco. Sacks are only one part of defensive evaluation, but they can interrupt passing plays and force offenses into longer down-and-distance situations.
What the Defensive Numbers Reveal
The defensive statistics show that both teams had players involved in tackles and turnover production. The most consequential listed defensive play, however, was Winters’ interception return for a touchdown.
San Francisco also recorded more sacks and a greater number of team passes defended in the supplied data. Those figures point to a defense that created some additional disruption.
The numbers do not establish that every defensive advantage came from one particular coverage or formation. That level of analysis requires film or detailed play-by-play evidence. The defensible conclusion is that San Francisco combined offensive scoring with at least one major defensive scoring play, making Indianapolis’ task more difficult.
Special Teams Statistics
Special teams can influence field position, scoring opportunities, and the pressure placed on an offense. The supplied statistics show productive kick returns for both teams, different field-goal outcomes, and a notable absence of punts by San Francisco.
Kicking Comparison
| Statistic | Eddy Piñeiro, 49ers | Blake Grupe, Colts |
| Field goals made | 2 | 2 |
| Field goals attempted | 3 | 2 |
| Field-goal percentage | 66.7% | 100% |
| Longest field goal | 38 yards | 51 yards |
| Extra points made | 6 | 3 |
| Extra points attempted | 6 | 3 |
| Total kicking points | 12 | 9 |
Piñeiro scored 12 points through two field goals and six successful extra points. Grupe made both field-goal attempts, including a long kick of 51 yards, and converted all three extra points.
Grupe had the higher field-goal percentage, but Piñeiro recorded more total kicking points because San Francisco scored more touchdowns and attempted more extra points.
The difference illustrates why kicker statistics should be considered in context. A kicker’s total points depend partly on the scoring opportunities created by the offense. A perfect field-goal percentage is valuable, but it cannot independently compensate for a substantial difference in touchdown production.
Kick Returns and Punting
San Francisco recorded six kick returns for 167 yards, averaging 27.8 yards per return. Skyy Moore led the 49ers with four returns for 112 yards, while Brian Robinson Jr. added two returns for 55 yards.
Indianapolis also recorded six kick returns, totaling 166 yards at an average of 27.7 yards per return. Coleman Owen led the Colts with 89 yards on three returns.
The return numbers were almost identical in total yardage. That makes kick returns a less obvious explanation for the 21-point margin than the differences in passing touchdowns and rushing production.
San Francisco also recorded one punt return for eight yards. The supplied data lists no San Francisco punts, while Indianapolis punter Rigoberto Sanchez recorded two punts for 101 yards, averaging 50.5 yards per punt.
The absence of a San Francisco punt is consistent with an offense that repeatedly sustained productive possessions, although the complete drive-by-drive record would be needed to determine precisely how each possession ended.
Key Factors Behind the 48-27 Result
The statistical record identifies several factors that help explain San Francisco’s victory. No single figure tells the whole story, but the combined evidence shows a substantial difference in offensive execution.
1. Purdy Produced More Passing Touchdowns
Purdy threw five touchdown passes compared with Rivers’ two. That three-touchdown difference was a major distinction between the quarterbacks’ performances.
Both players exceeded 275 passing yards according to their individual statistics, but Purdy generated substantially more scoring production. His 73.5% completion rate and 8.7 yards per attempt also reflected an efficient passing performance.
2. San Francisco Had the More Productive Rushing Attack
The 49ers rushed for 145 yards, while the Colts managed 58. McCaffrey averaged 5.6 yards per carry, compared with Taylor’s 2.9.
San Francisco’s advantage on the ground helped balance its passing attack. Indianapolis did record a rushing touchdown, but the overall rushing totals favored the 49ers by 87 yards.
3. The 49ers Had Multiple Receiving Threats
Kittle produced 115 receiving yards, Jennings added 71, and McCaffrey scored twice as a receiver. Robinson also recorded a receiving touchdown.
For Indianapolis, Pierce led with 86 receiving yards and two touchdowns. Downs contributed 65 yards, while several other players added smaller totals.
The Colts had effective individual receiving performances, but San Francisco’s combination of passing volume, yardage, and scoring contributions supported a higher overall offensive output.
4. Defensive Scoring Added Another Dimension
The supplied data credits Dee Winters with an interception returned 74 yards for a touchdown. Such a play adds points directly and removes an offensive possession from the opposing team.
Indianapolis also recorded an interception through Bynum, but the listed return did not produce a touchdown. The distinction illustrates how the result of a turnover can matter as much as the turnover itself.
5. San Francisco Maintained Its Scoring Across Four Quarters
The 49ers scored 14, 10, 10, and 14 points across the four quarters. Indianapolis scored 7, 10, 3, and 7.
San Francisco’s third-quarter advantage was particularly useful because the Colts scored only three points during that period. The 49ers then added 14 points in the fourth quarter, preserving and extending their lead.
The quarter-by-quarter figures show that the result was not built entirely on a single opening burst. San Francisco continued scoring throughout the game.
How to Interpret NFL Player Statistics Correctly
Readers researching individual performances often focus on the largest numbers first. A more reliable approach is to compare statistics across several categories and understand what each measure actually represents.
Start With the Box Score
A box score provides a compact record of player and team production. For this matchup, the most useful categories include:
- Passing attempts, completions, yards, touchdowns, and interceptions.
- Rushing attempts, yards, and touchdowns.
- Receiving targets, receptions, yards, and touchdowns.
- Tackles, sacks, passes defended, and interceptions.
- Field goals, extra points, and return yardage.
The ESPN game box score is the relevant reference for checking the recorded figures.
Distinguish Player Totals From Team Totals
A quarterback’s passing yards and a team’s passing yards are related, but the two should not be treated as interchangeable without checking the statistical definitions and the complete record.
That distinction matters in this dataset because Rivers is listed with 277 passing yards individually, while Indianapolis’ team passing summary separately lists 254 yards. The individual receiving total also lists 277 yards.
These figures cannot all be assumed to represent the same statistical measure. Before publication, the discrepancy should be checked against the official box score rather than resolved by guessing which number is correct.
Separate Passing Touchdowns From Receiving Touchdowns
A passing touchdown is credited to the quarterback who throws the scoring pass. A receiving touchdown is credited to the player who catches it.
For example, Purdy’s five passing touchdowns and McCaffrey’s two receiving touchdowns can describe overlapping scoring plays. Adding those numbers together would count some of the same touchdowns twice.
This distinction is important when comparing quarterbacks and receivers, especially in games where a small number of players account for many scoring plays.
Use Efficiency Measures Alongside Volume
Volume statistics show how much a player participated. Efficiency statistics help explain how productive that participation was.
Consider the two lead running backs:
- McCaffrey gained 117 yards on 21 carries, averaging 5.6 yards per carry.
- Taylor gained 46 yards on 16 carries, averaging 2.9 yards per carry.
The attempt totals provide context, while yards per carry make the difference in rushing production easier to compare.
The same principle applies to receivers. Pierce averaged 21.5 yards per reception, while Kittle averaged 16.4. Both produced meaningful gains, but Pierce’s average was higher.
Efficiency statistics also have limitations. Averages can be affected by one long play, the quality of defensive opposition, and the situations in which a player receives the ball. They are most informative when combined with total volume and scoring production.
Data Accuracy and Historical Context
A detailed statistical article should distinguish confirmed figures from information that still requires verification. This is especially important when a dataset contains conflicting totals or when readers may use the article as a historical reference.
The supplied game information identifies December 23, 2025, as the game date and records a final score of 48-27. It also lists team records, individual player statistics, and defensive and special-teams figures.
Several points deserve particular care before the article is treated as a definitive historical record.
First, the individual passing and team passing totals for Indianapolis do not agree. Rivers’ individual line lists 277 yards, while the team passing summary lists 254 yards. Those figures should be verified.
Second, the supplied data includes a sidebar that labels the NFL schedule as Week 6, alongside unrelated team records and fixtures. That sidebar information should not be used to infer the actual week of the December game.
Third, the supplied player statistics should not be supplemented with invented drive summaries, exact scoring-play descriptions, quotations, or claims about coaching decisions. Those details require separate evidence.
A responsible statistical analysis can still explain the major patterns without filling gaps with speculation. The strongest conclusions in this article are grounded in the supplied scoring summary and player statistics: San Francisco scored 48 points, Purdy threw five touchdown passes, McCaffrey gained 117 rushing yards, and Indianapolis recorded substantially less rushing yardage.
Frequently Asked Questions
1. What was the final score of the 49ers vs Colts game?
The San Francisco 49ers defeated the Indianapolis Colts 48-27 on December 23, 2025, according to the supplied game data.
2. How many passing yards did Brock Purdy record?
Brock Purdy completed 25 of 34 passes for 295 yards, threw five touchdown passes, and recorded one interception. His passer rating was 126.8.
3. How many touchdowns did Philip Rivers throw?
Philip Rivers threw two touchdown passes and recorded one interception. His individual statistics list 277 passing yards on 23 completions from 35 attempts.
4. Who led the game in rushing yards?
Christian McCaffrey led the listed players with 117 rushing yards on 21 carries, averaging 5.6 yards per attempt. Jonathan Taylor led Indianapolis with 46 rushing yards on 16 carries.
5. Who was the leading receiver for the 49ers?
George Kittle led San Francisco’s listed receivers with seven catches for 115 yards and one touchdown on eight targets.
6. Which Colts receiver recorded the most receiving yards?
Alec Pierce led Indianapolis with 86 receiving yards on four catches. He also recorded two receiving touchdowns and averaged 21.5 yards per reception.
Conclusion
The 49ers vs Colts match player stats show how San Francisco combined efficient passing, productive rushing, and contributions from multiple scoring threats to secure a 48-27 victory. Brock Purdy’s five touchdown passes were the leading individual achievement, while Christian McCaffrey added 117 rushing yards and two receiving touchdowns. George Kittle led the 49ers in receiving yardage, and Jauan Jennings and Demarcus Robinson also contributed receiving touchdowns.
Indianapolis had several strong individual performances of its own. Philip Rivers passed for 277 yards and two touchdowns in his individual statistical line, while Alec Pierce caught four passes for 86 yards and two scores. Jonathan Taylor contributed a rushing touchdown, but his 46 rushing yards reflected the difficulty Indianapolis experienced in establishing a consistent ground attack.
The most revealing comparison is the difference between the teams’ overall production. San Francisco recorded 145 rushing yards compared with Indianapolis’ 58, and Purdy threw three more touchdown passes than Rivers. The supplied defensive statistics also credit Dee Winters with a 74-yard interception return touchdown, adding another important scoring contribution.
Taken together, the numbers point to a victory built on scoring efficiency, balance between passing and rushing, and contributions from several positions. The result also illustrates why player statistics are most useful when interpreted together rather than judged by passing yards or reception totals alone.