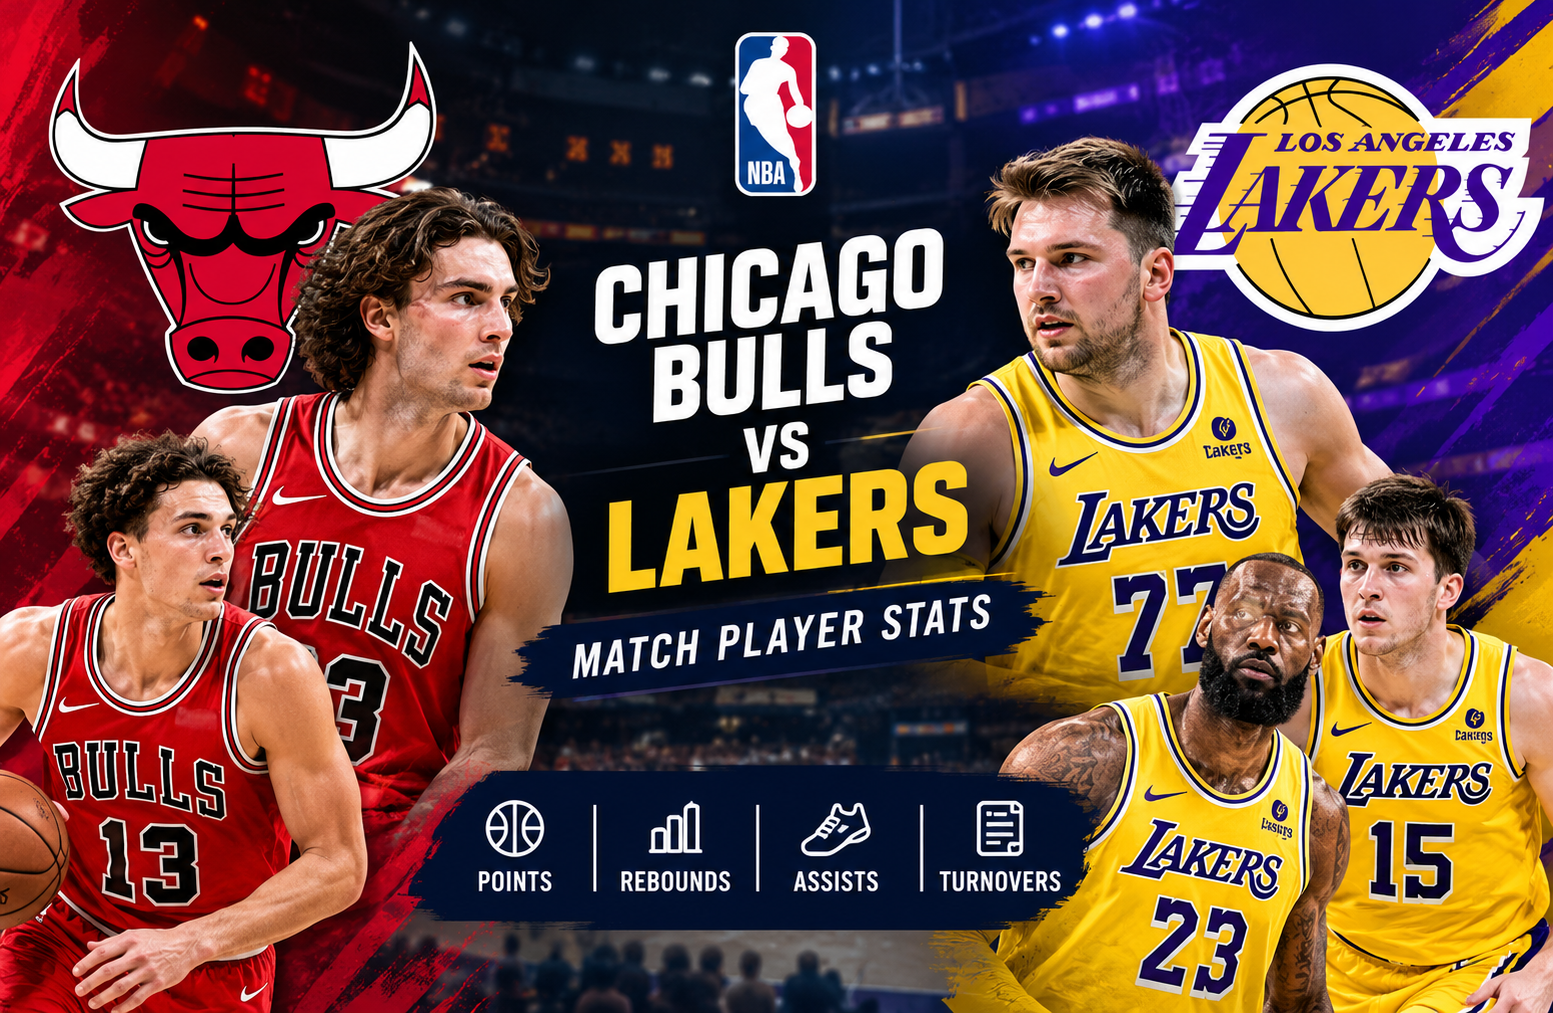
Chicago Bulls vs Lakers Match Player Stats
The chicago bulls vs lakers match player stats from the March 2026 meeting tell a much more detailed story than the final 142-130 score. The Los Angeles Lakers defeated the Chicago Bulls at Crypto.com Arena after both teams scored 26 points in the opening quarter, but Los Angeles separated itself in the second and third quarters. Luka Doncic delivered a spectacular 51-point performance with 10 rebounds and 9 assists, while Austin Reaves added 30 points and Deandre Ayton posted 23 points and 10 rebounds. For Chicago, Josh Giddey led the way with 27 points and 15 assists, while Matas Buzelis contributed 22 points. (NBA.com)
There is a small date detail worth clarifying. The NBA’s official game page lists the contest as Thursday, March 12, 2026 in Los Angeles, while its game information also displays Friday, March 13 at 2:30 AM. This reflects the way game information can appear across local and broadcast time references. The statistics and result are the same: Los Angeles won 142-130. (NBA.com)
This article breaks down the complete player production, shooting efficiency, playmaking, rebounding, turnovers, quarter-by-quarter momentum and the statistical reasons the Lakers controlled the game.
Chicago Bulls vs Lakers Match Player Stats: Game Overview
The game was played at Crypto.com Arena in Los Angeles, California, with an attendance of 18,794. The Lakers entered with a 41-25 record and a 22-12 home record, while the Bulls entered at 27-39 and 11-21 on the road. Los Angeles ultimately won the season series 2-0. (NBA.com)
| Category | Chicago Bulls | Los Angeles Lakers |
| Final Score | 130 | 142 |
| Q1 | 26 | 26 |
| Q2 | 36 | 41 |
| Q3 | 36 | 41 |
| Q4 | 32 | 34 |
| Field Goals | 51-95 | 55-99 |
| Field Goal % | 54% | 56% |
| 3-Point FG | 15-36 | 17-36 |
| 3-Point % | 42% | 47% |
| Free Throws | 13-16 | 15-21 |
| Rebounds | 41 | 41 |
| Assists | 34 | 31 |
| Turnovers | 15 | 9 |
| Steals | 7 | 9 |
| Blocks | 3 | 4 |
The most important numbers are not necessarily the ones that appear first in the box score.
Chicago actually matched Los Angeles on total rebounds and produced more assists. The Bulls also shot 54% from the field and 42% from three, which would normally provide a strong offensive foundation.
The difference was that Los Angeles converted its possessions with slightly greater efficiency while committing six fewer turnovers. The Lakers also produced a huge individual scoring performance from Doncic, who accounted for 51 of their 142 points.
How the Game Changed After the First Quarter
The opening period ended 26-26, giving little indication that the Lakers would eventually win by 12.
The second quarter changed the shape of the contest.
Los Angeles scored 41 points in the second period compared with Chicago’s 36. The Lakers repeated that 41-point output in the third quarter while holding the Bulls to another 36.
That meant Los Angeles created a 10-point advantage across the second and third quarters.
| Quarter | Bulls | Lakers | Lakers Margin |
| First | 26 | 26 | 0 |
| Second | 36 | 41 | +5 |
| Third | 36 | 41 | +5 |
| Fourth | 32 | 34 | +2 |
This is one of the most useful ways to interpret the game.
The Bulls did not collapse offensively. They scored 36 points in both the second and third quarters and finished with 130 points. Instead, the Lakers consistently produced a little more offense during the middle portion of the game.
That distinction matters when evaluating player statistics. A 12-point final margin can sometimes come from one disastrous quarter. Here, the Lakers gradually built the separation across several periods.
Luka Doncic Dominates the Box Score
Luka Doncic was the defining statistical story of the game.
He finished with:
- 51 points
- 10 rebounds
- 9 assists
- 17-of-31 field goals
- 9-of-14 three-pointers
- 8-of-9 free throws
- 3 steals
- 1 block
- 1 turnover
- +15 plus/minus
The official NBA recap described it as Doncic’s first 50-point game as a Laker. The performance also left him one assist short of a triple-double. (NBA.com)
His shooting numbers deserve special attention.
Doncic attempted 31 field goals and made 17, giving him a 54.8% field-goal rate. More importantly, he connected on 9 of 14 three-point attempts, or 64.3%.
That combination is extremely difficult for a defense to absorb.
A player can score 50 points through heavy free-throw volume, high shot volume or a mixture of both. Doncic’s production came with considerable three-point efficiency and only eight free-throw attempts converted.
His 51 points represented more than 35% of Los Angeles’ total scoring.
He was also not simply a scorer.
Nine assists show that Chicago had to account for his playmaking throughout the game. Ten rebounds added another dimension, while three steals and one block showed activity away from his primary offensive responsibilities.
The statistical profile therefore goes beyond the headline number.
Austin Reaves Provides a Second Major Scoring Threat
Austin Reaves finished with 30 points, 5 rebounds and 7 assists.
His shooting line was particularly efficient:
- 13-of-20 from the field
- 4-of-7 from three
- 30 points
- 7 assists
- +18 plus/minus
Reaves’ 65% field-goal shooting gave the Lakers another high-efficiency scoring source next to Doncic.
That matters because Chicago could not focus its defensive attention exclusively on Doncic.
If the Bulls committed too much defensive attention toward Doncic, Reaves had the efficiency to punish the coverage. If they tried to limit Reaves and maintain pressure on Doncic, the Lakers still had their primary creator operating at a high level.
Reaves also tied LeBron James with seven assists, making him more than a secondary scorer.
His +18 was the highest plus/minus among the players listed in the supplied box score. (ESPN)
Deandre Ayton Controls the Interior
Deandre Ayton finished with 23 points and 10 rebounds.
He shot 10-of-13 from the field, an outstanding 76.9% conversion rate.
His numbers were:
- 23 points
- 10 rebounds
- 1 assist
- 10-of-13 FG
- 3-of-6 FT
- 37 minutes
- +9 plus/minus
Ayton’s contribution is easy to overlook when Doncic scores 51, but his efficiency was an important part of the Lakers’ offensive balance.
Chicago had to defend a perimeter creator capable of scoring from deep, a high-volume perimeter scorer in Reaves and an interior finisher converting 10 of 13 shots.
That creates a difficult defensive structure because the defense has to solve several different problems at the same time.
LeBron James Returns With an All-Around Line
LeBron James recorded:
- 18 points
- 7 rebounds
- 7 assists
- 7-of-13 shooting
- 2 steals
- 1 block
The official recap noted that James returned after missing three games. He scored 11 points in the third quarter after a relatively quiet first half. (NBA.com)
The third quarter is especially relevant because it was also one of the periods in which Los Angeles scored 41 points.
James did not need to lead the team in scoring because Doncic and Reaves were already producing at high levels.
Instead, his seven assists, seven rebounds and defensive activity helped provide additional balance.
That is one of the more useful lessons from the Lakers’ player statistics. The team did not require every major contributor to perform the same role.
Doncic was the primary scoring engine.
Reaves supplied efficient scoring and playmaking.
Ayton provided interior scoring and rebounding.
James contributed across several categories.
Rui Hachimura’s Efficient Shooting
Rui Hachimura scored 15 points on 6-of-10 shooting.
He also made 3 of 5 three-point attempts.
That translates to 60% overall shooting and 60% three-point shooting.
Hachimura added one rebound and one assist, and his plus/minus was +16.
His production was not as large as Doncic’s or Reaves’ scoring output, but his efficient perimeter shooting added another layer to the Lakers’ offense.
This is important when studying the chicago bulls vs lakers match player stats because team success cannot be explained only by the highest scorer.
Role-player efficiency can change defensive spacing.
When supporting players convert open perimeter attempts, defenders have fewer opportunities to overload against the primary ball handler.
Chicago Bulls Player Stats Breakdown
Chicago scored 130 points, shot 54% from the field and made 15 of 36 three-point attempts.
The Bulls also recorded 34 assists.
Those numbers show that the Chicago offense was productive.
The challenge was that its 15 turnovers created additional opportunities for Los Angeles.
Here is the main individual production from the Bulls.
| Bulls Player | Points | Rebounds | Assists | FG |
| Josh Giddey | 27 | 8 | 15 | 10-17 |
| Matas Buzelis | 22 | 6 | 1 | 7-19 |
| Tre Jones | 18 | 4 | 6 | 8-16 |
| Leonard Miller | 15 | 9 | 1 | 6-9 |
| Nick Richards | 15 | 4 | 1 | 7-9 |
| Jalen Smith | 14 | 4 | 0 | 5-11 |
| Rob Dillingham | 12 | 5 | 7 | 5-10 |
The standout is obviously Giddey.
Josh Giddey Leads Chicago’s Offense
Josh Giddey produced one of the strongest all-around statistical performances on the Bulls side.
He finished with:
- 27 points
- 8 rebounds
- 15 assists
- 10-of-17 field goals
- 6-of-9 three-pointers
- 2 steals
His 15 assists were the highest total in the game.
Giddey’s 6-of-9 shooting from three was also highly efficient. He converted 66.7% of his three-point attempts.
This is a significant point because Chicago was not simply dependent on difficult isolation scoring.
Giddey was creating offense for teammates while also scoring efficiently himself.
His 15 assists accounted for nearly half of Chicago’s 34 team assists.
The problem was that his six turnovers reduced some of the value created by his playmaking.
That does not erase the quality of his offensive performance. It shows the tradeoff that can occur when one player carries a large share of the creation burden.
Matas Buzelis Shows Scoring Potential
Matas Buzelis finished with 22 points, 6 rebounds, 1 assist, 2 steals and 2 blocks.
He shot 7-of-19 from the field and 4-of-11 from three.
The 22 points placed him second among Chicago scorers.
His four made threes were also important because they helped Chicago remain offensively competitive during the middle quarters.
The official game recap noted that Giddey and Buzelis combined for 10 made three-pointers on 20 attempts. (NBA.com)
That is a 50% combined three-point conversion rate for the pair.
Their perimeter shooting helped Chicago score 130 points despite the loss.
Leonard Miller’s Efficient Interior Production
Leonard Miller provided 15 points and 9 rebounds.
He shot 6-of-9 from the field and made both of his free throws.
His 66.7% field-goal rate was one of Chicago’s better efficiency marks among significant contributors.
Miller also led the Bulls in rebounds with nine.
He therefore contributed in two areas that often matter in close games: efficient scoring and rebounding.
The Lakers ultimately matched Chicago’s 41 total rebounds, so Miller’s individual rebounding effort did not translate into a team rebounding advantage.
Tre Jones and Rob Dillingham Add Playmaking
Tre Jones recorded 18 points, 4 rebounds and 6 assists while shooting 8-of-16.
Rob Dillingham added 12 points, 5 rebounds and 7 assists on 5-of-10 shooting.
Together, they provided Chicago with additional ball-handling and creation.
Dillingham’s seven assists were particularly useful because they came from the bench.
When evaluating bench production, assists can reveal value that raw scoring totals do not fully capture.
Nick Richards Provides Efficient Scoring
Nick Richards scored 15 points on 7-of-9 shooting.
That was 77.8% from the field.
His four rebounds and one assist rounded out his contribution.
Richards was therefore one of Chicago’s most efficient scorers, but his production did not offset the Lakers’ combined output from their main offensive group.
Team Shooting Comparison
The shooting numbers provide one of the clearest explanations for the final result.
Field Goal Shooting
Chicago:
51-of-95, 54%
Los Angeles:
55-of-99, 56%
The difference was only two percentage points.
This tells us that the Lakers did not win simply because Chicago could not make shots.
Both teams were highly productive from the field.
Three-Point Shooting
Chicago:
15-of-36, 42%
Los Angeles:
17-of-36, 47%
Los Angeles made two more threes on the same number of attempts.
That five-percentage-point advantage was meaningful in a game decided by 12 points.
Free Throws
Chicago:
13-of-16, 81%
Los Angeles:
15-of-21, 71%
Chicago actually had the better free-throw percentage.
That reinforces the idea that the Lakers’ victory was not based on dominating every statistical category.
Instead, Los Angeles combined strong shooting with lower turnover volume and exceptional individual scoring.
Turnovers Were a Major Difference
Chicago committed 15 turnovers.
Los Angeles committed only 9.
That six-turnover gap is significant.
In a high-scoring game, every lost possession can matter because both teams were capable of scoring efficiently.
The Lakers also recorded nine steals compared with Chicago’s seven.
The combination of fewer turnovers and more steals gave Los Angeles a cleaner possession profile.
This is one reason a simple comparison of shooting percentages does not fully explain the result.
Chicago’s 54% shooting was excellent.
Yet the Bulls gave away six more possessions through turnovers.
Los Angeles converted enough of its opportunities to build and maintain its lead.
Rebounding Was Even
Both teams finished with 41 rebounds.
That means the Bulls did not lose the game because they were crushed on the glass.
The individual leaders were:
- Lakers: Deandre Ayton and Luka Doncic, 10 rebounds each
- Bulls: Leonard Miller, 9 rebounds
Doncic’s 10 rebounds are particularly notable because his primary role was scoring and playmaking.
A 51-point, 10-rebound, 9-assist line is therefore a complete statistical performance rather than a pure scoring outburst.
Assists Reveal Two Different Offensive Styles
Chicago recorded 34 assists.
Los Angeles recorded 31.
At first glance, that might suggest Chicago moved the ball more effectively.
But assists should be interpreted alongside turnovers and individual creation.
Giddey produced 15 assists by himself.
The Lakers distributed their playmaking across several players:
- Luka Doncic: 9 assists
- LeBron James: 7 assists
- Austin Reaves: 7 assists
- Jake LaRavia: 3 assists
- Luke Kennard: 2 assists
The Lakers therefore had multiple players capable of creating shots.
That variety can make an offense harder to disrupt because the defense cannot focus entirely on one facilitator.
The Plus/Minus Story
Plus/minus is useful, but it should not be treated as a standalone measure of player quality.
The Lakers’ main plus/minus figures included:
- Austin Reaves: +18
- Rui Hachimura: +16
- Luka Doncic: +15
- LeBron James: +12
- Deandre Ayton: +9
On Chicago’s side, the supplied box score showed:
- Rob Dillingham: +10
- Nick Richards: -7
- Leonard Miller: -11
- Tre Jones: -14
- Josh Giddey: -8
- Matas Buzelis: -25
Buzelis’ -25 stands out, but that number should be interpreted alongside his 22 points, 6 rebounds, 2 steals and 2 blocks.
Plus/minus reflects the team’s scoring margin while a player is on the floor. It does not isolate individual responsibility for every possession.
Why the Lakers Won Despite Chicago’s Offensive Efficiency
The statistical answer is multi-layered.
1. Doncic created an enormous scoring advantage
Doncic scored 51 points.
Chicago’s highest scorer, Giddey, scored 27.
That is a 24-point difference between the two teams’ leading scorers.
2. Los Angeles had multiple efficient scorers
Reaves scored 30 on 13-of-20 shooting.
Ayton scored 23 on 10-of-13.
Hachimura scored 15 on 6-of-10.
That gave the Lakers several efficient scoring options.
3. Los Angeles protected the ball better
Nine turnovers compared with 15 for Chicago created a six-possession advantage before considering other possession factors.
4. Los Angeles shot better from three
The Lakers made 17 of 36 threes.
Chicago made 15 of 36.
The attempt volume was identical, but Los Angeles converted two additional shots from behind the arc.
5. The Lakers won the middle quarters
The second and third quarters produced the largest separation.
Los Angeles scored 82 points across those two periods.
Chicago scored 72.
That 10-point difference essentially established the margin that Chicago could not erase.
What the Bulls Did Well
A fair statistical analysis should not reduce the game to the final score.
Chicago had several positive elements.
The Bulls scored 130 points.
They shot 54% overall.
They made 42% of their threes.
They recorded 34 assists.
They matched Los Angeles with 41 rebounds.
Giddey delivered 27 points and 15 assists.
Buzelis scored 22 points.
Miller recorded nine rebounds while shooting 6-of-9.
Richards scored 15 on 7-of-9 shooting.
These are not indicators of an offense that simply stopped functioning.
The more precise conclusion is that Chicago’s offense was productive but faced an even more explosive Lakers attack.
What the Lakers Did Well
Los Angeles combined individual star production with efficient supporting contributions.
Doncic supplied 51 points and nine assists.
Reaves added 30 points and seven assists.
Ayton contributed 23 points and 10 rebounds.
James added 18 points, seven rebounds and seven assists.
Hachimura contributed 15 points while shooting 60% from the field.
That distribution made it difficult for Chicago to solve the Lakers through a single defensive adjustment.
A Practical Framework for Reading NBA Player Stats
For readers researching a game like this, looking only at points is usually not enough.
A better process is to examine five areas.
Step 1: Identify the highest-volume scorers
Start with points and field-goal attempts.
This tells you who carried the offensive workload.
Step 2: Check efficiency
Compare field-goal percentage and three-point percentage with shot volume.
A player scoring 25 points on 10 shots has a very different efficiency profile from a player scoring 25 on 25 shots.
Step 3: Examine playmaking
Assists help identify players who created scoring opportunities for teammates.
In this game, Giddey’s 15 assists and Doncic’s nine were major parts of the offensive story.
Step 4: Check turnovers
High assist totals can come with significant turnover costs.
That is why Giddey’s 15 assists should be read alongside his six turnovers.
Step 5: Review team-level statistics
Finally, compare shooting, rebounds, assists, turnovers and defensive events.
This prevents one spectacular individual performance from obscuring the wider team context.
Why This Game Is Useful for Fantasy and Statistical Analysis
Historical game statistics can also be useful for fantasy basketball research and player evaluation.
A player such as Doncic demonstrates why multi-category production matters.
His line included points, rebounds, assists, steals and a block.
Reaves combined scoring with assists.
Ayton combined scoring and rebounding.
Giddey combined scoring, rebounding and elite playmaking.
The important lesson is not to rely on one category.
A player who produces across several statistical areas can have significant value even when another player scores more points.
Understanding the Season-Series Result
The Lakers won the season series 2-0.
That is a useful historical note, but it should not automatically be treated as proof that every future matchup would follow the same pattern.
Individual games are affected by injuries, rotations, shooting variance, schedule conditions and player availability.
The March meeting itself included LeBron James returning after missing three games, according to the official recap. (NBA.com)
That context matters when comparing this game with another Bulls-Lakers meeting.
Official Statistical Reference
For readers who want to verify individual minutes, field-goal attempts, three-point attempts, free throws, rebounds, assists, steals, blocks, turnovers and plus/minus figures, the official NBA box score is the appropriate primary reference. (NBA.com)
Frequently Asked Questions
Who scored the most points in the Bulls vs Lakers game?
Luka Doncic led all scorers with 51 points for the Lakers. He also recorded 10 rebounds and 9 assists. (NBA.com)
What was the final score of Bulls vs Lakers?
The Los Angeles Lakers defeated the Chicago Bulls 142-130. (NBA.com)
How many points did Josh Giddey score?
Josh Giddey scored 27 points. He also recorded 8 rebounds and 15 assists for Chicago. (ESPN)
How many points did Austin Reaves score?
Austin Reaves scored 30 points on 13-of-20 shooting. He also had 5 rebounds and 7 assists. (ESPN)
Did Luka Doncic record a triple-double?
No. Doncic finished with 51 points, 10 rebounds and 9 assists, leaving him one assist short of a triple-double. (NBA.com)
Which team shot better from three-point range?
The Lakers shot 47% from three, making 17 of 36 attempts. The Bulls shot 42%, making 15 of 36. (NBA.com)
Conclusion
The chicago bulls vs lakers match player stats show a game in which both offenses performed at a high level, but Los Angeles produced more efficient scoring from its leading players and protected the basketball better.
Luka Doncic’s 51 points, 10 rebounds and 9 assists were the headline numbers, while Austin Reaves’ 30 points and Deandre Ayton’s 23 points and 10 rebounds gave the Lakers additional offensive support. LeBron James contributed 18 points, 7 rebounds and 7 assists in his return.
Chicago had its own strong individual performances. Josh Giddey recorded 27 points and 15 assists, Matas Buzelis scored 22, Tre Jones added 18 and Leonard Miller finished with 15 points and 9 rebounds.
The team comparison is equally revealing. Chicago shot 54% from the field and 42% from three, while Los Angeles shot 56% overall and 47% from three. Both teams collected 41 rebounds, but Chicago committed 15 turnovers compared with only 9 for Los Angeles.
The biggest separation came during the second and third quarters. After a 26-26 opening period, the Lakers scored 41 points in each of the next two quarters. Chicago also produced 36 points in each of those periods, but the five-point difference in each quarter gradually created the margin that decided the contest.
For anyone studying NBA box scores, this game is a useful example of why player statistics should be examined as a connected system. Points explain who scored, shooting percentages explain efficiency, assists show creation, turnovers reveal possession costs, and team statistics provide the context needed to understand how individual performances translated into the final result.