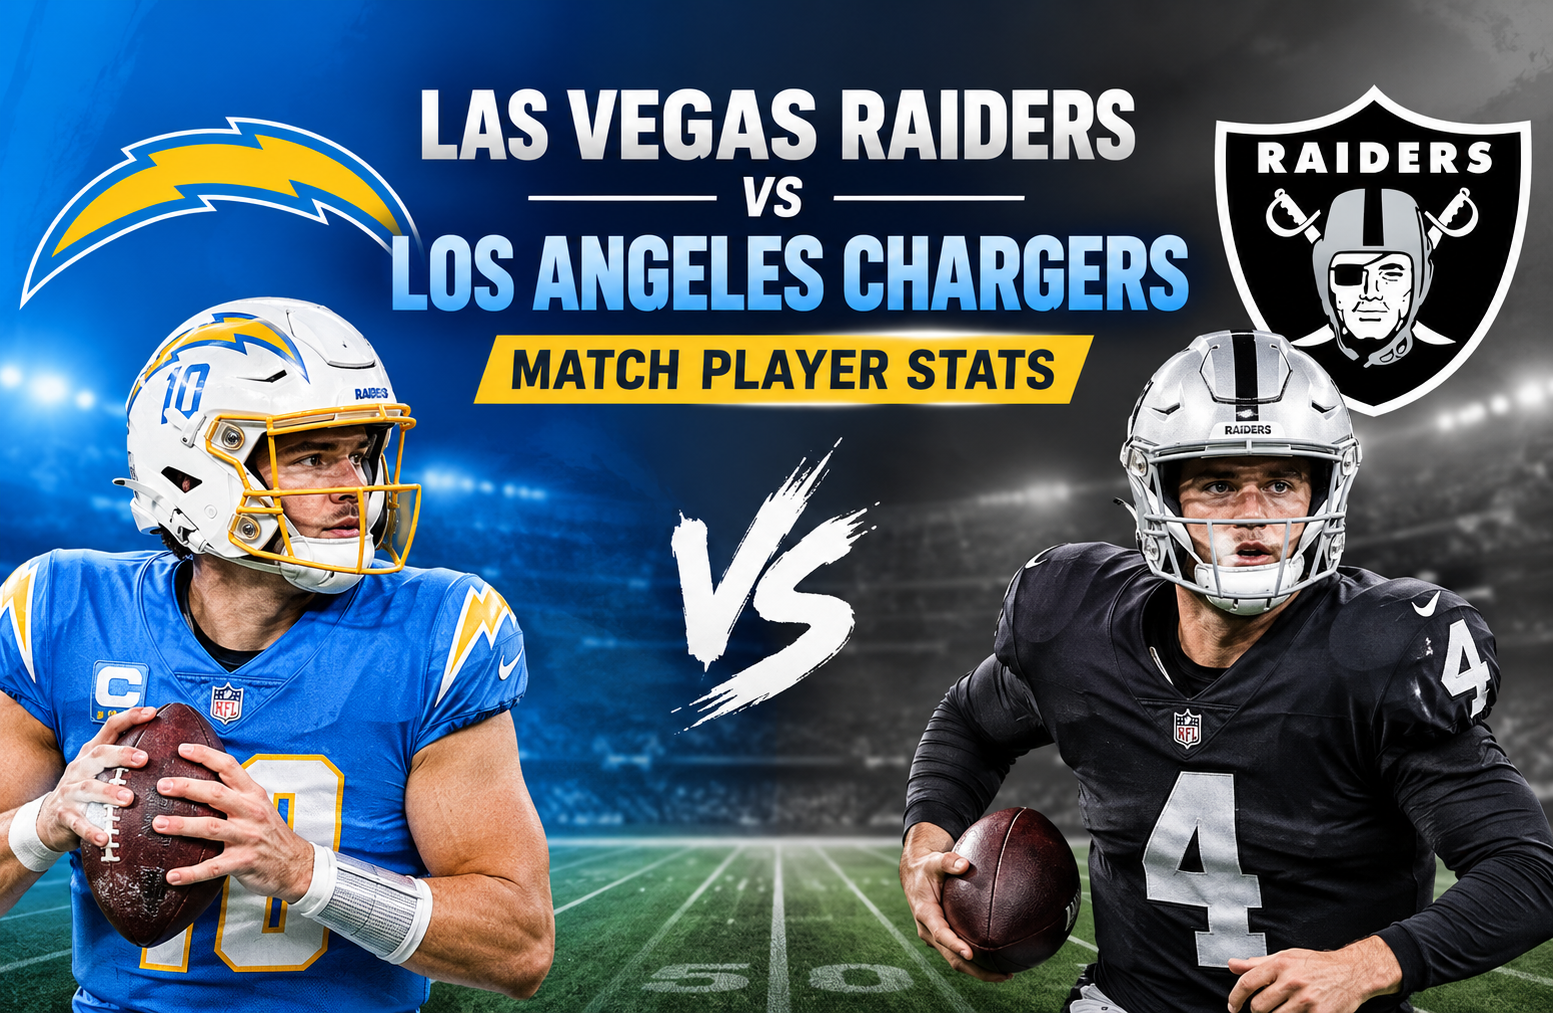
Las Vegas Raiders vs Los Angeles Chargers Match Player Stats
The las vegas raiders vs los angeles chargers match player stats from the January 5, 2025 meeting tell a clear story about why Los Angeles finished the regular season with a 34-20 victory at Allegiant Stadium. Justin Herbert delivered an efficient passing performance, Quentin Johnston produced a career-best receiving game, and the Chargers found enough balance on the ground to pull away in the second half. Las Vegas showed flashes through Aidan O’Connell, Jakobi Meyers, and Brock Bowers, but the Raiders could not match Los Angeles’ consistency over four quarters.
The matchup was the final regular-season game for both teams. The Chargers entered at 10-6 and needed a win to secure the AFC’s No. 5 seed, while the Raiders entered at 4-12. Los Angeles ultimately improved to 11-6 with the victory, while Las Vegas finished 4-13. The final score was 34-20, with the Chargers leading 17-10 at halftime and adding another 17 points after the break.
For readers studying the las vegas raiders vs los angeles chargers match player stats, the most important takeaway is not simply that Herbert threw for 346 yards. The deeper story is how Los Angeles repeatedly created explosive plays while maintaining enough offensive efficiency to control the game. Johnston’s 186 receiving yards, Herbert’s 42 rushing yards, and the Chargers’ ability to sustain long drives were all important pieces of the result.
Game Overview and Final Score
The Chargers won 34-20, but the game was more competitive early than the final margin suggests.
Las Vegas opened the scoring with a Daniel Carlson field goal. Los Angeles answered with a Cameron Dicker field goal, leaving the game tied at 3-3 after the opening quarter.
The Raiders then moved ahead when O’Connell connected with Meyers for a 25-yard touchdown. Los Angeles responded with two more field goals before Herbert found DJ Chark Jr. for a six-yard touchdown late in the second quarter. Herbert then connected with Ladd McConkey on the successful two-point conversion.
That sequence changed the momentum.
At halftime, Los Angeles led 17-10. The Chargers added another field goal in the third quarter before Las Vegas answered with a Carlson field goal to make it 20-13.
The fourth quarter belonged to Los Angeles.
Herbert’s passing helped establish the Chargers deep in Raiders territory, and Will Dissly finished one drive with a two-yard touchdown reception. Hassan Haskins later added a two-yard rushing touchdown after a long, clock-consuming possession.
Las Vegas scored one late touchdown through Brock Bowers, but the deficit was too large to overcome.
The official Chargers postgame report confirms the 34-20 result, Herbert’s 346 passing yards, Johnston’s 186 receiving yards, and several other key statistical milestones from the game.
las vegas raiders vs los angeles chargers match player stats
The best way to understand this matchup is to separate the individual performances into passing, rushing, receiving, kicking, and defensive impact.
Passing Statistics
| Player | Comp/Att | Yards | Avg | TD | INT | Rating |
| Justin Herbert | 28/36 | 346 | 9.6 | 2 | 0 | 125.2 |
| Aidan O’Connell | 24/34 | 214 | 6.3 | 2 | 1 | 94.5 |
| Desmond Ridder | 1/2 | 11 | 5.5 | 0 | 0 | 66.7 |
Justin Herbert was the game’s most important player.
He completed 28 of 36 attempts, giving him a completion rate of 77.8%. He produced 346 passing yards and averaged 9.6 yards per attempt. More importantly, he threw two touchdowns without an interception.
That combination of volume, accuracy, and efficiency allowed the Chargers to keep attacking without giving Las Vegas a short field through turnovers.
Herbert’s 125.2 passer rating was also dramatically higher than O’Connell’s 94.5. The Raiders quarterback was not ineffective, but he had fewer opportunities to generate explosive passing plays and was intercepted once.
O’Connell completed 24 of 34 passes for 214 yards. His two touchdown passes prevented the game from becoming a complete blowout, but his passing attack produced a much lower average of 6.3 yards per attempt.
Desmond Ridder appeared briefly and completed one of two passes for 11 yards.
Justin Herbert’s Influence
Herbert’s final line deserves more attention than the raw yardage suggests.
He did not need a huge number of attempts to generate 346 yards. His 36 attempts produced nearly 10 yards per attempt, which is a strong indicator that the Chargers were creating meaningful gains rather than simply accumulating short completions.
He also added 42 rushing yards on four carries.
That rushing production mattered because one of those runs went for 41 yards. The explosive scramble helped set up a Chargers touchdown and demonstrated how Herbert could punish the defense when coverage prevented an immediate passing opportunity.
The official Chargers notes confirm that Herbert completed 28 of 36 passes for 346 yards and added 42 rushing yards, including a 41-yard run.
Aidan O’Connell’s Performance
O’Connell’s performance was mixed.
His 24 completions showed that Las Vegas could move the football through the air. He also threw touchdowns to Jakobi Meyers and Brock Bowers.
However, the interception late in the second quarter was costly.
Daiyan Henley picked off O’Connell with 38 seconds remaining before halftime. The Chargers immediately converted the takeaway into a touchdown pass from Herbert to Chark.
That was one of the game’s biggest turning points.
A box score may record the interception as only one statistic, but its timing made it much more damaging. Instead of entering halftime with a manageable 10-9 deficit, Las Vegas went into the break down 17-10.
Chargers Receiving Leaders
Los Angeles’ receiving numbers were dominated by Quentin Johnston.
| Player | Receptions | Yards | Avg | TD | Long | Targets |
| Quentin Johnston | 13 | 186 | 14.3 | 0 | 39 | 14 |
| Ladd McConkey | 5 | 95 | 19.0 | 0 | 47 | 8 |
| Will Dissly | 5 | 42 | 8.4 | 1 | 15 | 6 |
| J.K. Dobbins | 3 | 12 | 4.0 | 0 | 9 | 3 |
| DJ Chark | 1 | 6 | 6.0 | 1 | 6 | 3 |
| Derius Davis | 1 | 5 | 5.0 | 0 | 5 | 1 |
Quentin Johnston’s Breakout Game
Johnston was the standout receiving performer.
He caught 13 passes for 186 yards, averaging 14.3 yards per reception. His longest reception covered 39 yards, and he received 14 targets.
The 13 receptions were particularly notable because Johnston converted almost every meaningful opportunity into production.
His performance was not simply a product of one deep reception. He repeatedly moved the chains, including several important catches in the first half.
The Chargers’ official postgame notes state that Johnston established career highs with 13 receptions and 186 yards. They also note that he had nine receptions for 117 yards in the first half.
That first-half production helps explain why Herbert’s overall passing efficiency was so strong.
Johnston gave the quarterback a dependable target who could create yards after the catch while also threatening the defense vertically.
Ladd McConkey’s Explosive Efficiency
McConkey finished with five catches for 95 yards.
His 19.0 yards per reception was higher than Johnston’s 14.3 average. He also produced the longest reception of the game for the Chargers, a 47-yard catch.
That is an important distinction.
Johnston provided volume, while McConkey provided explosive efficiency.
The combination made it difficult for the Raiders to focus coverage on one receiver. If the defense adjusted toward Johnston, McConkey could create a major gain. If the Raiders gave too much attention to McConkey, Johnston could dominate the intermediate areas.
Will Dissly’s Red-Zone Contribution
Dissly caught five passes for 42 yards and scored one touchdown.
His two-yard touchdown reception in the fourth quarter helped Los Angeles turn a relatively close 20-13 game into a more comfortable 27-13 lead.
His statistical contribution was not as large as Johnston’s, but his touchdown came at an important point in the contest.
DJ Chark’s Touchdown
Chark caught only one pass, but it was a touchdown.
His six-yard reception came immediately after Henley’s interception late in the second quarter.
That is a useful reminder when evaluating player statistics: volume does not always equal impact.
Chark had only three targets and one reception, yet his single catch produced seven points when the two-point conversion is included in the scoring sequence.
Raiders Receiving Leaders
Las Vegas relied heavily on its top offensive weapons.
| Player | Receptions | Yards | Avg | TD | Long | Targets |
| Jakobi Meyers | 9 | 123 | 13.7 | 1 | 25 | 10 |
| Brock Bowers | 4 | 50 | 12.5 | 1 | 21 | 9 |
| Tre Tucker | 3 | 24 | 8.0 | 0 | 11 | 9 |
| Michael Mayer | 4 | 21 | 5.3 | 0 | 11 | 4 |
| Alexander Mattison | 4 | 11 | 2.8 | 0 | 6 | 5 |
| Chris Collier | 1 | -4 | -4.0 | 0 | -4 | 2 |
Jakobi Meyers
Meyers was the Raiders’ leading receiver.
He caught nine passes for 123 yards and scored one touchdown. His 10 targets represented a major portion of O’Connell’s passing workload.
His 25-yard touchdown gave Las Vegas an early 10-3 advantage in the second quarter.
Meyers’ production was especially important because the Raiders’ running game struggled to create consistent yardage. With limited rushing support, Las Vegas needed its passing game to carry a greater share of the offense.
Brock Bowers
Bowers finished with four receptions for 50 yards and one touchdown.
His final touchdown came with 25 seconds remaining and cut the deficit to 14 points.
His stat line does not fully show how important he was to the Raiders’ passing structure. Bowers attracted nine targets, nearly matching Meyers’ target total despite recording five fewer receptions.
The difference was efficiency and opportunity conversion.
Bowers had several important catches during the final scoring drive, including the 12-yard touchdown.
Tre Tucker and Michael Mayer
Tucker caught three passes for 24 yards on nine targets.
That is a low 8.0 yards-per-reception average, and his nine targets show that the Raiders tried to involve him frequently.
Mayer added four receptions for 21 yards.
His 5.3 yards per reception indicates how much of the Raiders’ passing production came from shorter routes and underneath completions.
Rushing Statistics
The ground game produced a major statistical advantage for Los Angeles.
| Player | Carries | Yards | Avg | TD | Long |
| J.K. Dobbins | 18 | 63 | 3.5 | 0 | 10 |
| Justin Herbert | 4 | 42 | 10.5 | 0 | 41 |
| Hassan Haskins | 12 | 33 | 2.8 | 1 | 12 |
| Alexander Mattison | 6 | 20 | 3.3 | 0 | 11 |
| Aidan O’Connell | 4 | 13 | 3.3 | 0 | 9 |
| Chris Collier | 2 | 6 | 3.0 | 0 | 4 |
The Chargers recorded 137 rushing yards on 35 attempts.
The Raiders managed only 39 rushing yards on 12 attempts.
That 98-yard difference is one of the clearest statistical explanations for the final result.
J.K. Dobbins
Dobbins carried the ball 18 times for 63 yards.
His 3.5 yards per carry was not spectacular, but his workload mattered.
Los Angeles continued using him even when individual runs produced modest gains. That helped maintain balance and allowed Herbert to operate without having to carry every possession through the passing game.
The Chargers’ official notes also state that Dobbins reached 1,000 yards from scrimmage during the season and finished this game with 63 rushing yards.
Justin Herbert’s Rushing Impact
Herbert’s four carries produced 42 yards.
That is an outstanding 10.5 yards per carry.
The 41-yard scramble was the key play.
Quarterback rushing can be particularly valuable when it comes unexpectedly. Defenders may be positioned primarily to defend receivers, leaving a quarterback lane open when coverage holds for too long.
Herbert exploited that opportunity.
Hassan Haskins
Haskins carried 12 times for 33 yards and scored the Chargers’ final rushing touchdown.
His 2.8 yards per carry was modest, but his fourth-quarter role was important.
Los Angeles used Haskins repeatedly during its long scoring possession, forcing Las Vegas to defend the run again and again.
Eventually, Haskins finished the drive with a two-yard touchdown.
This was a classic example of situational value being more important than average yardage.
Raiders Rushing Problems
Las Vegas ran the ball only 12 times for 39 yards.
That averages 3.3 yards per carry.
Alexander Mattison led Raiders running backs with six carries for 20 yards, while O’Connell added 13 yards on four carries.
Chris Collier recorded two carries for six yards.
The biggest problem was not simply the low average. It was the lack of volume.
A team that produces only 12 rushing attempts makes it easier for the opponent to anticipate pass-heavy situations. That can put additional pressure on the quarterback and receivers.
The Raiders were therefore forced to rely heavily on O’Connell’s arm.
That approach produced two touchdowns, but it was not enough to keep pace with Herbert.
The Importance of Third and Fourth Quarter Play
The halftime score was 17-10, so this was not a game that Los Angeles won exclusively in the opening two quarters.
The Chargers scored 17 points after halftime.
They added a field goal in the third quarter, then two touchdowns in the fourth.
The Raiders managed only 10 points after halftime.
That second-half separation came from several factors:
- Los Angeles continued producing explosive passing plays.
- Herbert remained efficient.
- The Chargers’ running game consumed clock.
- Los Angeles converted scoring opportunities more consistently.
- Las Vegas struggled to generate comparable rushing production.
The Chargers were not forced into desperate football late in the game.
Instead, they were able to keep using the run and short passing game while taking selective deep shots.
Key Turning Points
Henley’s Interception Before Halftime
The interception by Daiyan Henley was arguably the most important defensive play.
O’Connell threw the pick with 38 seconds left in the second quarter.
The Chargers needed only four plays to turn the turnover into a touchdown.
That sequence produced a seven-point swing and gave Los Angeles a 17-10 halftime lead.
Henley recorded his first career interception on the play, according to the Chargers’ official postgame notes.
McConkey’s 47-Yard Reception
McConkey’s 47-yard catch provided Los Angeles with a major explosive gain.
Plays like this change defensive structure.
A defense can survive several short completions, but a 47-yard gain immediately creates scoring territory and forces defenders to reconsider how aggressively they can play underneath routes.
Herbert’s 41-Yard Run
Herbert’s 41-yard scramble was another defining play.
It demonstrated that the Raiders could not simply focus on containing Los Angeles’ receivers.
The quarterback himself became a rushing threat.
That play helped position the Chargers for another touchdown and reinforced the overall theme of the game: Los Angeles had multiple ways to generate explosive plays.
Haskins’ Fourth-Quarter Touchdown
Haskins’ touchdown put the Chargers up 34-13.
At that point, Las Vegas needed two scores plus successful possessions to make the game competitive again.
Bowers’ late touchdown reduced the margin to 14 points, but the Raiders had run out of realistic time to complete the comeback.
Kicking and Special Teams
Cameron Dicker was perfect on extra points and converted four field goals.
He made field goals from 33, 32, 49, and 20 yards, finishing with 14 points.
Daniel Carlson made both of his field-goal attempts for Las Vegas, including a 47-yard kick, and converted both extra points.
Carlson scored eight points.
Dicker’s 14-point performance was particularly significant in the context of his season. The Chargers’ official postgame report notes that his 150 points in 2024 were the most by a kicker in Chargers franchise history.
Punting also favored Las Vegas in average distance.
AJ Cole recorded three punts for 180 yards, averaging 60.0 yards per punt, with a long of 62 yards.
JK Scott had one punt for 47 yards.
Las Vegas also recorded two kick returns for 58 total yards, while Los Angeles did not record a kick return.
Defensive Impact
The defensive box score contained fewer headline numbers than the offensive statistics, but Henley’s interception had major value.
Los Angeles also benefited from the fact that the Raiders did not record an interception.
That turnover difference was important.
The Chargers protected the football through the air while taking advantage of one Raiders mistake.
In a game decided by 14 points, a single turnover can appear small. In context, however, Henley’s interception directly led to a touchdown and helped establish the halftime advantage.
What the Player Stats Tell Us About the Game
The las vegas raiders vs los angeles chargers match player stats reveal several broader lessons about offensive efficiency.
1. Passing Efficiency Beat Passing Volume
O’Connell completed 24 passes compared with Herbert’s 28.
The difference was not completion volume.
The difference was what happened after the completions.
Herbert averaged 9.6 yards per attempt compared with O’Connell’s 6.3.
That 3.3-yard difference per attempt is significant across 36 attempts.
2. Explosive Plays Were a Major Advantage
Los Angeles had several major gains:
- McConkey: 47-yard reception
- Herbert: 41-yard rush
- Johnston: 39-yard reception
- Johnston: 186 receiving yards overall
Las Vegas produced useful gains through Meyers and Bowers, but did not match the Chargers’ combination of explosive plays and sustained drives.
3. The Chargers Had Better Balance
Los Angeles recorded 137 rushing yards and 346 passing yards.
That gave the offense multiple ways to attack.
The Raiders produced 39 rushing yards and 225 passing yards.
The resulting 264-yard difference in total offensive yardage shows just how much more consistently the Chargers moved the ball.
4. Red-Zone Execution Mattered
Los Angeles scored touchdowns through Chark, Dissly, and Haskins.
The Raiders scored touchdowns through Meyers and Bowers.
The Chargers also added four field goals.
That ability to keep adding points meant Las Vegas needed touchdowns rather than field goals to remain competitive.
Player Performance Grades Based on the Box Score
A simple performance framework can help readers understand which players had the biggest impact.
Justin Herbert: A+
Herbert completed 77.8% of his passes, threw for 346 yards, recorded two touchdowns, and avoided interceptions.
His 42 rushing yards added another dimension.
Quentin Johnston: A+
Thirteen catches for 186 yards is the defining receiving performance of the game.
The 14 targets also show that his production came through sustained involvement rather than a single unusual play.
Ladd McConkey: A
Five catches for 95 yards is excellent efficiency, especially with a 47-yard long reception.
J.K. Dobbins: B
Dobbins produced 63 rushing yards on 18 attempts.
His average was modest, but his workload supported the Chargers’ offensive balance.
Aidan O’Connell: B-
O’Connell completed 24 of 34 passes for 214 yards and two touchdowns.
The interception before halftime, however, was costly.
Jakobi Meyers: A-
Meyers produced nine catches, 123 yards, and a touchdown.
He was the Raiders’ most productive receiver.
Brock Bowers: B+
Bowers finished with 50 receiving yards and a touchdown while receiving nine targets.
His late touchdown was one of the Raiders’ final bright spots.
Why This Game Matters for Evaluating Player Stats
One of the biggest mistakes when reading NFL statistics is looking only at totals.
A player can have 100 receiving yards and still have less impact than another player with 60 yards if those 60 yards come in critical situations.
The same principle applies to quarterbacks.
Herbert’s 346 yards were impressive, but his lack of interceptions, high completion percentage, rushing production, and explosive passing average made the performance even stronger.
For the Raiders, Meyers’ 123 yards were valuable, but Las Vegas could not consistently combine those passing gains with rushing production.
This is why a complete box-score analysis should look at:
- Volume
- Efficiency
- Explosive plays
- Turnovers
- Scoring opportunities
- Game situation
- Time of possession
- Balance between passing and rushing
Looking at all of those factors provides a much clearer explanation of the 34-20 result.
Team Statistical Comparison
| Category | Chargers | Raiders |
| Final Score | 34 | 20 |
| Passing Yards | 346 | 225 |
| Rushing Yards | 137 | 39 |
| Passing TDs | 2 | 2 |
| Rushing TDs | 1 | 0 |
| Interceptions Thrown | 0 | 1 |
| Total Receiving Yards | 346 | 225 |
| Field Goals Made | 4 | 2 |
| Extra Points Made | 2 | 2 |
The most striking difference is the rushing total.
Los Angeles gained 137 rushing yards while Las Vegas gained only 39.
That 98-yard difference complemented a 121-yard advantage in passing production.
Together, those numbers explain why the Chargers controlled the statistical profile of the game.
Most Important Players in the Matchup
If the objective is to identify the players who most influenced the result, the ranking is straightforward.
1. Justin Herbert
His combination of passing efficiency and rushing ability made him the central offensive force.
2. Quentin Johnston
Johnston’s 13 receptions for 186 yards gave Los Angeles a consistent source of offensive production.
3. Ladd McConkey
His 95 yards and 47-yard reception supplied the explosive element that complemented Johnston’s volume.
4. Jakobi Meyers
Meyers was the Raiders’ most productive receiver and accounted for a significant portion of their offensive success.
5. Daiyan Henley
His interception changed the game immediately before halftime and created a scoring opportunity.
6. Brock Bowers
Bowers’ 50 receiving yards and touchdown kept Las Vegas competitive late, even though his production came against a significant deficit.
Frequently Asked Questions
Who won the Las Vegas Raiders vs Los Angeles Chargers game on January 5, 2025?
The Los Angeles Chargers defeated the Las Vegas Raiders 34-20 at Allegiant Stadium.
How many passing yards did Justin Herbert have against the Raiders?
Justin Herbert completed 28 of 36 passes for 346 yards, two touchdowns, and no interceptions.
Who led the Chargers in receiving?
Quentin Johnston led Los Angeles with 13 receptions for 186 yards. He also received 14 targets.
How many yards did Jakobi Meyers have?
Jakobi Meyers caught nine passes for 123 yards and one touchdown.
How did Brock Bowers perform against the Chargers?
Brock Bowers caught four passes for 50 yards and one touchdown on nine targets.
Which team had more rushing yards?
The Los Angeles Chargers had 137 rushing yards, while the Raiders had 39.
Conclusion
The las vegas raiders vs los angeles chargers match player stats show why Los Angeles earned a convincing 34-20 victory despite Las Vegas remaining competitive for much of the first half.
Justin Herbert was the central figure, producing 346 passing yards, two touchdowns, no interceptions, and another 42 rushing yards. Quentin Johnston delivered the game’s biggest receiving performance with 13 catches for 186 yards, while Ladd McConkey added 95 yards and a 47-yard reception.
The Chargers also had a substantial advantage on the ground. Their 137 rushing yards compared with only 39 from Las Vegas created a major difference in offensive balance.
For the Raiders, Jakobi Meyers was the leading receiver with 123 yards and a touchdown. Brock Bowers added 50 yards and a touchdown, while Aidan O’Connell threw for 214 yards and two scores. However, the interception before halftime proved costly because Los Angeles converted it into a touchdown almost immediately.
The game ultimately came down to efficiency, explosive plays, turnovers, and balance. Los Angeles excelled in each of those areas. The result was an 11-6 regular-season finish and the AFC’s No. 5 seed, while Las Vegas ended its campaign at 4-13.