Phoenix Mercury vs Minnesota Lynx Match Player Stats
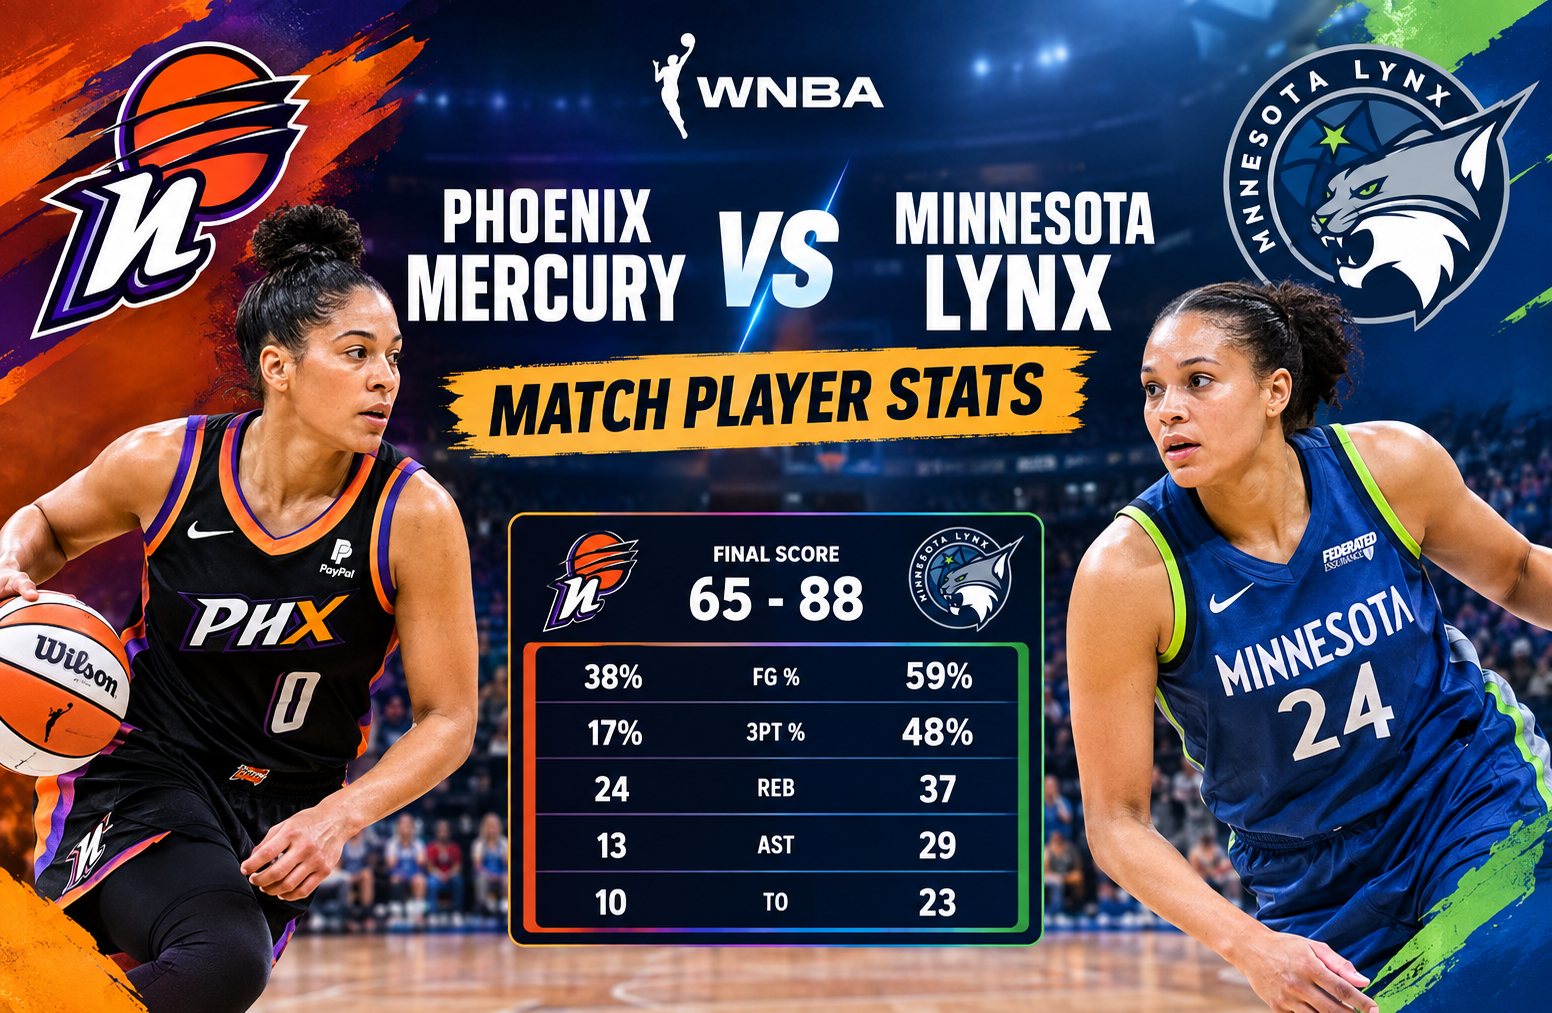
The Phoenix Mercury vs Minnesota Lynx match player stats from their 2025 WNBA Commissioner’s Cup meeting provide a clear picture of how Minnesota turned a competitive opening quarter into an 88-65 victory. The game was played at Target Center in Minneapolis, where the Lynx improved to 8-0 at the time while Phoenix fell to 5-3. Minnesota’s 59% field-goal shooting, 48% three-point shooting, 29 assists, and 37 rebounds were central to the result, while Phoenix struggled to convert from long range and scored only 65 points.
There is also an important date detail when researching this game. ESPN lists the contest as June 4, 2025 in its box score and recap, while the local game record identifies it as Tuesday, June 3, 2025 at Target Center. This difference is related to how game times and publication dates are displayed across sources. The official game identifier associated with the contest is 401736157.
For readers searching for individual performances, team efficiency, shooting numbers, rebounds, assists, turnovers, and the reasons behind the 23-point margin, this game offers plenty to examine.
Phoenix Mercury vs Minnesota Lynx Match Player Stats
The final score was:
| Team | Q1 | Q2 | Q3 | Q4 | Final |
| Phoenix Mercury | 23 | 12 | 14 | 16 | 65 |
| Minnesota Lynx | 19 | 25 | 23 | 21 | 88 |
Phoenix won the first quarter 23-19, but Minnesota controlled every quarter after that. The Lynx scored 25 points in the second quarter, 23 in the third, and 21 in the fourth. Phoenix managed only 42 points across the final three periods.
That scoring pattern is one of the most useful parts of the game to study. The Mercury were not immediately overwhelmed. They were ahead after the opening period and had a chance to establish control. Instead, Minnesota gradually took over through better shooting, passing, rebounding, and half-court execution.
The final 88-65 score does not fully explain how the game changed. The quarter-by-quarter numbers show that the contest was competitive early before Minnesota created separation.
Game Overview and Context
The game was part of the WNBA Commissioner’s Cup. It took place at Target Center in Minneapolis, with an announced attendance of 8,772 according to the supplied game data.
At the time of the matchup, Phoenix entered at 5-3 overall and 1-2 on the road. Minnesota entered 8-0 overall and 4-0 at home. Those records provide useful context because Minnesota was already undefeated and playing with considerable confidence on its home floor.
The Lynx also entered the contest after beating Phoenix 74-71 several days earlier. That made the June meeting particularly interesting because the teams had already seen each other’s defensive schemes and offensive tendencies. Minnesota won both contests in that short span.
The first game was much closer. The second meeting became a 23-point Minnesota victory.
That difference is important for anyone studying team and player statistics. A matchup cannot always be understood by looking at the final score alone. Shooting efficiency and how teams create shots often explain much more.
Team Shooting Comparison
The biggest statistical difference came from shooting efficiency.
| Category | Phoenix Mercury | Minnesota Lynx |
| Field Goals | 28-73 | 34-58 |
| Field-Goal Percentage | 38% | 59% |
| Three-Pointers | 5-30 | 12-25 |
| Three-Point Percentage | 17% | 48% |
| Free Throws | 4-5 | 8-9 |
| Free-Throw Percentage | 80% | 89% |
Minnesota made six more field goals despite attempting 15 fewer shots.
That is a major efficiency difference.
The Lynx converted 34 of 58 attempts, while Phoenix made only 28 of 73. Minnesota therefore needed considerably fewer possessions to generate its 88 points.
The three-point numbers make the contrast even clearer. Phoenix shot 5-for-30 from outside, a 17% rate. Minnesota made 12 of 25, or 48%.
This means the Mercury were not simply missing a few shots. Their entire perimeter shooting performance was substantially less efficient.
A team can sometimes overcome poor three-point shooting through offensive rebounding, free throws, transition scoring, or high two-point efficiency. Phoenix did not generate enough of those advantages to compensate.
Minnesota, meanwhile, combined accurate perimeter shooting with efficient interior scoring. That combination placed significant pressure on Phoenix’s defense.
Napheesa Collier’s Complete Performance
Napheesa Collier was one of the central figures in the game.
She finished with:
- 18 points
- 11 rebounds
- 5 assists
- 8-for-13 shooting
- 2-for-3 from the free-throw line
- 1 steal
- 4 turnovers
- 31 minutes
- Plus-24 plus/minus
Collier’s 18 points tied Natisha Hiedeman for Minnesota’s team scoring lead. More importantly, her 11 rebounds gave the Lynx a strong presence on both ends of the floor.
Her shooting was especially efficient. Collier made eight of 13 field-goal attempts, meaning she converted more than 61% of her shots from the field.
Her five assists also demonstrate that her contribution was not limited to scoring. Minnesota’s offense benefited from having a frontcourt player capable of creating opportunities for teammates.
The 11 rebounds mattered because Phoenix finished the game with only 24 total rebounds as a team. Collier alone collected nearly half as many rebounds as the entire Mercury roster’s offensive and defensive totals combined.
Natisha Hiedeman Provides Major Bench Production
Natisha Hiedeman matched Collier with 18 points and became one of the most important statistical contributors from the Minnesota bench.
Her line included:
- 18 points
- 3 rebounds
- 1 assist
- 7-for-10 shooting
- 2-for-4 from three-point range
- 2-for-2 from the free-throw line
- 24 minutes
- Plus-14
Hiedeman’s 7-for-10 shooting was highly efficient. She also provided two made three-pointers, adding another perimeter threat to a Minnesota team that already had strong shooting from several starters.
This is an important lesson when reviewing player statistics. The leading scorer is not always the only player who explains a team’s offensive success.
Minnesota received 18 points from Hiedeman without requiring her to take a large number of shots. Her efficiency helped maintain offensive pressure as the Lynx built their lead.
Alanna Smith’s Efficient Two-Way Contribution
Alanna Smith scored 13 points and produced one of the most efficient shooting lines of the night.
She finished 5-for-6 from the field and 3-for-4 from three-point range. She also recorded six assists and three blocks.
That combination is particularly notable.
A player who scores 13 points on 6.0 shooting attempts has already been highly efficient, but Smith’s six assists added another dimension. Her three blocks also show that her impact was not restricted to Minnesota’s offense.
Her plus-31 was the highest on either team.
Plus/minus should not be treated as a standalone measurement of individual performance because it reflects what happens while a player is on the court. Still, in this particular game, Smith’s plus-31 aligns with several other positive indicators: efficient shooting, playmaking, and defensive activity.
Kayla McBride’s Scoring and Playmaking
Kayla McBride also scored 13 points.
Her line:
- 13 points
- 4 rebounds
- 7 assists
- 5-for-8 field goals
- 3-for-5 three-pointers
- 2 steals
- 25 minutes
- Plus-16
The seven assists were particularly important.
Minnesota finished with 29 assists on 34 made field goals. That means most of its successful shots came within an offensive structure that generated passing opportunities rather than relying exclusively on individual isolation scoring.
McBride’s three made three-pointers also helped stretch Phoenix’s defense.
When a team has multiple reliable perimeter shooters, opponents have fewer opportunities to collapse into the paint. Minnesota used that spacing effectively.
Phoenix’s Leading Individual Performers
Phoenix had several notable individual performances even though the team lost by 23 points.
Satou Sabally led the Mercury starters with 15 points and eight rebounds. She shot 6-for-16 from the field and made all three of her free throws.
Lexi Held scored 16 points and led Phoenix in scoring. She made seven of 14 field-goal attempts and hit two three-pointers. She also recorded three assists and three steals.
Kitija Laksa added 10 points on 4-for-9 shooting and made two three-pointers.
The distribution shows that Phoenix had multiple contributors, but it did not receive the same level of collective efficiency that Minnesota produced.
Phoenix’s best individual shooting lines were not enough to offset the team’s 38% overall field-goal percentage and 17% three-point percentage.
Lexi Held’s Offensive Role
Lexi Held’s 16 points were the highest total for Phoenix.
She shot 7-for-14 from the field, including 2-for-6 from three-point range. Her three steals also represented useful defensive activity.
Held’s scoring helped Phoenix remain competitive in stretches, particularly after Minnesota began creating separation.
However, Phoenix needed more consistent production from the rest of the rotation to counter Minnesota’s depth.
This is where a player-stat analysis becomes more useful than simply listing the box score. Held’s 16 points were productive, but the team context matters. Minnesota had two players at 18 points and two more at 13 points, while also receiving nine points from Karlie Samuelson and six from Jessica Shepard and Courtney Williams.
Satou Sabally’s 15 Points and Eight Rebounds
Sabally recorded 15 points and eight rebounds.
She made six of 16 shots and converted all three of her free-throw attempts. She also added two assists and one steal.
Her eight rebounds were important because Phoenix struggled to control the glass overall.
Sabally’s shooting efficiency was not as strong as Collier’s, but her combination of scoring and rebounding gave Phoenix a useful interior presence.
One notable detail from the game recap is that Sabally did not score her first points of the second half until 6:56 remained in the fourth quarter.
That illustrates how Minnesota’s defensive pressure affected one of Phoenix’s principal scoring options.
Phoenix Mercury Team Statistics
The Mercury finished with the following major numbers:
| Category | Phoenix |
| Points | 65 |
| Field Goals | 28-73 |
| FG Percentage | 38% |
| Three-Pointers | 5-30 |
| 3PT Percentage | 17% |
| Free Throws | 4-5 |
| Rebounds | 24 |
| Assists | 13 |
| Turnovers | 10 |
| Steals | 11 |
| Blocks | 3 |
| Offensive Rebounds | 6 |
| Defensive Rebounds | 18 |
| Fouls | 10 |
One statistic stands out in Phoenix’s favor: turnovers.
The Mercury committed only 10 turnovers, compared with Minnesota’s 23. Yet Phoenix still lost by 23 points.
That tells us that turnovers were not the main reason for the result.
The larger problem was efficiency. Phoenix protected the ball reasonably well but did not convert enough of its possessions into points.
This is a useful reminder when analyzing basketball. A low turnover total can look positive by itself, but it must be considered alongside shooting, rebounding, free throws, and offensive efficiency.
Minnesota Lynx Team Statistics
Minnesota’s team numbers were:
| Category | Minnesota |
| Points | 88 |
| Field Goals | 34-58 |
| FG Percentage | 59% |
| Three-Pointers | 12-25 |
| 3PT Percentage | 48% |
| Free Throws | 8-9 |
| Rebounds | 37 |
| Assists | 29 |
| Turnovers | 23 |
| Steals | 6 |
| Blocks | 4 |
| Offensive Rebounds | 3 |
| Defensive Rebounds | 34 |
| Fouls | 13 |
The Lynx’s 59% field-goal percentage was the clearest statistical advantage.
Their 29 assists also reveal how effectively the team converted ball movement into scoring opportunities.
The one major statistical weakness was turnovers. Minnesota gave the ball away 23 times, more than twice as often as Phoenix.
Despite that, the Lynx’s shooting advantage was so substantial that the turnovers did not prevent them from controlling the game.
The Rebounding Battle
Minnesota won the rebounding battle 37-24.
The difference was 13 rebounds.
Phoenix grabbed six offensive rebounds and 18 defensive rebounds. Minnesota recorded three offensive rebounds and 34 defensive rebounds.
The defensive-rebound gap is especially notable.
Minnesota collected 34 defensive rebounds, which limited Phoenix’s opportunities to generate second-chance points after missed shots.
Phoenix had more offensive rebounds than Minnesota, but that did not compensate for the overall rebounding deficit.
When a team shoots only 38%, offensive rebounds become particularly valuable because they can create additional possessions. Phoenix collected six offensive boards but still could not turn that opportunity into enough scoring.
The Assist Battle
Minnesota recorded 29 assists compared with Phoenix’s 13.
That is a 16-assist difference.
Minnesota’s 29 assists on 34 made field goals indicate that passing played a major role in its offense.
Kayla McBride led the team with seven assists. Alanna Smith had six, while Courtney Williams recorded five and Collier added five.
Phoenix had only 13 assists, meaning its 28 made field goals were generated with substantially less recorded passing involvement.
This does not mean every unassisted basket is a poor offensive possession. However, the difference demonstrates how much more connected Minnesota’s offensive attack was on this night.
The Three-Point Shooting Gap
Three-point shooting deserves its own section because the difference was enormous.
Phoenix:
5-for-30, 17%
Minnesota:
12-for-25, 48%
Minnesota made seven more three-pointers despite taking five fewer attempts.
That alone accounts for a substantial portion of the scoring difference.
The Lynx received three three-pointers each from Alanna Smith, Kayla McBride, and Karlie Samuelson.
Phoenix did not have a comparable level of perimeter efficiency.
This is one reason the final score became so difficult for Phoenix to overcome. Every additional missed three-point attempt reduced the value of possessions that could otherwise have generated efficient scoring.
How the Game Changed After the First Quarter
Phoenix led 23-19 after the opening quarter.
The turning point came in the second period.
Minnesota outscored Phoenix 25-12 in the second quarter, turning a four-point deficit into a nine-point halftime lead.
The Lynx then extended that advantage with another 23-point third quarter against only 14 Phoenix points.
According to the game recap, Minnesota outscored Phoenix 49-23 from a late first-quarter point through the third quarter, creating a 63-46 advantage with 2:41 left in the third.
That stretch effectively changed the game.
Phoenix was unable to regain its first-quarter offensive rhythm, while Minnesota continued producing efficient possessions.
What the Phoenix Mercury vs Minnesota Lynx Match Player Stats Reveal
The most useful lesson from the Phoenix Mercury vs Minnesota Lynx match player stats is that Minnesota won through collective efficiency rather than one isolated statistical category.
Several factors worked together:
- Minnesota shot 59% from the field.
- Minnesota shot 48% from three.
- Minnesota outrebounded Phoenix 37-24.
- Minnesota recorded 29 assists.
- Four Lynx players scored at least 13 points.
- Natisha Hiedeman provided 18 points from the bench.
- Napheesa Collier produced 18 points and 11 rebounds.
- Phoenix shot only 17% from three.
- Phoenix recorded just 13 assists.
- Phoenix scored 42 points across the final three quarters.
This combination explains the result much better than simply saying Minnesota scored more.
Why Phoenix’s Low Turnover Total Did Not Save the Game
Phoenix’s 10 turnovers were actually 13 fewer than Minnesota’s 23.
Normally, that might suggest Phoenix had a significant possession advantage.
But basketball possessions do not have equal value.
Minnesota converted its shots at a much higher rate. The Lynx also generated more made field goals despite taking fewer attempts.
The contrast was striking:
Phoenix took 73 field-goal attempts and made 28.
Minnesota took 58 attempts and made 34.
That means Minnesota made six more shots while attempting 15 fewer.
The statistical lesson is straightforward: protecting the ball matters, but efficient shot-making can overwhelm a turnover advantage.
Why Minnesota’s Passing Was So Important
Minnesota’s 29 assists were not simply a box-score statistic.
They help explain why the team generated such a high field-goal percentage.
With McBride, Smith, Williams, and Collier all contributing assists, the Lynx had several players capable of creating shots for teammates.
That makes an offense harder to defend because opponents cannot focus exclusively on one playmaker.
The team also had multiple players who could stretch the floor. Smith, McBride, Samuelson, and Hiedeman combined for several important three-point makes.
The result was an offense capable of producing efficient looks from multiple areas.
Individual Plus/Minus Context
Plus/minus can provide useful context, but it should never be treated as a complete measure of individual quality.
For Minnesota, Alanna Smith recorded a team-high plus-31. Collier finished at plus-24, Courtney Williams at plus-19, McBride at plus-16, and Hiedeman at plus-14.
For Phoenix, Sabally was at minus-5, while several Mercury players posted larger negative figures.
These numbers are best interpreted alongside minutes, lineups, shooting, assists, defensive plays, and game situation.
Smith’s plus-31 is particularly interesting because it occurred alongside 13 points, six assists, three blocks, and 5-for-6 shooting.
That makes her plus/minus easier to contextualize than if it appeared without any supporting statistics.
What to Look for When Comparing Future Meetings
Anyone tracking future Mercury-Lynx games should pay attention to several recurring statistical categories.
Three-Point Efficiency
The first metric to monitor is three-point percentage.
The June matchup featured a 31-percentage-point difference between Minnesota and Phoenix from outside the arc. That is too large to ignore.
Rebounding
The second area is total rebounds.
A 37-24 Minnesota advantage created a meaningful possession and defensive-control difference.
Assist Distribution
The third area is assists.
Minnesota’s 29 assists show how much offensive creation came from team passing.
Shot Volume Versus Shot Quality
Phoenix attempted 15 more field goals but made six fewer.
Future box scores should therefore be evaluated by both attempts and efficiency.
Bench Scoring
Hiedeman’s 18 points demonstrated the value of Minnesota’s reserves.
A future matchup can change considerably if one team receives substantially more efficient production from its second unit.
How to Read a WNBA Player Box Score Properly
A useful approach is to start with the final score, then move through the statistics in layers.
First, examine shooting percentage.
Second, compare three-point efficiency.
Third, check rebounds.
Fourth, look at assists and turnovers.
Fifth, examine individual scoring and shooting volume.
Finally, use advanced metrics such as plus/minus only as supporting context.
This method avoids overreacting to one impressive-looking number.
For example, Phoenix’s 10 turnovers were much better than Minnesota’s 23. If that were the only statistic examined, the result could appear surprising.
The broader box score tells a different story.
Phoenix Mercury vs Minnesota Lynx Match Player Stats: Key Takeaways
The Phoenix Mercury vs Minnesota Lynx match player stats show a game that changed dramatically after the opening quarter.
Phoenix began with a 23-19 lead but finished with only 65 points.
Minnesota scored 88 points because it combined efficient shooting with strong rebounding and exceptional ball movement.
Napheesa Collier produced 18 points and 11 rebounds.
Natisha Hiedeman also scored 18 points.
Alanna Smith added 13 points, six assists, and three blocks.
Kayla McBride scored 13 points and recorded seven assists.
For Phoenix, Lexi Held led all Mercury scorers with 16 points, while Satou Sabally contributed 15 points and eight rebounds.
The team-level numbers make the story even clearer. Minnesota shot 59% overall and 48% from three, while Phoenix shot 38% overall and 17% from three. Minnesota also had a 37-24 rebounding advantage and a 29-13 advantage in assists.
The unusual part of the box score is the turnover battle. Phoenix committed only 10 turnovers compared with Minnesota’s 23. Yet the Lynx’s superior shooting and passing efficiency more than compensated for their mistakes.
That is why this matchup is a useful example of why basketball analysis should consider the complete statistical picture rather than focusing on one category.
Frequently Asked Questions
Who led the Phoenix Mercury in scoring?
Lexi Held led Phoenix with 16 points. Satou Sabally followed with 15 points, while Kitija Laksa scored 10.
Who led the Minnesota Lynx in scoring?
Napheesa Collier and Natisha Hiedeman each scored 18 points. Collier also recorded 11 rebounds and five assists.
What was the final score between Phoenix and Minnesota?
The Minnesota Lynx defeated the Phoenix Mercury 88-65. Phoenix led 23-19 after the first quarter before Minnesota took control.
Which team shot better?
Minnesota shot 59% from the field and 48% from three-point range. Phoenix shot 38% overall and 17% from three.
Who had the most rebounds?
Napheesa Collier led the game with 11 rebounds. Satou Sabally was Phoenix’s leading rebounder with eight.
Which player had the most assists?
Kayla McBride led Minnesota with seven assists. Alanna Smith had six, while Courtney Williams and Napheesa Collier each recorded five.
Conclusion
The Phoenix Mercury vs Minnesota Lynx match player stats from this Commissioner’s Cup matchup tell a detailed story beyond the 88-65 final score.
Minnesota overcame a four-point first-quarter deficit by dramatically improving its offensive efficiency. The Lynx shot 59% from the field, made 12 of 25 three-point attempts, collected 37 rebounds, and produced 29 assists. Their balanced scoring included 18 points from Napheesa Collier, 18 from Natisha Hiedeman, 13 from Alanna Smith, and 13 from Kayla McBride.
Phoenix had strong individual efforts from Lexi Held and Satou Sabally, but the team’s 38% field-goal shooting and 17% three-point shooting made it difficult to maintain offensive pressure. The Mercury did protect the ball better, committing only 10 turnovers, but that advantage was outweighed by Minnesota’s superior shooting, rebounding, and passing.
For anyone studying this matchup, the most important numbers are not just the individual scoring totals. The relationship between shooting efficiency, three-point accuracy, assists, rebounds, and quarter-by-quarter scoring explains how Minnesota transformed an early deficit into a 23-point victory.