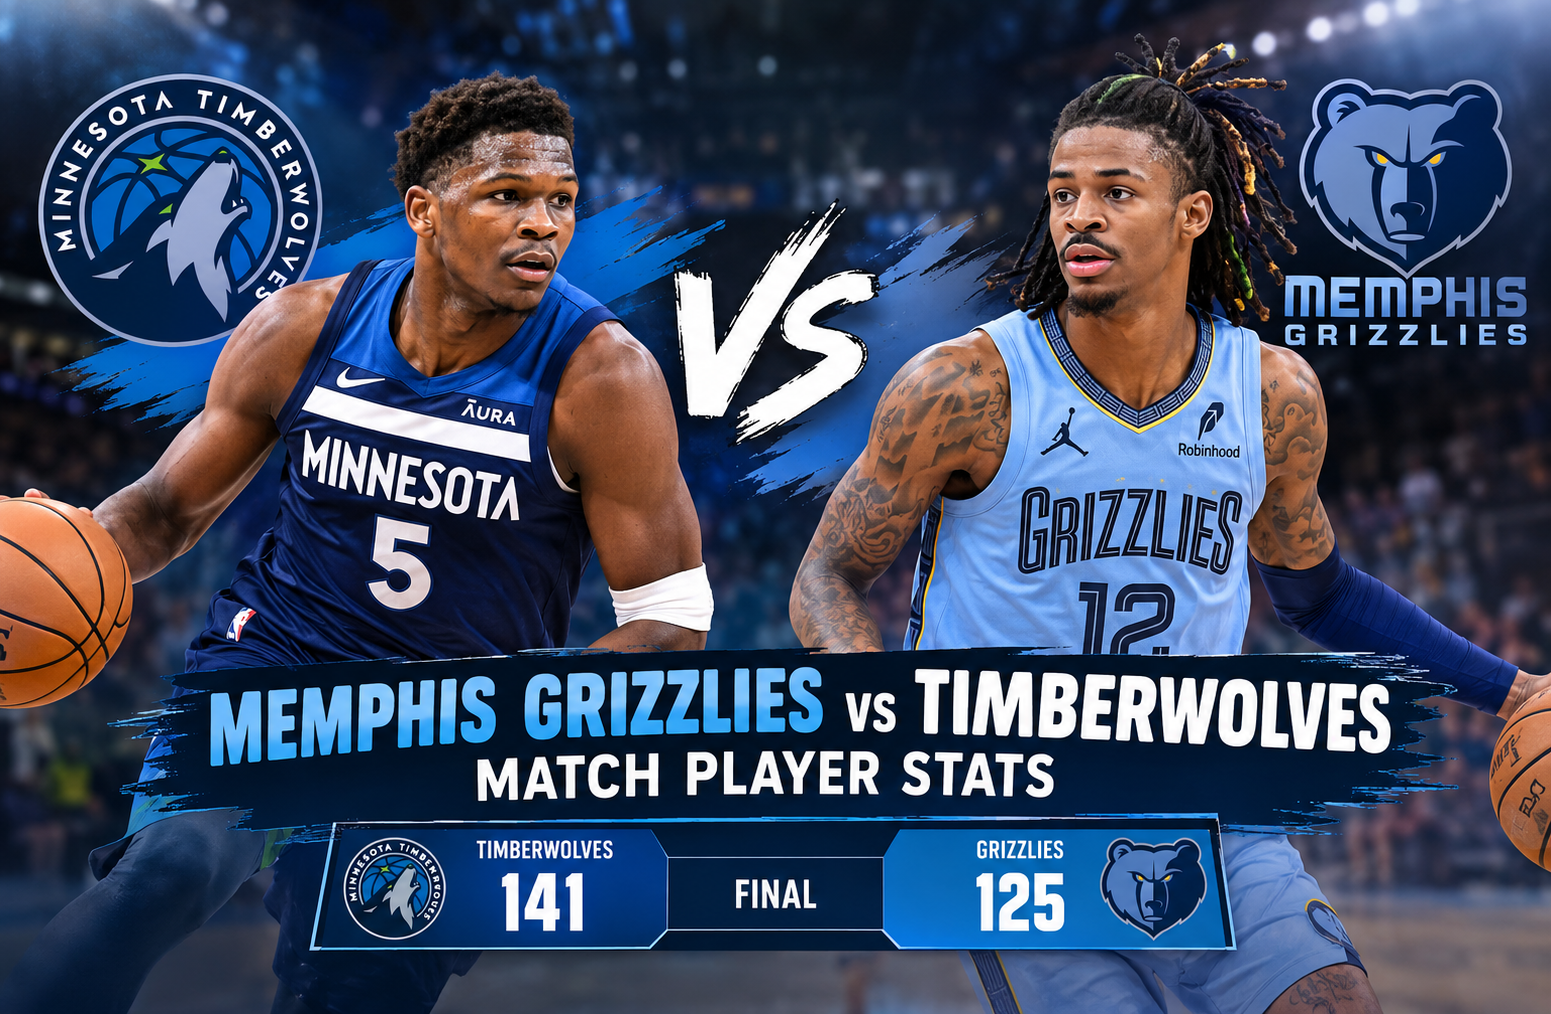
Memphis Grizzlies vs Timberwolves Match Player Stats
The memphis grizzlies vs timberwolves match player stats from this April 2025 meeting show how quickly an NBA game can change when elite scoring, efficient shooting, and a dominant third quarter come together. Minnesota defeated Memphis 141-125 at FedExForum after entering halftime down 72-67. Anthony Edwards led the Timberwolves with 44 points, while Julius Randle added 31 points and 10 rebounds. Ja Morant paced Memphis with 36 points, with Desmond Bane adding 28 points, 6 rebounds, and 9 assists.
This was more than a high-scoring regular-season game. Both teams entered with 47-33 records and were competing in a crowded Western Conference playoff race. Memphis had already won the season series 2-1, but Minnesota controlled this particular matchup by producing an extraordinary 52-point third quarter.
The result also provides a useful example of why a box score should be studied beyond the final score. Memphis actually led at halftime and shot 50% from three-point range during the game. Minnesota still won by 16 because its offensive execution became overwhelming after halftime.
Memphis Grizzlies vs Timberwolves Match Player Stats: Game Overview
The matchup took place at FedExForum in Memphis, Tennessee. The official attendance was 17,007.
| Game Detail | Result |
| Teams | Minnesota Timberwolves vs Memphis Grizzlies |
| Date | April 10, 2025 |
| Venue | FedExForum, Memphis, Tennessee |
| Attendance | 17,007 |
| Final Score | Timberwolves 141, Grizzlies 125 |
| Halftime Score | Grizzlies 72, Timberwolves 67 |
| Minnesota Record | 47-33 |
| Memphis Record | 47-33 |
| Season Series | Memphis led 2-1 |
| ESPN Game ID | 401705736 |
Minnesota finished with 141 points on 48-of-87 shooting from the field. The Timberwolves also made 20 of 44 three-point attempts and 25 of 28 free throws.
Memphis scored 125 points while shooting 46-of-89 from the field. The Grizzlies made 18 of 36 three-point attempts and 15 of 21 free throws.
The difference becomes clearer when the shooting numbers are placed side by side.
| Team | FG | FG% | 3PT | 3PT% | FT | FT% |
| Minnesota | 48-87 | 55.2% | 20-44 | 45.5% | 25-28 | 89.3% |
| Memphis | 46-89 | 51.7% | 18-36 | 50.0% | 15-21 | 71.4% |
Memphis actually had the better three-point percentage. That makes the final margin even more interesting.
Minnesota won through a combination of higher overall field-goal efficiency, superior free-throw accuracy, stronger rebounding, and a massive third-quarter scoring advantage.
Quarter-by-Quarter Breakdown
The game followed a very different pattern before and after halftime.
| Quarter | Minnesota | Memphis |
| First | 37 | 31 |
| Second | 30 | 41 |
| Third | 52 | 25 |
| Fourth | 22 | 28 |
| Final | 141 | 125 |
Minnesota opened the game with a six-point advantage after the first quarter. Memphis responded strongly in the second period, scoring 41 points and taking a five-point lead into halftime.
That lead did not survive the third quarter.
Minnesota scored 52 points in the third while holding Memphis to 25. The 27-point difference in that period completely changed the game.
The official NBA recap highlighted the scale of Minnesota’s third-quarter performance. The Timberwolves went 18-of-21 from the field during the period, including 7-of-8 from three-point range. Anthony Edwards scored 18 points in that quarter alone. (NBA.com)
Why the Third Quarter Decided the Game
The third quarter is the clearest explanation for the final result.
Minnesota did not simply score more. The Timberwolves combined accurate shooting with rapid offensive execution and strong pressure after the halftime break.
The team started the second half with a 26-5 run. That stretch transformed a five-point halftime deficit into a significant Minnesota advantage.
This is an important lesson when reading memphis grizzlies vs timberwolves match player stats. A final box score can make a 16-point victory look comfortable, but the game was much more competitive before Minnesota’s third-quarter explosion.
Memphis had enough offensive production to win the first half. The problem was sustaining that level once Minnesota increased its offensive efficiency.
Anthony Edwards Leads Minnesota With 44 Points
Anthony Edwards was the biggest individual scoring factor in the game.
He finished with 44 points while shooting 13-of-19 from the field, 7-of-11 from three-point range, and 11-of-13 from the free-throw line.
His complete line included:
| Statistic | Anthony Edwards |
| Minutes | 37:47 |
| Points | 44 |
| FG | 13-19 |
| FG% | 68.4% |
| 3PT | 7-11 |
| 3PT% | 63.6% |
| FT | 11-13 |
| FT% | 84.6% |
| Rebounds | 5 |
| Assists | 3 |
| Steals | 1 |
| Blocks | 1 |
Edwards was especially important in the third quarter.
He scored 18 points during Minnesota’s 52-point period and remained highly efficient while doing so. His seven made three-pointers were also a major part of the Timberwolves’ offensive pressure.
His performance was not simply volume scoring. Shooting 13-of-19 from the field while making seven three-pointers demonstrates how efficiently he converted his opportunities.
That efficiency mattered because Memphis was also scoring effectively. Minnesota needed a player capable of creating separation, and Edwards supplied it.
Julius Randle Provides a Major Secondary Scoring Performance
Julius Randle delivered one of his strongest contributions of the night.
The verified official box score credits Randle with 31 points, 10 rebounds, and 5 assists. This is important because the supplied data listed 13 points for Randle. The official NBA record shows 31 points.
His performance gave Minnesota another major offensive option beside Edwards.
Randle’s contribution was especially important during the third quarter. Minnesota’s offense did not depend entirely on one scorer. Edwards created major perimeter pressure, while Randle added scoring and rebounding from the frontcourt.
A 44-point performance from Edwards naturally receives most of the attention, but Randle’s 31-point, 10-rebound effort helped prevent Memphis from focusing all of its defensive attention on the Minnesota guard.
Minnesota’s Other Starters
Minnesota received meaningful contributions across the starting lineup.
Rudy Gobert finished with 13 points and 8 rebounds, while Mike Conley scored 8 points and recorded 9 assists.
Jaden McDaniels added 10 points and 5 rebounds.
| Minnesota Player | Points | Rebounds | Assists |
| Anthony Edwards | 44 | 5 | 3 |
| Julius Randle | 31 | 10 | 5 |
| Jaden McDaniels | 10 | 5 | Not specified in supplied summary |
| Rudy Gobert | 13 | 8 | 4 |
| Mike Conley | 8 | 2 | 9 |
The starting group therefore provided a balanced statistical foundation behind Edwards.
The official game record also shows Conley with 9 assists, making him an important facilitator despite scoring only 8 points.
Minnesota’s Bench Production
Minnesota’s reserves also helped maintain offensive pressure.
Naz Reid scored 14 points. Donte DiVincenzo added 10 points and 5 rebounds, while Nickeil Alexander-Walker contributed 9 points and 4 assists.
| Bench Player | Points | Rebounds | Assists |
| Naz Reid | 14 | 6 | 1 |
| Donte DiVincenzo | 10 | 5 | 4 |
| Nickeil Alexander-Walker | 9 | 5 | 2 |
The bench numbers demonstrate that Minnesota’s offense was not completely dependent on its starting five.
When a team scores 141 points, it usually requires contributions from multiple areas. Minnesota’s starters provided the headline production, but the bench helped keep the offense moving.
Naz Reid’s 14 points were particularly useful as a secondary scoring source. DiVincenzo’s shooting and rebounding also added value.
Ja Morant Leads Memphis With 36 Points
Ja Morant was Memphis’s leading scorer.
He finished with 36 points and 6 assists, providing the Grizzlies with a high-level offensive performance even though the team ultimately lost.
Morant’s scoring showed that Memphis was capable of matching Minnesota for stretches.
The problem was not a lack of individual production.
Memphis had three players score at least 23 points. Morant had 36, Desmond Bane had 28, and Jaren Jackson Jr. had 23.
That is a substantial offensive contribution from the team’s leading players.
The official NBA recap confirms Morant’s 36-point performance and notes that he also made five three-pointers.
Desmond Bane’s All-Around Contribution
Desmond Bane produced one of Memphis’s most complete stat lines.
He scored 28 points, collected 6 rebounds, and recorded 9 assists.
| Statistic | Desmond Bane |
| Points | 28 |
| Rebounds | 6 |
| Assists | 9 |
| Three-Pointers | 5 |
| Role | Major scoring and playmaking contributor |
The 9 assists are particularly important.
Bane was not simply a perimeter scorer. He also helped create offense for teammates. His combination of scoring and playmaking was one of the strongest aspects of Memphis’s offensive performance.
Yet the Grizzlies could not convert that production into a win because Minnesota’s third-quarter output was dramatically higher.
Jaren Jackson Jr. Adds 23 Points
Jaren Jackson Jr. finished with 23 points for Memphis.
His scoring gave Memphis another reliable offensive option alongside Morant and Bane.
The three leading Memphis scorers combined for 87 points:
- Ja Morant: 36
- Desmond Bane: 28
- Jaren Jackson Jr.: 23
That total represents a large portion of Memphis’s 125 points.
However, Memphis needed more consistent production during the third quarter. The team scored only 25 points during that period while Minnesota scored 52.
Memphis Bench Production
Scotty Pippen Jr. was Memphis’s leading bench scorer with 16 points.
He also recorded 3 rebounds and 4 assists.
That made him a useful secondary contributor behind the main Memphis scoring group.
The broader Memphis bench did not match Minnesota’s overall offensive momentum. Minnesota’s reserve players combined with its starters to maintain a high scoring pace, especially during the decisive third period.
Comparing the Two Starting Groups
The starting lineups provide an interesting way to understand the game.
Minnesota’s main starters were led by Edwards and Randle. Memphis relied heavily on Morant, Bane, and Jackson Jr.
The most important individual scoring comparison was:
| Player | Team | Points |
| Anthony Edwards | Minnesota | 44 |
| Ja Morant | Memphis | 36 |
| Julius Randle | Minnesota | 31 |
| Desmond Bane | Memphis | 28 |
| Jaren Jackson Jr. | Memphis | 23 |
| Rudy Gobert | Minnesota | 13 |
| Jaden McDaniels | Minnesota | 10 |
| Mike Conley | Minnesota | 8 |
| Zach Edey | Memphis | 7 |
| Vince Williams Jr. | Memphis | 5 |
The table shows how much Minnesota’s top two scorers contributed.
Edwards and Randle combined for 75 points.
Morant, Bane, and Jackson Jr. combined for 87 points.
That might initially suggest Memphis had the stronger top-end scoring group. But Minnesota’s advantage came from efficiency, supporting contributions, and the third-quarter team explosion.
Team Shooting Comparison
Shooting efficiency was one of the most important differences.
Minnesota made 48 of 87 field-goal attempts.
That produced a 55.2% field-goal percentage.
Memphis made 46 of 89 attempts for 51.7%.
The difference was not enormous in raw field-goal attempts, but Minnesota converted a higher percentage.
Three-point shooting tells a different story.
Memphis made 18 of 36 attempts for 50%.
Minnesota made 20 of 44 for 45.5%.
Therefore, Memphis was actually more accurate from three-point range.
This is an important detail because it prevents an overly simple explanation of the game.
Minnesota did not win because it had the better three-point percentage.
Instead, the Timberwolves combined high three-point volume with better overall field-goal efficiency and outstanding free-throw shooting.
Free-Throw Efficiency Favored Minnesota
The free-throw numbers created another meaningful advantage.
Minnesota went 25-of-28 from the free-throw line.
That equals 89.3%.
Memphis went 15-of-21, or 71.4%.
Minnesota therefore made 10 more free throws than Memphis while attempting only seven more.
In a 16-point game, those additional points mattered.
Free throws can sometimes be overlooked when evaluating a high-scoring game, but efficient foul shooting can provide a stable source of points when field-goal efficiency changes.
Minnesota’s 89.3% free-throw shooting was excellent.
Rebounding and Ball Movement
Minnesota also won the rebounding battle.
| Team | Rebounds | Assists | Turnovers | Steals | Blocks |
| Minnesota | 41 | 29 | 16 | 6 | 3 |
| Memphis | 33 | 26 | 15 | 5 | 2 |
Minnesota grabbed eight more rebounds.
That gave the Timberwolves additional opportunities to control possessions and finish defensive sequences.
The assist numbers also favored Minnesota by three.
Memphis had slightly fewer turnovers, with 15 compared with Minnesota’s 16, so turnover volume alone does not explain the result.
However, Memphis’s turnovers were costly.
The official NBA recap reported that Memphis’s 15 turnovers led to 23 Minnesota points.
That is a major possession-value difference.
Points From Turnovers Became Important
Minnesota scored 23 points off Memphis turnovers.
Memphis scored 17 points off Minnesota turnovers.
The six-point difference in points created from turnovers was another contributor to the final margin.
This is one reason box-score analysis should go beyond field goals and individual scoring.
A team can have excellent shooting numbers and still lose if its opponent creates more efficient possessions from mistakes.
Memphis shot 50% from three, but Minnesota’s ability to turn Memphis turnovers into points helped offset that advantage.
The 52-Point Third Quarter
The most remarkable statistic from the entire game was Minnesota’s 52-point third quarter.
Minnesota scored:
- 37 points in the first quarter
- 30 points in the second quarter
- 52 points in the third quarter
- 22 points in the fourth quarter
The 52-point third quarter was the defining moment.
Minnesota shot 18-of-21 from the field during that period.
That equals approximately 85.7% shooting.
The Timberwolves also made seven of eight three-point attempts.
This was not a normal scoring burst.
It was an exceptional combination of shot-making and possession efficiency.
The official NBA recap described the quarter as a franchise-record scoring period for Minnesota and noted that the Timberwolves entered the fourth quarter with a 119-97 lead.
How Minnesota Turned a Five-Point Deficit Into a 22-Point Lead
At halftime, Memphis led 72-67.
That meant Minnesota needed to overcome five points.
Instead, the Timberwolves won the third quarter 52-25.
The resulting 27-point advantage in the period transformed the game.
After three quarters:
Minnesota: 119
Memphis: 97
The fourth quarter became largely about managing the existing advantage.
Memphis did outscore Minnesota 28-22 in the final period, but that six-point difference was nowhere near enough to overcome the third-quarter damage.
This is why the final score of 141-125 should be read alongside the quarter-by-quarter numbers.
Memphis’s First-Half Offense Was Effective
Memphis scored 72 points before halftime.
That is a strong offensive output.
The Grizzlies also shot 13-of-19 from three-point range during the first half, according to the official NBA recap.
That efficiency explains why Memphis was able to build a five-point halftime lead despite Minnesota’s 37-point first quarter.
The problem came after the break.
Minnesota changed the game through a combination of pressure, shooting, and pace.
The Timberwolves did not need Memphis to suddenly become a poor offensive team. They simply produced an offensive level that Memphis could not match.
What the Player Stats Say About Each Team
The memphis grizzlies vs timberwolves match player stats provide several useful conclusions.
First, both teams had multiple high-level offensive contributors.
Minnesota had Edwards and Randle.
Memphis had Morant, Bane, and Jackson Jr.
Second, individual scoring was not enough to determine the result.
Memphis had three players score 23 or more points, yet the Grizzlies lost by 16.
Third, Minnesota’s efficiency was more consistent across the entire team.
The Timberwolves shot 55.2% overall and 89.3% at the free-throw line.
Fourth, the third quarter completely changed the statistical picture.
Minnesota’s 52 points in that period were the central event of the game.
Key Statistical Takeaways
Several numbers stand out immediately from this matchup.
1. Anthony Edwards scored 44 points
Edwards was the game’s leading scorer and shot 68.4% from the field.
2. Julius Randle recorded 31 points and 10 rebounds
Randle provided Minnesota with a second major scoring option and a double-double.
3. Ja Morant scored 36 points
Morant led Memphis and kept the Grizzlies competitive offensively.
4. Desmond Bane recorded 28 points and 9 assists
Bane contributed as both a scorer and facilitator.
5. Minnesota scored 52 points in the third
This was the decisive team statistic.
6. Minnesota shot 55.2% from the field
The Timberwolves converted 48 of 87 field-goal attempts.
7. Memphis shot 50% from three
The Grizzlies made 18 of 36 three-point attempts.
8. Minnesota made 25 free throws
The Timberwolves converted 25 of 28 attempts.
9. Minnesota outrebounded Memphis 41-33
The eight-rebound advantage gave Minnesota an additional statistical edge.
10. Memphis committed 15 turnovers
Those turnovers contributed to 23 Minnesota points.
Why the Final Score Can Be Misleading Without Context
A final score tells you who won and by how much.
It does not tell you how the game developed.
That is especially important here.
Memphis led at halftime.
The Grizzlies also shot 50% from three for the game.
Morant scored 36.
Bane scored 28 and added 9 assists.
Jackson scored 23.
Those numbers could describe a competitive winning performance in many NBA games.
Instead, Minnesota produced one of its most explosive quarters of the season and created an advantage that Memphis could not recover from.
The game therefore illustrates why player statistics should be analyzed alongside quarter scores and team efficiency.
Practical Way to Analyze This Box Score
If you are reviewing a matchup like this for fantasy basketball, historical research, sports analysis, or statistical content, start with five areas.
Start With the Leading Scorers
Identify the players who generated the largest scoring totals.
Here, Edwards and Morant immediately stand out.
Check Efficiency
Next, compare shooting percentages.
Edwards scored 44 points while shooting 13-of-19.
That makes his scoring output even more significant.
Review Secondary Production
Look at rebounds and assists.
Randle’s 10 rebounds and Bane’s 9 assists provide important context that raw scoring totals do not show.
Study the Team Splits
Quarter scores often reveal momentum changes.
The 52-25 third-quarter split is more informative than simply saying Minnesota won by 16.
Check Turnovers and Rebounding
These statistics explain how teams generate additional possessions and scoring opportunities.
Minnesota’s eight-rebound advantage and Memphis’s 15 turnovers both contributed to the final result.
Official Game Context
The game was played during the final portion of the 2024-25 regular season.
Both Minnesota and Memphis entered with 47-33 records.
The season series had already favored Memphis 2-1, so this individual result did not erase Memphis’s overall series advantage.
However, Minnesota’s victory was significant because both teams were competing in a tightly packed Western Conference race.
The official NBA recap reported that Memphis still held the two-team tiebreaker after winning the season series.
For readers researching this matchup historically, that distinction matters.
A single-game victory and a season-series result are two different statistical facts.
Common Mistakes When Reading These Player Stats
Looking Only at the Final Score
The 141-125 score tells you Minnesota won comfortably.
It does not show that Memphis led by five at halftime.
Ignoring Shooting Efficiency
A player scoring 30 points is useful information, but knowing how efficiently those points were scored adds much more context.
Treating Three-Point Percentage as the Whole Story
Memphis shot better from three, but Minnesota still won.
The Timberwolves were more efficient overall and made far more free throws.
Ignoring Assists
Bane’s 9 assists and Conley’s 9 assists demonstrate that both teams had important playmaking contributions.
Missing the Third-Quarter Swing
The 52-25 third-quarter score is arguably the single most important contextual statistic in the game.
Frequently Asked Questions
Who scored the most points in the Timberwolves vs Grizzlies game?
Anthony Edwards led all scorers with 44 points for Minnesota.
How many points did Ja Morant score against Minnesota?
Ja Morant scored 36 points for Memphis.
How many points did Julius Randle score?
Julius Randle scored 31 points and collected 10 rebounds for Minnesota.
What was the final score between Minnesota and Memphis?
The Timberwolves defeated the Grizzlies 141-125 at FedExForum.
Which team had the better three-point percentage?
Memphis shot 50% from three-point range, making 18 of 36 attempts. Minnesota shot 45.5%, making 20 of 44.
Why did Minnesota win the game?
The biggest difference was Minnesota’s third-quarter performance. The Timberwolves scored 52 points while Memphis scored 25 in that period. Minnesota also shot 55.2% overall, made 89.3% of its free throws, outrebounded Memphis 41-33, and scored 23 points off Memphis turnovers.
Conclusion
The memphis grizzlies vs timberwolves match player stats tell the story of a game that changed dramatically after halftime.
Minnesota entered the break trailing 72-67, but the Timberwolves responded with a 52-point third quarter. Anthony Edwards produced 44 points on highly efficient shooting, while Julius Randle added 31 points and 10 rebounds. Rudy Gobert, Mike Conley, Jaden McDaniels, Naz Reid, Donte DiVincenzo, and Nickeil Alexander-Walker also contributed in different areas.
Memphis received strong performances from Ja Morant, Desmond Bane, and Jaren Jackson Jr. Morant scored 36 points, Bane recorded 28 points and 9 assists, and Jackson added 23 points. Despite that production, Memphis could not withstand Minnesota’s third-quarter surge.
The shooting numbers add another layer. Memphis made half of its three-point attempts, but Minnesota was more efficient from the field overall and much more accurate at the free-throw line. The Timberwolves also held an eight-rebound advantage and converted Memphis turnovers into 23 points.
For anyone studying this matchup, the most useful lesson is that individual scoring totals should always be viewed alongside efficiency, rebounding, assists, turnovers, and quarter-by-quarter performance. In this game, those supporting statistics explain why a five-point halftime deficit became a 16-point Minnesota victory.