Utah Jazz vs LA Clippers Match Player Stats
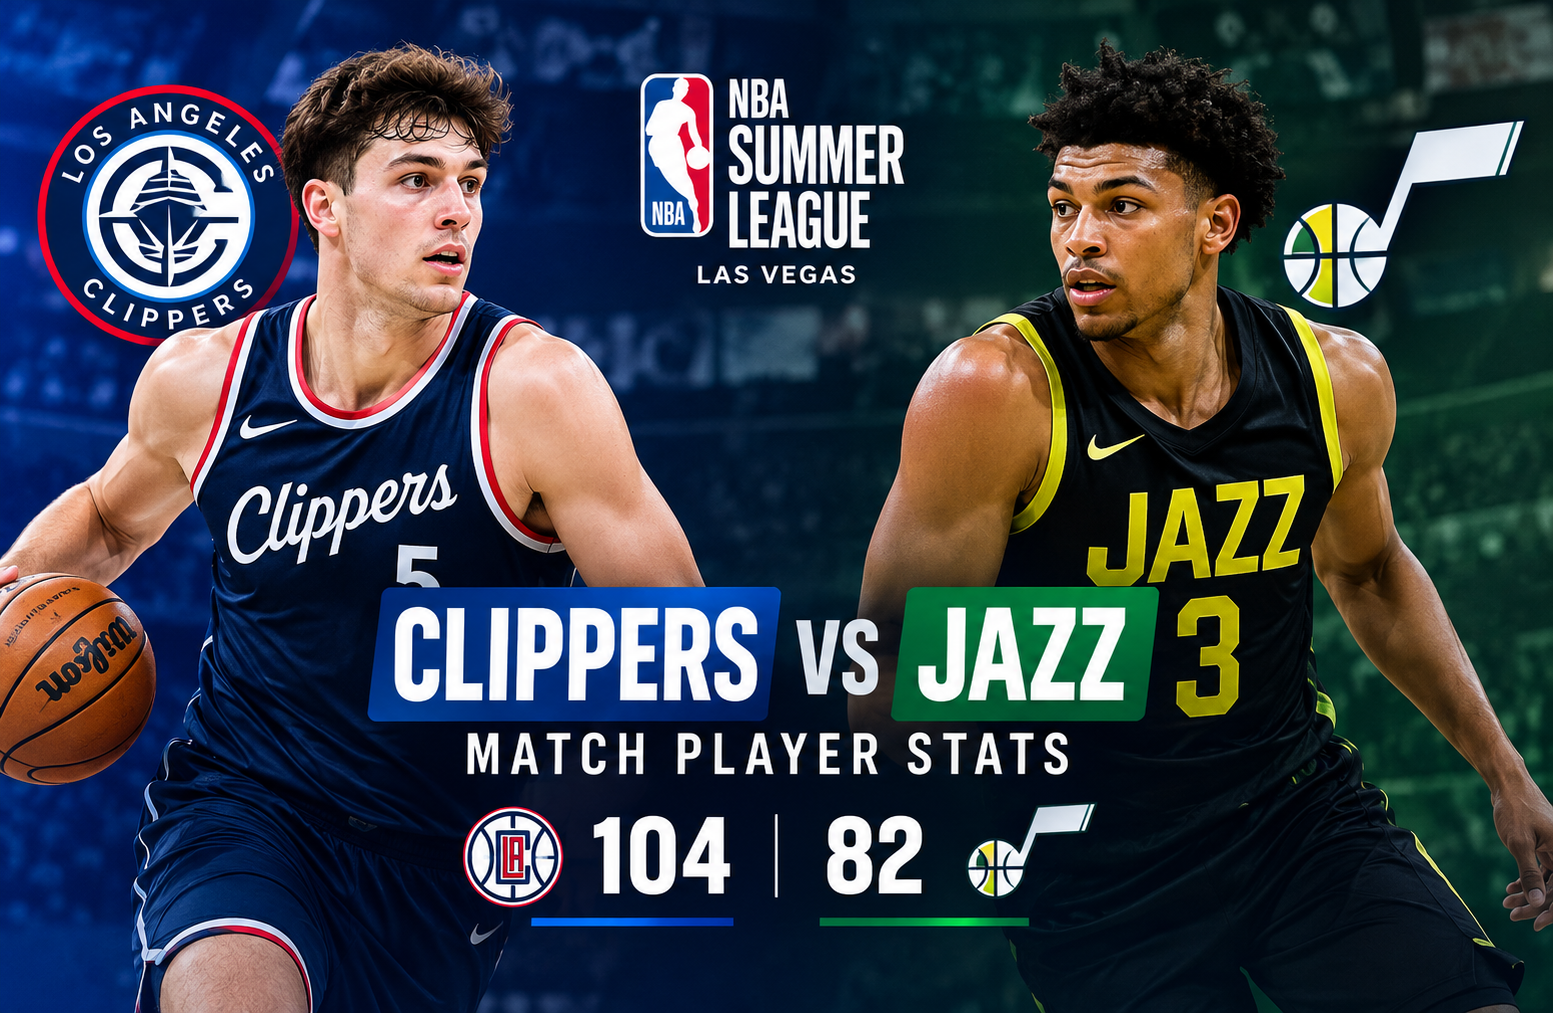
The Utah Jazz vs LA Clippers match player stats from the 2026 NBA Summer League tell a much deeper story than the final score alone. Los Angeles defeated Utah 104-82 in Las Vegas, using a dominant third quarter to turn a close game into a comfortable victory. Keaton Wagler and Darryn Peterson both finished with 23 points, but their individual performances came in very different game contexts.
This matchup was especially interesting because it featured two of the highest selected players from the 2026 NBA Draft. Utah’s Darryn Peterson was selected No. 2 overall, while Los Angeles selected Keaton Wagler at No. 5. Their meeting offered an early opportunity to compare two young guards against competitive Summer League opposition.
There is also an important date clarification. The official NBA record lists this game as July 12, 2026 in Las Vegas, with the game information page also showing July 13 in its game information because of time-zone and page presentation differences. The official result is Clippers 104, Jazz 82. The records immediately after this game were Clippers 1-1 and Jazz 0-2, not 3-2 and 2-3.
Utah Jazz vs LA Clippers Match Player Stats
The Clippers controlled the game through a combination of three-point shooting, offensive rebounding and pressure after turnovers. The Jazz stayed competitive through the first half, but Los Angeles produced a huge third-quarter performance that completely changed the game.
Final score and quarter-by-quarter breakdown
| Quarter | LA Clippers | Utah Jazz |
| 1st | 19 | 13 |
| 2nd | 21 | 25 |
| 3rd | 42 | 18 |
| 4th | 22 | 26 |
| Final | 104 | 82 |
Utah actually won the second quarter 25-21. That made the game much closer at halftime than the final margin suggests.
The decisive moment arrived after halftime.
Los Angeles scored 42 points in the third quarter, while Utah managed only 18. That 24-point difference effectively settled the contest. The Clippers went on a 42-12 run during the third quarter after Utah briefly held a 44-40 advantage.
The final 22-point margin therefore does not accurately describe how competitive the opening half was. It mainly reflects how quickly Los Angeles capitalized on its third-quarter opportunities.
Keaton Wagler Leads the Clippers
Keaton Wagler was the headline performer for Los Angeles.
The No. 5 overall pick finished with:
- 23 points
- 6-for-16 field goals
- 4-for-7 from three-point range
- 3-for-4 from the free-throw line
- 4 assists
- 1 rebound
- 1 steal
- 3 turnovers
- 28 minutes
His four made three-pointers were particularly important. Wagler gave the Clippers an outside scoring threat that helped stretch Utah’s defense.
The most impressive part of his performance was the third quarter.
Wagler scored 18 points in the third quarter, helping Los Angeles transform a competitive game into a blowout.
His overall field-goal percentage was not spectacular at 37.5 percent. However, his three-point shooting was much stronger at 57.1 percent.
That difference matters.
A player can have an average overall shooting percentage while still creating major offensive value when his outside shooting is efficient. Wagler’s four three-pointers helped Los Angeles build separation during the most important stretch of the game.
Darryn Peterson Matches the Scoring Total
Darryn Peterson gave Utah an impressive individual scoring performance despite the team’s defeat.
He finished with:
- 23 points
- 6-for-18 field goals
- 1-for-3 from three-point range
- 5 assists
- 2 rebounds
- 2 steals
- 2 blocks
- 2 turnovers
- 26 minutes
Peterson’s 23 points matched Wagler’s scoring total. The difference was that Peterson had a broader defensive and playmaking contribution, while Wagler’s biggest influence came from his scoring explosion.
Peterson’s 23 points, five assists, two steals and two blocks showed why he was such a highly regarded prospect.
His 6-for-18 shooting translated to 33.3 percent from the field. He also made only one of his three attempts from beyond the arc.
That shooting efficiency was one of the major differences between the two teams.
Peterson still showed why he was such a highly regarded prospect. His five assists demonstrated his ability to contribute as a creator rather than simply functioning as a scorer.
His two steals and two blocks also showed defensive activity that does not appear in the basic scoring column.
Clippers Team Shooting Stats
Los Angeles finished the game with:
- 35-for-81 field goals
- 43.2 percent from the field
- 15-for-33 three-pointers
- 45.5 percent from three-point range
- 10-for-11 free throws
- 90.9 percent from the free-throw line
These numbers explain why the Clippers were able to reach 104 points.
The most significant figure is the three-point shooting.
Los Angeles attempted 33 three-pointers and made 15. That means nearly 41 percent of its field-goal attempts came from outside the arc.
The Clippers did not simply shoot a large volume of threes. They converted them at an excellent rate.
That combination of volume and efficiency put tremendous pressure on Utah’s defense.
Utah Jazz Team Shooting Stats
Utah finished with:
- 27-for-63 field goals
- 42.9 percent from the field
- 8-for-17 three-pointers
- 47.1 percent from three-point range
- 14-for-23 free throws
- 60.9 percent from the free-throw line
Interestingly, Utah actually had the better three-point percentage.
The Jazz shot 47.1 percent from three compared with 45.5 percent for Los Angeles.
So why did Utah lose by 22?
The answer is volume and overall offensive efficiency.
The Clippers attempted 18 more field goals than Utah. Los Angeles also generated more possessions through offensive rebounds and turnovers.
This is an important lesson when evaluating basketball statistics.
A higher shooting percentage does not automatically produce a win. Teams also need enough quality possessions to turn efficiency into points.
The Third Quarter Decided Everything
The most important statistic in this game was arguably the third-quarter score.
Clippers 42, Jazz 18.
Utah entered the third quarter still within striking distance. The Jazz even moved ahead 44-40 early in the period.
Then the Clippers completely changed the game.
Los Angeles increased its defensive pressure, generated transition opportunities and found consistent perimeter scoring. The result was a 42-12 run that gave the Clippers control.
The 42-point quarter was also a major contrast to the Clippers’ first-half offense.
Los Angeles scored only 40 points across the first two quarters.
It then scored 42 in one quarter.
That shows how quickly a Summer League game can change when young players gain confidence and begin attacking open opportunities.
For Utah, the third quarter highlighted a major problem.
The team could not maintain the same offensive rhythm after halftime, while its defense struggled to contain Los Angeles.
Rebounding Comparison
Rebounding was another important area.
The Clippers held a 49-43 advantage in total rebounds.
The Clippers also held a strong advantage in second-chance scoring.
Los Angeles produced 21 second-chance points, compared with only 8 for Utah.
That 13-point difference was extremely valuable.
Offensive rebounds often receive less attention than scoring totals, but they can completely change a game. When a team misses a shot and immediately gets another possession, the defense has already done part of its job but cannot finish the possession.
Los Angeles repeatedly created those extra opportunities.
The Clippers also held an advantage in offensive rebounds according to the official game data.
That allowed them to maintain pressure even when their initial shots did not fall.
Norchad Omier’s rebounding impact
Norchad Omier led the Clippers with 10 rebounds.
His work on the glass was important because it helped Los Angeles maintain possession and create additional scoring opportunities.
Baba Miller also contributed 15 points and five rebounds, giving the Clippers another productive frontcourt option.
For Utah, Jonas Aidoo recorded 10 rebounds.
Aidoo’s rebounding was one of the positive individual aspects of Utah’s performance.
However, the team-wide rebounding deficit meant his personal contribution could not completely solve the problem.
Assists and Ball Movement
The Clippers finished with 22 assists, while Utah recorded 19.
That three-assist difference was not enormous, but it reflected a broader offensive advantage for Los Angeles.
Wagler finished with four assists.
Cam Christie and other Clippers players also helped move the ball and create scoring opportunities.
For Utah, Peterson recorded five assists, tying him for the team lead.
Orlando Robinson also recorded five assists.
Trey Alexander was another Jazz player who contributed five assists according to the official box-score data.
This shows that Utah did not rely exclusively on Peterson to create offense.
The problem was converting those opportunities into efficient scoring.
Turnovers Created a Major Difference
Turnovers were another decisive factor.
Los Angeles committed 11 turnovers.
Utah committed 14.
The three-turnover difference may initially look small.
However, the points generated from those mistakes were much more significant.
The Clippers scored 23 points off turnovers, while Utah scored only 8.
That created a 15-point advantage for Los Angeles in this category.
This is one of the clearest explanations for the final result.
Utah did not lose simply because its players could not score.
The Jazz lost because Los Angeles repeatedly converted defensive pressure into immediate offense.
Free-Throw Difference
The Clippers also had a major advantage at the free-throw line.
Los Angeles made 10 of 11 attempts.
Utah made 14 of 23.
Utah attempted more free throws but converted them at a much lower rate.
The Clippers finished at approximately 91 percent from the line.
Utah finished at approximately 61 percent.
That represents a difference of nearly 30 percentage points.
In a closer game, missed free throws can become extremely costly.
Although the free-throw difference was not as influential as the third quarter, it still contributed to the final margin.
Clippers Starting Lineup Performance
The Clippers started:
- Keaton Wagler
- Baba Miller
- Norchad Omier
- Cam Christie
- Kobe Sanders
The starting group provided a mixture of scoring, size, rebounding and perimeter play.
Wagler was the primary scoring headline.
Miller added 15 points.
Omier contributed strongly on the boards.
Kobe Sanders provided additional ball-handling and perimeter responsibilities.
Cam Christie also contributed as a two-way perimeter player.
This balance helped the Clippers avoid becoming dependent on one scorer.
Jazz Starting Lineup Performance
Utah started:
- Darryn Peterson
- Jonas Aidoo
- Orlando Robinson
- Cody Williams
- Ace Bailey
Peterson was the primary offensive creator.
Aidoo provided interior size and rebounding.
Robinson also contributed as a passer and rebounder.
Cody Williams and Ace Bailey added additional athleticism and scoring potential around the core group.
The starting lineup had enough talent to keep the game competitive early.
However, Utah’s second-half execution did not match Los Angeles.
Bench Production Matters
Summer League games often become unpredictable because of substitutions.
Young players are competing for minutes, roles and roster opportunities. A strong bench can therefore become a major advantage.
Los Angeles received important production from its reserves.
Nick Martinelli scored 14 points and added six rebounds and two assists. He was the Clippers’ leading bench scorer.
That type of contribution reduced the pressure on Wagler.
Instead of requiring one player to produce nearly every possession, Los Angeles had multiple players capable of contributing.
Utah also received useful bench scoring from Blake Hinson, who scored 12 points.
However, Utah did not receive enough overall offensive consistency to withstand Los Angeles’ third-quarter explosion.
Comparing Wagler and Peterson
The individual comparison between Wagler and Peterson was one of the biggest attractions of the game.
| Statistic | Keaton Wagler | Darryn Peterson |
| Points | 23 | 23 |
| Field Goals | 6/16 | 6/18 |
| 3PT | 4/7 | 1/3 |
| Assists | 4 | 5 |
| Rebounds | 1 | 2 |
| Steals | 1 | 2 |
| Blocks | 0 | 2 |
| Turnovers | 3 | 2 |
| Minutes | 28 | 26 |
Peterson had the better defensive statistical line.
Wagler had the greater scoring impact.
The biggest distinction was three-point shooting.
Wagler made four three-pointers.
Peterson made one.
That five-point difference in made threes does not sound enormous, but Wagler’s perimeter shooting came during a period when Los Angeles was rapidly building its lead.
Peterson’s five assists also showed strong playmaking.
Therefore, the matchup should not be viewed simply as a contest between two 23-point scorers.
They produced their points in different ways.
What the Stats Say About Wagler
Wagler’s performance suggested several encouraging traits.
First, he showed confidence from outside.
Going 4-for-7 from three is an efficient shooting performance.
Second, he demonstrated that he could take over a quarter.
Scoring 18 points in the third quarter is more meaningful than simply looking at the final 23-point total.
Third, he contributed four assists.
That indicates that his offensive role was not limited to shooting.
However, the 6-for-16 field-goal performance also shows room for improvement.
A 37.5 percent overall shooting percentage is not dominant.
His three-point accuracy carried much of his scoring efficiency.
That distinction is important when evaluating a young player’s Summer League performance.
What the Stats Say About Peterson
Peterson’s performance was more balanced.
He scored 23 points while adding five assists, two steals and two blocks.
His 6-for-18 shooting was inefficient, but he still found ways to influence the game.
His defensive activity stood out.
Two steals and two blocks demonstrate that he was involved away from the scoring column.
His five assists also suggest that he can create opportunities for teammates.
The biggest area for improvement from this particular game was shooting efficiency.
A 33.3 percent field-goal percentage makes it difficult to maintain offensive pressure against a team that is shooting efficiently from outside.
Why the Clippers Won
The simplest explanation is that Los Angeles won the possession battle.
The Clippers:
- Created more shot attempts.
- Rebounded better as a team.
- Generated more second-chance points.
- Capitalized heavily on turnovers.
- Shot extremely well from three.
- Dominated the third quarter.
- Converted free throws at a very high rate.
These factors worked together.
The Clippers did not rely on one statistical category.
They created advantages across several areas.
That is why the final 104-82 result was so decisive.
Why the Jazz Lost
Utah had several positive individual performances.
Peterson scored 23 points.
Aidoo grabbed 10 rebounds.
Peterson and other Jazz players provided playmaking.
Utah even shot 47.1 percent from three, which was better than Los Angeles.
But the Jazz struggled to turn those positive numbers into sustained offensive production.
The third quarter was the central problem.
A team cannot easily recover from being outscored 42-18 in one quarter.
The Jazz also gave up 23 points off turnovers and lost the second-chance scoring battle 21-8.
Those possession-related problems outweighed the team’s better three-point percentage.
A Deeper Look at the 22-Point Margin
The 22-point final margin can be misleading if viewed without context.
Utah did not spend the entire game being 20-plus points worse.
The Jazz won the second quarter by four points.
The teams were competitive early in the third quarter.
Then Los Angeles exploded.
This is why quarter-by-quarter analysis is so useful.
If someone only sees “Clippers 104, Jazz 82,” they may assume Los Angeles dominated from the opening tip.
The actual game was different.
The Clippers’ dominance was concentrated in one extraordinary stretch.
That distinction is important when evaluating Summer League players.
Young teams can experience dramatic swings in confidence, shooting and defensive execution.
What This Game Reveals About Summer League Basketball
Summer League statistics should be interpreted carefully.
A single game does not establish whether a young player will become an NBA star.
Instead, the value comes from identifying specific skills.
For Wagler, the most interesting signals were his three-point shooting, shot creation and ability to produce a major scoring burst.
For Peterson, the interesting signals were his passing, defensive activity and ability to score despite inefficient shooting.
The same principle applies to team statistics.
A Summer League team’s record is less important than how players respond to different situations.
Coaches and scouts can learn from:
- Decision-making under pressure
- Defensive positioning
- Shooting consistency
- Rebounding effort
- Passing reads
- Turnover control
- Ability to recover after mistakes
- Performance against physical defenders
These details often matter more than the final score alone.
Official Box Score and Game Information
For readers who want to verify the numbers, the official NBA game page provides the game’s final score, quarter scores, player information and other box-score details.
The NBA’s official recap also confirms the 104-82 result and highlights the 42-point third quarter that decided the contest.
Frequently Asked Questions
Who was the top scorer in the Jazz vs Clippers game?
Keaton Wagler and Darryn Peterson both scored 23 points. Wagler scored his 23 on 6-for-16 shooting, while Peterson finished 6-for-18.
What was the final score between the Utah Jazz and LA Clippers?
The LA Clippers defeated the Utah Jazz 104-82 in the 2026 NBA Summer League in Las Vegas.
Who had the most rebounds for the Clippers?
Norchad Omier led the Clippers with 10 rebounds.
Who had the most rebounds for the Jazz?
Jonas Aidoo recorded 10 rebounds for Utah.
How many points did Darryn Peterson score?
Darryn Peterson scored 23 points. He also recorded five assists, two rebounds, two steals and two blocks.
How many points did Keaton Wagler score?
Keaton Wagler scored 23 points. He also made four three-pointers and recorded four assists.
Conclusion
The Utah Jazz vs LA Clippers match player stats show that this was not simply a story about two first-round picks scoring 23 points each.
Keaton Wagler produced the game’s biggest offensive explosion, particularly during the third quarter. His four three-pointers and 18 points in that period helped Los Angeles turn a competitive contest into a comfortable victory.
Darryn Peterson matched Wagler’s 23 points and offered valuable playmaking and defensive contributions. His five assists, two steals and two blocks showed that his impact extended beyond scoring.
For the Clippers, the decisive advantages came from possessions and momentum. Los Angeles created more second-chance opportunities, scored heavily from turnovers and dominated the third quarter.
The final 104-82 score therefore reflects much more than shooting percentages. It reflects how effectively the Clippers converted opportunities when the game began to shift.
For anyone analyzing this matchup, the biggest statistical takeaway is clear: the third quarter was the turning point, while turnovers, offensive rebounds and perimeter scoring created the foundation for the Clippers’ victory.