Toronto Raptors vs Cleveland Cavaliers Match Player Stats
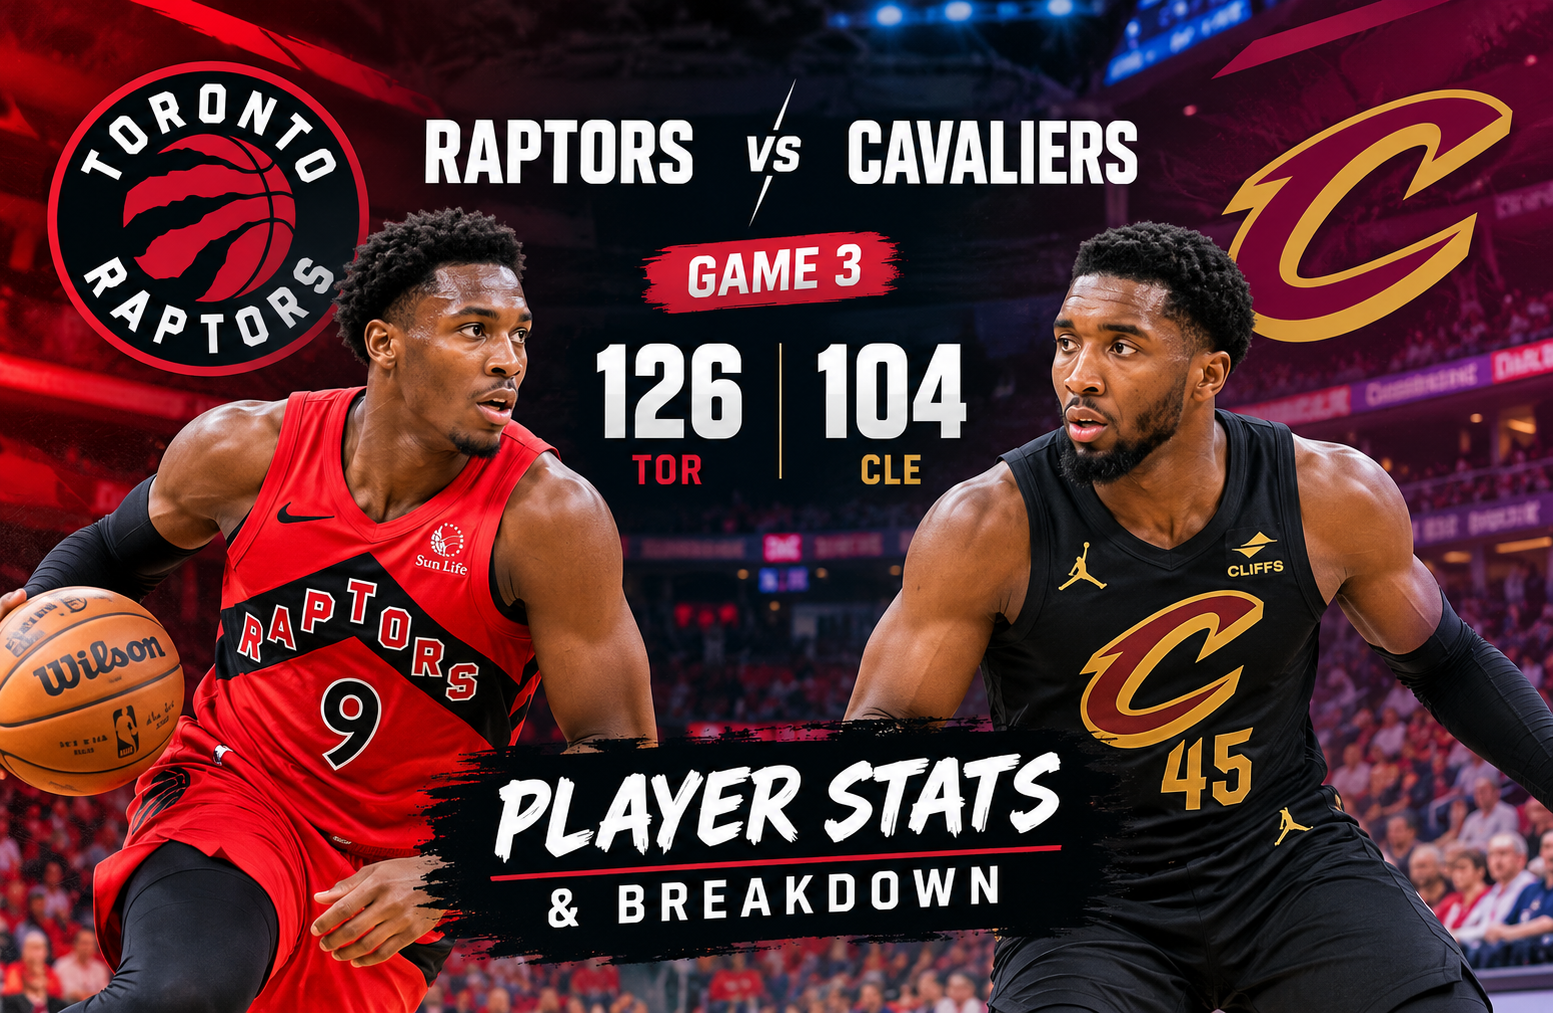
The toronto raptors vs cleveland cavaliers match player stats from Game 3 tell a much clearer story than the final score alone. Toronto defeated Cleveland 126-104 at Scotiabank Arena on April 24, 2026, cutting the series deficit to 2-1. The Raptors did not simply win through one hot scorer. They combined elite shooting, strong ball movement, disruptive defense, and a remarkable 43-point fourth quarter to turn a competitive game into a 22-point victory.
For readers trying to understand what actually happened on the court, the box score offers several important clues. Toronto shot 57% from the field and an exceptional 61% from three-point range, while Cleveland finished at 44% overall and 31% from deep. Toronto also committed only 11 turnovers compared with Cleveland’s 20. Those differences help explain why players such as RJ Barrett and Scottie Barnes were able to produce 33 points each while the Raptors’ supporting cast also made a major impact.
This breakdown examines the individual performances, team statistics, turning points, and tactical lessons behind Game 3 without reducing the contest to a simple list of numbers.
Toronto Raptors vs Cleveland Cavaliers Match Player Stats at a Glance
The matchup was part of the NBA Eastern Conference first round, with Game 3 taking place in Toronto.
| Category | Cleveland Cavaliers | Toronto Raptors |
| Final Score | 104 | 126 |
| Q1 | 25 | 31 |
| Q2 | 29 | 23 |
| Q3 | 27 | 29 |
| Q4 | 23 | 43 |
| Field Goals | 36-81 | 50-87 |
| Field Goal Percentage | 44% | 57% |
| Three-Pointers | 14-45 | 14-23 |
| Three-Point Percentage | 31% | 61% |
| Free Throws | 18-23 | 12-21 |
| Rebounds | 42 | 35 |
| Assists | 23 | 29 |
| Turnovers | 20 | 11 |
| Steals | 7 | 11 |
| Blocks | 6 | 4 |
The most striking statistic is Toronto’s three-point shooting. Both teams made 14 threes, but Toronto needed only 23 attempts to reach that number, while Cleveland attempted 45.
That difference is enormous.
Toronto converted 61% of its attempts from beyond the arc, while Cleveland made 31%. In a playoff environment, that type of shooting efficiency can completely change the shape of a game.
How the Game Unfolded Quarter by Quarter
First Quarter: Toronto Establishes Early Control
Toronto opened the game with 31 points compared with Cleveland’s 25.
A six-point first-quarter advantage is not decisive by itself, especially in a playoff series. What mattered was that Toronto immediately showed the offensive efficiency that would eventually define the game.
The Raptors were able to score efficiently while maintaining enough defensive pressure to prevent Cleveland from establishing a comfortable rhythm.
Second Quarter: Cleveland Responds
The Cavaliers answered in the second period, outscoring Toronto 29-23.
At halftime, the early Toronto advantage had effectively disappeared. Cleveland’s response demonstrated why a playoff series cannot be judged from the opening quarter alone.
The Cavaliers were still within striking distance, and their superior rebounding numbers eventually reflected their ability to compete physically.
Third Quarter: Toronto Regains Momentum
Toronto scored 29 points in the third quarter while Cleveland managed 27.
The Raptors did not produce a massive third-quarter swing, but they regained some control.
That set the stage for the biggest difference of the entire contest.
Fourth Quarter: The Decisive 43-23 Run
The fourth quarter was where the game truly separated.
Toronto scored 43 points in the final period, compared with only 23 from Cleveland.
That 20-point fourth-quarter advantage transformed a close playoff contest into a 126-104 Toronto victory.
This is one of the most important details in the box score. Looking only at the final margin can make the game appear one-sided from beginning to end. It was not.
Toronto’s dominance arrived most forcefully late.
The Raptors finished with 126 points because they continued converting at a remarkably efficient rate when the game reached its most important stage.
RJ Barrett’s 33-Point Performance
RJ Barrett was one of Toronto’s two leading scorers, finishing with:
- 33 points
- 5 rebounds
- 5 assists
- 2 steals
- 1 block
- +24 plus/minus
The 33 points are obviously significant, but the rest of the line is what makes the performance particularly valuable.
Barrett was not only scoring. He contributed across multiple areas while finishing with a team-leading plus/minus of +24 among the players listed in the supplied statistics.
A five-assist contribution also shows that his offensive influence was not restricted to individual shot creation.
The two steals and one block add another layer. Toronto’s victory involved defensive activity throughout the lineup, and Barrett contributed to that pressure.
His +24 indicates that Toronto was 24 points better than Cleveland during his minutes on the court.
Scottie Barnes Controls the Game
Scottie Barnes produced perhaps the most complete individual performance of the contest.
His numbers were:
- 33 points
- 5 rebounds
- 11 assists
- 1 turnover
- 1 steal
- 1 block
- +23 plus/minus
The combination of 33 points and 11 assists immediately stands out.
But the statistic that deserves additional attention is the single turnover.
An 11-assist, one-turnover performance indicates outstanding ball security while carrying a major offensive responsibility.
Barnes was therefore affecting the game in several ways at once. He was scoring, creating opportunities for teammates, defending, and protecting possessions.
From a basketball-analysis perspective, this is more informative than simply saying he scored 33 points.
Toronto did not need Barnes to choose between being a scorer and a facilitator. He effectively did both.
Jamison Battle Provides a Major Offensive Boost
Jamison Battle finished with:
- 22 points
- 8 rebounds
- 2 assists
- 1 steal
- 1 block
- +21
His 22 points were particularly important because Toronto’s offense was not dependent exclusively on its two 33-point scorers.
Battle’s eight rebounds also helped Toronto compensate for Cleveland’s advantage on the glass.
A team that shoots exceptionally well from three can sometimes become vulnerable on missed shots. Battle’s rebounding contribution helped reduce that concern.
His +21 plus/minus further emphasizes how productive his minutes were.
Trayce Jackson-Davis Makes a Two-Way Contribution
Trayce Jackson-Davis recorded:
- 14 points
- 8 rebounds
- 2 assists
- 1 steal
- 1 block
- +21
This was one of the strongest supporting performances on Toronto’s side.
His eight rebounds tied Battle for an important contribution on the glass, while his 14 points gave Toronto another reliable source of offense.
The defensive statistics are also notable.
Jackson-Davis recorded both a steal and a block, reinforcing the overall picture of Toronto’s active defense.
When multiple players contribute on both ends, it becomes much harder for an opponent to target a single weakness.
Brandon Ingram’s Efficient Supporting Line
Brandon Ingram finished with:
- 12 points
- 3 rebounds
- 2 assists
- 2 steals
- +15
His scoring total was lower than Barrett’s and Barnes’ 33 points, but the overall contribution remained positive.
The +15 plus/minus is particularly useful when evaluating his impact in context.
A player’s scoring total does not always tell the complete story of his game. Toronto had enough offensive production elsewhere that Ingram could contribute without needing to lead the team in points.
Jakob Poeltl’s Interior Contribution
Jakob Poeltl recorded:
- 8 points
- 6 rebounds
- 2 assists
- 1 block
- +4
Poeltl’s numbers were more modest than the leading Toronto performers, but his role remained important.
He provided interior size, rebounding, passing, and rim protection.
Toronto finished with 35 rebounds compared with Cleveland’s 42, so the Raptors did not dominate the glass as a team. That makes individual contributions such as Poeltl’s six rebounds more meaningful.
Garrett Temple’s Defensive Impact
Garrett Temple’s offensive numbers were limited:
- 2 points
- 1 rebound
- 5 assists
- 5 steals
- +12
However, five steals immediately separate his performance from a conventional low-scoring contribution.
Five steals can change possession totals, create transition opportunities, and disrupt an opponent’s offensive rhythm.
His five assists also show that his contribution was not limited to defense.
This is an excellent example of why readers should avoid evaluating playoff performances purely through points.
Toronto’s Other Contributors
The remaining Toronto numbers were:
Ja’Kobe Walter
- 0 points
- 2 rebounds
- +6
Sandro Mamukelashvili
- 0 points
- 2 rebounds
- 1 assist
- -3
Collin Murray-Boyles
- 2 points
- 0 rebounds
- -3
Jonathan Mogbo
- 0 points
- 0 rebounds
- 1 assist
- -3
These players did not produce major scoring totals, but their minutes still formed part of Toronto’s overall rotation.
In a 126-point performance, the key distinction is that Toronto received substantial production from its leading players and several members of its supporting group.
Cleveland Cavaliers Player Stats
Cleveland’s offense was led by James Harden with 18 points.
The Cavaliers’ individual numbers were:
| Player | PTS | REB | AST | STL | BLK | TO | +/- |
| Dean Wade | 5 | 5 | 0 | 1 | 0 | 0 | -10 |
| Jarrett Allen | 12 | 4 | 1 | 2 | 3 | 0 | -22 |
| Evan Mobley | 15 | 6 | 7 | 2 | 1 | 2 | -20 |
| James Harden | 18 | 4 | 4 | 0 | 0 | 8 | -17 |
| Donovan Mitchell | 15 | 5 | 3 | 0 | 0 | 3 | -14 |
The Cavaliers’ starters combined for useful individual production, but their collective efficiency could not match Toronto’s shooting performance.
James Harden’s 18 Points and Eight Turnovers
James Harden led Cleveland with 18 points, along with:
- 4 rebounds
- 4 assists
- 8 turnovers
- -17 plus/minus
The eight turnovers are arguably the most important number in his statistical line.
Harden’s four assists indicate that he was involved in creating offense, but eight turnovers significantly reduced the value of those playmaking opportunities.
Cleveland committed 20 turnovers as a team.
Toronto committed only 11.
That nine-turnover difference created a major possession advantage for the Raptors.
In a game where Toronto was already shooting 57% from the field, giving the opponent additional possessions is especially damaging.
Evan Mobley Provides All-Around Production
Evan Mobley finished with:
- 15 points
- 6 rebounds
- 7 assists
- 2 steals
- 1 block
- 2 turnovers
- -20
His seven assists were the highest among Cleveland’s listed players.
Mobley’s performance therefore included meaningful playmaking in addition to scoring, rebounding, and defense.
The challenge for Cleveland was not necessarily that Mobley failed to contribute. Rather, Toronto’s overall team efficiency overwhelmed the Cavaliers’ individual production.
Donovan Mitchell’s 15 Points
Donovan Mitchell recorded:
- 15 points
- 5 rebounds
- 3 assists
- 3 turnovers
- -14
For a player capable of carrying a major scoring load, 15 points represented a relatively modest offensive output in a game where Cleveland needed to keep pace with Toronto’s shooting.
The three turnovers also contributed to Cleveland’s overall possession problem.
Jarrett Allen’s Defensive Presence
Jarrett Allen finished with:
- 12 points
- 4 rebounds
- 1 assist
- 2 steals
- 3 blocks
- -22
His three blocks were Cleveland’s highest individual total.
That statistic confirms that Cleveland still had meaningful rim protection.
However, Toronto’s perimeter efficiency created a different challenge. Blocking shots inside the paint becomes less influential when the opposing offense consistently converts from outside.
Dean Wade’s Five Points
Dean Wade recorded:
- 5 points
- 5 rebounds
- 1 steal
- -10
His five rebounds provided some frontcourt support, but the Cavaliers needed greater offensive efficiency across the rotation to keep pace with Toronto.
The Biggest Statistical Difference: Shooting Efficiency
The clearest explanation for Toronto’s victory is shooting.
Toronto:
50-87 from the field, 57%
Cleveland:
36-81 from the field, 44%
That means Toronto made 14 more field goals while attempting only six more shots.
That is an enormous efficiency advantage.
The difference becomes even more dramatic from three-point range.
Toronto:
14-23, 61%
Cleveland:
14-45, 31%
Both teams made exactly 14 three-pointers.
The difference was how many attempts each team needed to get there.
Toronto made 14 threes on 23 attempts.
Cleveland needed 45 attempts.
This is arguably the single most revealing statistic in the game.
Why Toronto’s 61% Three-Point Shooting Mattered
Three-point shooting does more than add three points to the scoreboard.
It changes defensive spacing.
When Toronto consistently converted from deep, Cleveland had fewer opportunities to overload the paint or aggressively help against drives.
That can create secondary advantages.
A defense forced to respect perimeter shooters has to cover more space. That can open passing lanes, driving lanes, and interior opportunities.
Toronto’s 29 assists suggest that the Raptors were not simply hitting difficult shots in isolation.
They were moving the ball effectively.
Ball Movement Was Another Major Advantage
Toronto recorded 29 assists.
Cleveland recorded 23.
The six-assist difference is not enormous, but it becomes more significant when combined with the shooting percentages.
Toronto’s offensive profile was therefore built around both accuracy and distribution.
Scottie Barnes led the Raptors with 11 assists, while Garrett Temple added five.
Barnes’ 11 assists and one turnover are especially valuable because they show that Toronto had a primary creator who could generate offense without frequently giving possessions away.
Turnovers Tell Another Part of the Story
Toronto committed 11 turnovers.
Cleveland committed 20.
The nine-turnover difference is substantial.
It is particularly damaging for Cleveland because Toronto also recorded 11 steals.
That suggests the Raptors were not simply benefiting from careless passes or offensive mistakes. Their defensive activity actively contributed to the possession battle.
Garrett Temple’s five steals were the most obvious individual example.
Rebounding: Cleveland Actually Had the Edge
One interesting aspect of the game is that Toronto did not win the rebounding battle.
Cleveland recorded 42 rebounds.
Toronto recorded 35.
That means the Cavaliers had a seven-rebound advantage.
This matters because it prevents an overly simplistic explanation of the game.
Toronto did not win because it dominated every statistical category.
Instead, the Raptors won because their advantages in shooting, ball security, assists, and defensive disruption were much more consequential.
Cleveland’s rebounding advantage was not enough to overcome those weaknesses.
Free Throws Were Not Toronto’s Strength
Toronto finished 12-21 from the free-throw line, or 57%.
Cleveland shot 18-23, or 78%.
This was one category where Cleveland clearly performed better.
The Cavaliers converted six more free throws despite losing by 22 points.
That makes Toronto’s victory even more dependent on field-goal and three-point efficiency.
The Raptors did not need to dominate the free-throw line because they were generating efficient offense elsewhere.
The Plus/Minus Story
Plus/minus measures the team’s point differential while a player is on the court.
Toronto’s leading plus/minus figures included:
- RJ Barrett: +24
- Scottie Barnes: +23
- Jamison Battle: +21
- Trayce Jackson-Davis: +21
- Brandon Ingram: +15
- Garrett Temple: +12
Cleveland’s listed starters all finished negative:
- Dean Wade: -10
- Jarrett Allen: -22
- Evan Mobley: -20
- James Harden: -17
- Donovan Mitchell: -14
Plus/minus should never be treated as a complete measure of individual ability. It is influenced by teammates, opponents, lineups, and game context.
However, when the numbers are this consistent across an entire team’s rotation, they help reinforce the overall story.
Toronto’s strongest contributors were generally on the floor during successful stretches.
Toronto’s Fourth-Quarter Explosion
The 43-point fourth quarter deserves special attention.
Toronto entered the final period with a manageable advantage, then produced an offensive outburst that Cleveland could not answer.
Scoring 43 points in one quarter requires more than one player getting hot.
It generally reflects a combination of:
- Shot-making
- Ball movement
- Transition opportunities
- Defensive stops
- Reduced turnovers
- Confidence and rhythm
Toronto’s 11 steals and Cleveland’s 20 turnovers fit naturally into that picture.
Every defensive disruption creates the possibility of a transition possession before the defense can set.
That can make scoring more efficient than attacking a fully organized half-court defense.
What the Box Score Says About Toronto’s Strategy
The numbers suggest that Toronto succeeded through a balanced offensive structure.
The Raptors had two 33-point scorers in Barrett and Barnes, but they also received:
- 22 points from Battle
- 14 from Jackson-Davis
- 12 from Ingram
- 8 from Poeltl
That distribution matters.
Cleveland could not simply focus on stopping one scorer.
Barnes also functioned as the team’s leading playmaker, finishing with 11 assists.
That combination created a difficult defensive assignment.
What Cleveland Needs to Learn From Game 3
The Cavaliers’ 104 points were not inherently disastrous.
The bigger issue was how they arrived there.
Several numbers immediately stand out:
- 44% field-goal shooting
- 31% three-point shooting
- 20 turnovers
- 23 assists
- 42 rebounds
- 18 points from Harden
- 15 points from Mobley
- 15 points from Mitchell
Cleveland won the rebounding battle and made more free throws efficiently.
But those advantages could not compensate for the combination of inefficient perimeter shooting and excessive turnovers.
Against a team that shoots 61% from three, possessions become extremely valuable.
Toronto Raptors vs Cleveland Cavaliers Match Player Stats: What Matters Most
For readers comparing the numbers, five statistics provide the strongest summary.
1. Toronto’s 57% Field-Goal Shooting
The Raptors made 50 of 87 attempts.
That level of efficiency gave Toronto a reliable offensive foundation.
2. Toronto’s 61% Three-Point Shooting
The Raptors made 14 of 23 from deep.
This was the biggest shooting advantage in the game.
3. Cleveland’s 20 Turnovers
Twenty turnovers gave Toronto too many opportunities to attack in transition and generate additional possessions.
4. Scottie Barnes’ 33 Points and 11 Assists
Barnes combined elite scoring with high-level playmaking and committed only one turnover.
5. Toronto’s 43-Point Fourth Quarter
The final period transformed the game.
This was where Toronto’s shooting, ball movement, and defensive pressure came together most effectively.
How to Read These Player Stats Correctly
A useful approach to analyzing a playoff box score is to avoid looking at points first.
Instead, consider the game in layers.
First layer: efficiency
Look at field-goal percentage and three-point percentage.
Second layer: possession control
Compare turnovers, steals, and offensive opportunities.
Third layer: creation
Examine assists and identify which players are generating shots for teammates.
Fourth layer: physical play
Review rebounds, blocks, and interior defense.
Fifth layer: lineup impact
Use plus/minus as supporting evidence rather than the only measurement.
This method produces a much more complete picture than a basic points leaderboard.
For official statistical research and deeper box-score comparisons, the NBA Stats platform is a useful authoritative reference.
Real-World Takeaway for Fans and Analysts
The most useful lesson from this game is that playoff basketball is often decided by efficiency rather than raw volume.
Cleveland attempted 45 three-pointers.
Toronto attempted only 23.
Yet both teams made 14.
That single comparison captures the offensive difference better than almost any other statistic.
Toronto generated fewer attempts but converted them at an extraordinary rate.
At the same time, the Raptors protected the ball better and created more assists.
The Cavaliers’ rebounding advantage was real, but it did not outweigh the other categories.
For anyone evaluating future matchups, this is why a box score should be read as a connected system rather than a collection of isolated numbers.
Toronto’s Starting Lineup Performance
Toronto’s starters were Brandon Ingram, RJ Barrett, Scottie Barnes, Jakob Poeltl, and Ja’Kobe Walter.
Their listed performances show an unusual distribution.
Barrett and Barnes carried the scoring load with 33 points apiece.
Ingram added 12.
Poeltl added 8.
Walter did not score.
Despite that uneven scoring distribution, Toronto scored 126 points because the bench supplied substantial production.
Jamison Battle’s 22 points and Trayce Jackson-Davis’ 14 were especially important.
This is a classic example of why a playoff team benefits from multiple scoring sources.
Cleveland’s Starting Lineup Performance
Cleveland started Dean Wade, Jarrett Allen, Evan Mobley, James Harden, and Donovan Mitchell.
The scoring distribution was more balanced than Toronto’s starting unit:
- Harden: 18
- Mobley: 15
- Mitchell: 15
- Allen: 12
- Wade: 5
Yet Cleveland still struggled to keep pace.
The reason was efficiency.
Balanced scoring is valuable, but it does not automatically create an efficient offense.
Toronto combined star production with efficient supporting scoring.
The Role of Defensive Activity
Toronto recorded 11 steals.
That number matches Cleveland’s total turnover problem particularly well.
Garrett Temple accounted for five steals alone.
Barrett, Barnes, and Jackson-Davis also contributed steals.
On the other side, Cleveland recorded seven steals and six blocks.
Jarrett Allen’s three blocks were the team’s highest individual total.
The defensive statistics therefore show that both teams were active defensively, but Toronto’s ability to create turnovers while maintaining offensive efficiency proved more valuable.
Why the 22-Point Margin Can Be Misleading
A final score of 126-104 suggests a comfortable Toronto victory.
It was comfortable by the end.
But the quarter-by-quarter results tell a more nuanced story.
Toronto led 31-25 after the first.
Cleveland won the second quarter 29-23.
Toronto took the third 29-27.
Then Toronto exploded for 43 points in the fourth while Cleveland scored 23.
So the decisive story was not four quarters of complete Toronto control.
It was a game that remained competitive before Toronto dramatically separated itself late.
That distinction is important when evaluating player performance and team strategy.
Frequently Asked Questions
What was the final score of Toronto vs Cleveland Game 3?
Toronto defeated Cleveland 126-104 in Game 3 at Scotiabank Arena in Toronto.
Who led the Raptors in scoring?
RJ Barrett and Scottie Barnes both scored 33 points, making them Toronto’s joint leading scorers.
Who led Cleveland in scoring?
James Harden led Cleveland with 18 points.
How many assists did Scottie Barnes have?
Scottie Barnes recorded 11 assists, along with 33 points, 5 rebounds, 1 steal, 1 block, and only 1 turnover.
Which team shot better from three-point range?
Toronto shot 61% from three-point range, making 14 of 23 attempts. Cleveland also made 14 threes but needed 45 attempts and shot 31%.
Why did Toronto win despite Cleveland having more rebounds?
Cleveland had 42 rebounds compared with Toronto’s 35, but Toronto had major advantages in shooting efficiency, three-point accuracy, assists, turnovers, and steals. Those advantages outweighed Cleveland’s seven-rebound edge.
Conclusion
The toronto raptors vs cleveland cavaliers match player stats from Game 3 reveal a Toronto performance built on efficiency, ball movement, and late-game execution.
RJ Barrett and Scottie Barnes each scored 33 points, while Barnes added 11 assists with just one turnover. Jamison Battle supplied 22 points and eight rebounds, while Trayce Jackson-Davis added 14 points and eight rebounds. Garrett Temple provided an unusual defensive spark with five steals.
Cleveland had meaningful contributions from James Harden, Evan Mobley, Donovan Mitchell, and Jarrett Allen, and the Cavaliers won the rebounding battle 42-35. However, their 20 turnovers and 31% three-point shooting created a difficult path to victory.
The biggest statistical contrast was Toronto’s shooting efficiency. Both teams made 14 three-pointers, but Toronto did so on 23 attempts while Cleveland required 45. Combined with Toronto’s 57% overall field-goal shooting and 29 assists, that efficiency explains much of the 126-104 result.
The fourth quarter ultimately provided the defining moment. Toronto scored 43 points while holding Cleveland to 23, turning a competitive game into a decisive victory and giving the Raptors a crucial Game 3 result in the series.