New York Giants vs Detroit Lions Match Player Stats
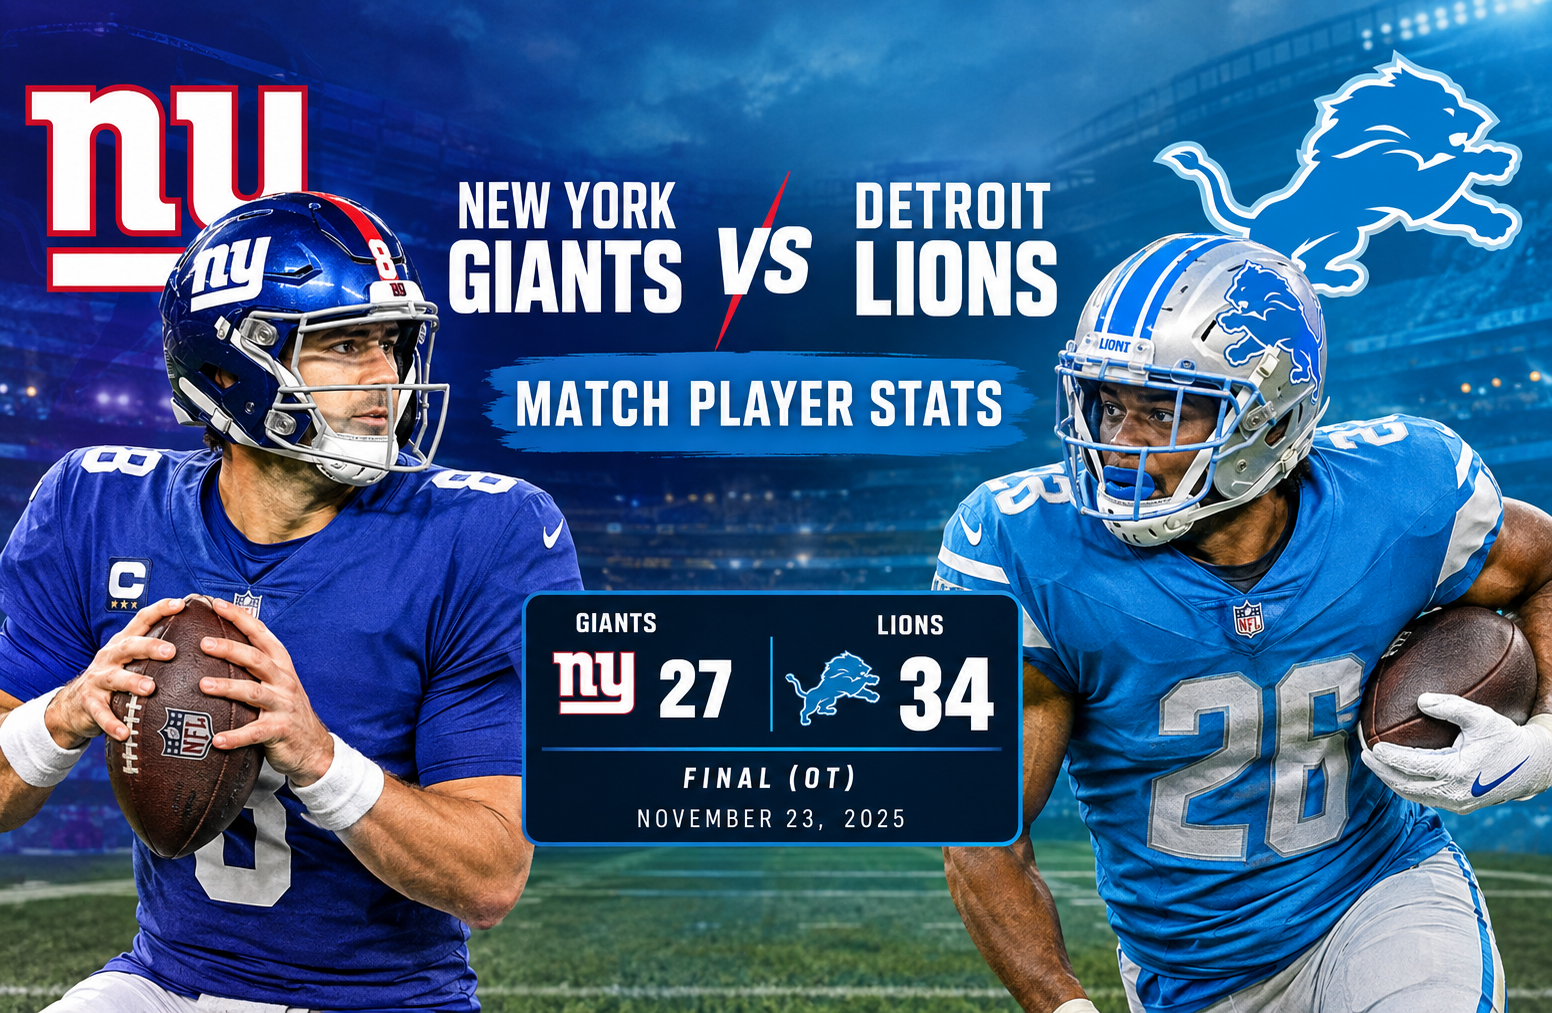
The new york giants vs detroit lions match player stats from the November 23, 2025 matchup tell the story of a game that changed direction several times before Detroit escaped with a 34-27 overtime victory. The Giants built a 20-17 halftime lead, Detroit answered in the second half, and both teams were tied at 27 after regulation. Jahmyr Gibbs then ended the contest with a 69-yard touchdown run on Detroit’s first offensive play of overtime. The result moved Detroit to 7-4 and dropped New York to 2-10. (ESPN)
This was not simply a game decided by one quarterback or one late defensive play. The statistical profile was unusually sharp. New York generated 395 passing yards and averaged 21.0 yards per reception, while Detroit produced 237 rushing yards and averaged 11.9 yards per carry. Gibbs accounted for 219 rushing yards on only 15 attempts, while Amon-Ra St. Brown caught nine passes for 149 yards. For New York, Wan’Dale Robinson delivered nine receptions for 156 yards and a touchdown.
The numbers also reveal an important contrast. New York moved the ball through the air with considerable explosiveness, but Detroit repeatedly created large gains on the ground. That difference became especially important in overtime, when Gibbs turned one rushing opportunity into the winning score. (ESPN)
Game Overview
The matchup took place at Ford Field in Detroit during Week 12 of the 2025 NFL regular season. Detroit entered the game at 6-4, while New York was 2-9. After the overtime result, Detroit improved to 7-4 and New York fell to 2-10. (NFL)
Final Score
| Team | Q1 | Q2 | Q3 | Q4 | OT | Final |
| New York Giants | 10 | 10 | 0 | 7 | 0 | 27 |
| Detroit Lions | 0 | 17 | 0 | 10 | 7 | 34 |
The scoring pattern is one of the clearest ways to understand the game.
New York controlled the opening quarter, scoring 10 points while holding Detroit scoreless. The Giants then added another 10 points in the second quarter and entered halftime ahead 20-17.
Detroit responded after halftime, but neither team scored in the third quarter. The Lions added 10 points in the fourth quarter, while the Giants scored seven. That left the teams tied at 27 and sent the game into overtime.
Detroit won the game on its first offensive play of overtime when Gibbs broke free for a 69-yard touchdown run. ESPN’s game recap reported that the run gave Gibbs three total touchdowns and 264 scrimmage yards for the game. (ESPN)
New York Giants vs Detroit Lions Match Player Stats: Passing
Passing statistics provide one of the most interesting contrasts in this matchup.
Jameis Winston finished as New York’s primary passer with 18 completions on 36 attempts for 366 yards. He averaged 10.2 yards per attempt, threw two touchdowns and one interception, and finished with a 93.1 passer rating according to the supplied game data.
New York also used Gunner Olszewski on a trick-play passing attempt. Olszewski completed his only pass for 33 yards and a touchdown. That unusual contribution meant the Giants finished with 19 completions on 37 attempts for 395 gross passing yards, three passing touchdowns and one interception.
Jameis Winston’s Passing Performance
Winston’s statistical line was productive in terms of yardage:
- Completions: 18
- Attempts: 36
- Completion rate: 50.0%
- Passing yards: 366
- Yards per attempt: 10.2
- Passing touchdowns: 2
- Interceptions: 1
- Sacks: 1 for 4 yards
- Passer rating: 93.1
The 366 passing yards are particularly notable because New York did not rely on a high-volume completion percentage to move the ball. Instead, the Giants produced several large gains.
Winston also contributed to one of the game’s strangest statistical sequences. He caught a 33-yard touchdown pass, meaning he appeared in the receiving column as well as the passing column. ESPN’s recap noted that Winston threw a 39-yard touchdown pass on a trick play and also caught a 33-yard touchdown reception. (ESPN)
That kind of trick-play production helped New York create a 20-point first half.
Jared Goff’s Passing Performance
Jared Goff completed 28 of 42 passes for 279 yards, two touchdowns and one interception. His completion percentage was 66.7%, and his average was 6.6 yards per attempt.
His passing line was less explosive than Winston’s on a per-attempt basis, but Goff completed 10 more passes and consistently kept Detroit’s offense moving.
Goff’s two touchdown passes went to Amon-Ra St. Brown and Jahmyr Gibbs. ESPN’s game recap confirms that St. Brown caught an 11-yard touchdown pass and Gibbs caught a 3-yard touchdown pass. (ESPN)
The Detroit team passing figure can look confusing if gross and net passing are not separated. Goff threw for 279 yards, but Detroit was charged with 22 sack yards. That produces 257 net passing yards, which matches the team figure supplied for the game.
This distinction matters when reading football box scores. A quarterback’s passing yardage and a team’s net passing yardage are not necessarily identical because sack yardage is deducted from team passing production.
Giants Rushing Statistics
New York’s rushing attack was much less efficient than its passing game.
The Giants ran the ball 39 times for 122 yards, averaging 3.1 yards per carry and scoring no rushing touchdowns.
Tyrone Tracy Jr. led the Giants in rushing with 20 attempts for 62 yards. Devin Singletary added 47 yards on 14 carries, while Winston rushed four times for 13 yards.
Tyrone Tracy Jr.
Tracy handled the largest share of New York’s rushing attempts:
- 20 carries
- 62 yards
- 3.1 yards per carry
- 11-yard long
- 0 rushing touchdowns
He also contributed as a receiver with three catches for 68 yards. His receiving average of 22.7 yards per catch shows that his overall offensive impact was considerably larger than his rushing total alone suggests.
Devin Singletary
Singletary carried 14 times for 47 yards.
His 3.4-yard average was slightly better than Tracy’s 3.1-yard figure, but neither back produced a rushing touchdown. NFL game logs also confirm Singletary’s 14 carries for 47 yards in the Week 12 matchup. (NFL)
The Giants therefore had to generate most of their scoring production through passing and special offensive concepts rather than conventional rushing efficiency.
Detroit Lions Rushing Statistics
The largest statistical advantage of the game belonged to Detroit’s rushing attack.
The Lions finished with 237 rushing yards on only 20 attempts. That equals an extraordinary 11.9 yards per carry.
Jahmyr Gibbs was responsible for 219 of those yards.
Jahmyr Gibbs’ Historic Performance
Gibbs carried the ball 15 times for 219 yards, an average of 14.6 yards per attempt. He scored two rushing touchdowns and had a long run of 69 yards.
His rushing line alone would have been enough to make him the central statistical figure of the game. His receiving production made the performance even more significant.
Gibbs added:
- 11 receptions
- 45 receiving yards
- 4.1 yards per reception
- 1 receiving touchdown
- 13-yard longest reception
Combining his rushing and receiving production gives him 264 scrimmage yards and three total touchdowns.
ESPN reported that the 264 scrimmage yards ranked as the third-highest single-game total in Lions history. His 219 rushing yards were also a career high. (ESPN)
His overtime touchdown was the defining play. With the score tied 27-27, Gibbs took the first Detroit offensive snap of overtime 69 yards for the winning touchdown. (ESPN)
David Montgomery
David Montgomery carried the ball five times for 18 yards, averaging 3.6 yards per attempt.
He was not the primary rushing engine in this matchup because Gibbs received most of the opportunities. Montgomery did contribute three receptions for 19 yards.
The Lions therefore received a complementary contribution from Montgomery while Gibbs handled the explosive workload.
Giants Receiving Statistics
New York’s receiving production was one of the strongest aspects of its offensive performance.
The Giants recorded 19 receptions for 399 yards, an average of 21.0 yards per reception, and three receiving touchdowns.
That is an extremely explosive receiving profile.
Wan’Dale Robinson
Robinson was New York’s leading receiver and one of the most productive pass catchers in the entire Week 12 slate.
He finished with:
- 9 receptions
- 156 yards
- 17.3 yards per reception
- 1 touchdown
- 40-yard long
- 14 targets
The 14 targets were also significant. Robinson accounted for a substantial portion of New York’s passing workload and consistently provided a downfield option.
His 156 receiving yards ranked second among NFL players for the week, according to ESPN’s Week 12 statistical leaders. (ESPN)
Robinson’s production was a major reason the Giants remained competitive despite Detroit’s rushing advantage.
Theo Johnson
Theo Johnson caught three passes for 77 yards.
His 25.7 yards per reception was the highest average among New York players with more than one reception. His longest catch covered 39 yards.
Although he did not score, Johnson provided important explosive plays in the passing game.
Tyrone Tracy Jr.
Tracy’s receiving line was also impressive:
- 3 receptions
- 68 yards
- 22.7 yards per reception
- 42-yard long
- 0 touchdowns
When combined with his 62 rushing yards, Tracy produced 130 total yards from scrimmage.
Isaiah Hodgins
Hodgins caught two passes for 42 yards and a touchdown.
His average of 21.0 yards per reception shows that New York’s passing attack was built around chunk gains rather than short, high-volume completions.
Jameis Winston
Winston’s receiving line deserves separate attention because it came on an unusual trick play.
He caught one pass for 33 yards and a touchdown.
That means New York’s starting quarterback directly contributed to the passing and receiving touchdown totals in the same game.
Detroit Lions Receiving Statistics
Detroit’s passing attack was more concentrated than New York’s.
The Lions recorded 28 receptions for 279 yards and two touchdowns. Amon-Ra St. Brown was the leading conventional receiver, while Gibbs provided an important dual-threat element.
Amon-Ra St. Brown
St. Brown finished with:
- 9 receptions
- 149 yards
- 16.6 yards per reception
- 1 touchdown
- 30-yard long
- 13 targets
His nine receptions matched Robinson’s reception total, but St. Brown generated 149 yards compared with Robinson’s 156.
NFL’s 2025 game log also confirms St. Brown’s nine catches for 149 yards and one touchdown against the Giants. (NFL)
His touchdown came on an 11-yard pass from Goff.
Jahmyr Gibbs as a Receiver
Gibbs’ 11 receptions were nearly as important as his rushing performance.
He received 12 targets and caught 11 of them for 45 yards and one touchdown.
His receiving average was only 4.1 yards per catch, but that number needs context. His value came from combining short receptions with explosive rushing plays.
This is an important lesson when analyzing dual-threat players. A running back can have a modest receiving average while still being one of the most important players on the field because his rushing efficiency changes how a defense must allocate resources.
Other Detroit Receivers
Kalif Raymond caught two passes for 37 yards, including a 30-yard reception.
Brock Wright added three catches for 29 yards.
David Montgomery caught three passes for 19 yards.
Jameson Williams and Isaac TeSlaa were both held without a reception.
The Lions therefore relied heavily on St. Brown and Gibbs for their major offensive production.
Defensive Player Statistics
The offensive numbers dominate the box score, but the defensive figures explain some of the game’s momentum swings.
New York recorded 69 total tackles, 41 solo tackles, three sacks, six tackles for loss, four passes defended and seven quarterback hits.
Detroit recorded 83 total tackles, 43 solo tackles, one sack, four tackles for loss, six passes defended and seven quarterback hits.
New York Defensive Production
Jevon Holland recorded New York’s interception.
He returned the interception three yards and did not score.
The Giants also generated three sacks and seven quarterback hits, showing that Detroit’s passing game was not completely comfortable.
New York’s defense produced enough pressure to force difficult situations, but Detroit’s rushing efficiency repeatedly created favorable offensive situations.
Detroit Defensive Production
Thomas Harper recorded Detroit’s interception.
The Lions finished with one sack and seven quarterback hits.
One of the most important defensive sequences occurred in overtime. ESPN reported that the Giants reached the Detroit 31-yard line with an opportunity to extend the game, but the drive ended on downs after Aidan Hutchinson sacked Winston. (ESPN)
That play mattered because it temporarily gave New York another opportunity before Gibbs ended the game on the next Detroit possession.
Special Teams Statistics
Special teams were not the headline of this matchup, but both teams were reliable in the kicking game.
New York Kicking
Younghoe Koo converted both of his field-goal attempts.
His longest field goal was 44 yards, and he made all three extra-point attempts for nine points.
Detroit Kicking
Jake Bates also went 2-for-2 on field goals.
His longest successful attempt was 59 yards, and he converted all four extra points. He finished with 10 kicking points.
The difference between the two kickers was therefore one extra point, but neither missed a field-goal attempt.
Punting
Jamie Gillan punted three times for 120 yards, averaging 40.0 yards per punt.
Jack Fox punted five times for 200 yards, also averaging 40.0 yards per punt. Four of Fox’s punts were downed inside the 20-yard line.
Kick Returns
New York recorded five kick returns for 122 yards.
Gunner Olszewski had three returns for 81 yards, while Eric Gray had two returns for 41 yards.
Detroit recorded six kick returns for 183 yards. Jacob Saylors handled five returns for 139 yards, while Kalif Raymond had one 44-yard return.
The Lions therefore had a meaningful advantage in total kick-return yardage, even though neither team returned a kickoff for a touchdown.
Turnovers and Possession Efficiency
Turnovers were relatively limited.
New York recorded one fumble, but it was not lost. Detroit did not record a fumble.
Each team threw one interception.
That means neither offense suffered a major turnover imbalance in conventional terms.
The difference came more from efficiency and explosive plays.
Detroit’s 237 rushing yards came on just 20 attempts. That is 11.9 yards per carry.
New York’s 122 rushing yards came on 39 attempts. That is 3.1 yards per carry.
The difference is substantial. Detroit generated 115 more rushing yards while using 19 fewer rushing attempts.
That contrast helped Detroit maintain offensive efficiency despite Goff throwing one interception.
Why Jahmyr Gibbs Changed the Game
Gibbs’ performance is best understood by separating volume from explosiveness.
He received only 15 rushing attempts.
Many 200-yard rushing performances require an enormous workload. Gibbs reached 219 yards without needing 25 or 30 carries.
His 14.6-yard rushing average means that he was gaining nearly five times the yardage per carry that New York’s running game averaged.
The 69-yard overtime touchdown is the obvious example, but it was not an isolated event. His rushing line already contained 219 yards before overtime, including another major touchdown run in the fourth quarter.
ESPN reported that Gibbs’ 219 rushing yards were the third-highest single-game rushing total in Lions history. (ESPN)
His receiving work added another layer. With 11 catches and a receiving touchdown, Detroit could use him as both a runner and a receiver.
That versatility creates matchup problems because a defense cannot simply assume that Gibbs will be involved in one phase of the offense.
Why the Giants Were Able to Stay in the Game
New York’s statistical profile explains why the Giants had a realistic chance to win despite losing the rushing battle.
The Giants produced 395 gross passing yards.
Robinson had 156 yards.
Johnson had 77.
Tracy had 68.
Hodgins had 42.
Winston added 33 receiving yards.
The team also scored three receiving touchdowns.
That level of passing production compensated for a relatively inefficient running game.
New York also scored 20 points before halftime. Detroit’s defense did not allow the Giants to maintain that scoring pace after the break, however.
The third quarter ended scoreless for both teams. Detroit then outscored New York 17-7 over the fourth quarter and overtime combined.
That shift in scoring momentum was critical.
The Most Important Statistical Matchups
Several individual matchups stand out when the complete box score is examined.
Jahmyr Gibbs vs. the Giants Run Defense
Gibbs rushed for 219 yards on 15 carries.
New York’s entire team rushing attack produced 122 yards on 39 attempts.
Gibbs alone therefore rushed for 97 more yards than the entire Giants rushing unit.
That is the clearest statistical illustration of Detroit’s biggest advantage.
Amon-Ra St. Brown vs. New York’s Secondary
St. Brown caught nine of 13 targets for 149 yards and one touchdown.
He provided Goff with a reliable high-volume option while also producing explosive gains.
Wan’Dale Robinson vs. Detroit’s Secondary
Robinson’s 156 yards on nine receptions kept New York’s offense dangerous throughout the game.
His 14 targets indicate that Winston repeatedly looked in his direction.
Jameis Winston vs. Jared Goff
Winston threw for 366 yards and two touchdowns.
Goff threw for 279 yards and two touchdowns.
Winston had the higher passing-yard total and higher yards-per-attempt figure, but Goff’s offense ultimately benefited from an extraordinary rushing performance.
The comparison illustrates why quarterback passing statistics should not be isolated from the rest of the offensive environment.
A Closer Look at Explosive Plays
Explosive plays were central to the outcome.
New York had multiple long receptions:
- Tracy: 42 yards
- Johnson: 39 yards
- Robinson: 40 yards
- Hodgins: 30 yards
- Winston: 33 yards
- Slayton: 23 yards
Detroit’s biggest offensive gains came primarily from Gibbs:
- 69-yard rushing touchdown
- 45 receiving yards total
- 13-yard longest reception
Detroit’s offense therefore produced its largest explosive gains on the ground, while New York generated most of its explosive production through the air.
That distinction is arguably more informative than simply comparing total yards.
What the Box Score Says About Offensive Style
The game presents two very different offensive profiles.
New York was highly dependent on passing efficiency and explosive receptions.
Detroit was balanced in structure but unusually dominant on the ground.
The Giants averaged 21.0 yards per reception as a team. Detroit averaged 10.0 yards per reception.
Yet Detroit won because its rushing attack produced 237 yards at 11.9 yards per attempt.
This is why total passing yards alone do not explain the outcome.
New York actually produced more gross passing yards than Detroit, but Detroit produced far more rushing yardage.
The resulting offensive distribution favored Detroit in the moments that mattered most.
What the Overtime Sequence Reveals
Overtime reduced the game to a small number of decisive plays.
The Giants received an opportunity during the extra period and reached the Detroit 31-yard line.
The drive ended when Hutchinson sacked Winston on fourth down.
Detroit then took possession.
On the first offensive play, Gibbs broke a 69-yard touchdown run.
That sequence transformed the game from a competitive overtime contest into an immediate Detroit victory. (ESPN)
It also illustrates the importance of late-game execution.
The Giants had a chance to extend the game but failed to convert.
Detroit then needed only one offensive snap to finish it.
What These Stats Mean for Evaluating Player Performance
A useful way to analyze individual performance is to avoid relying on one headline statistic.
For Winston, 366 passing yards look impressive, but the 18 completions on 36 attempts show that his production came through an aggressive passing profile. His two passing touchdowns and one interception also need to be considered alongside the trick-play touchdown involving him as a receiver.
For Goff, 279 passing yards with two touchdowns and one interception represent a solid passing performance, but the larger story was Detroit’s rushing efficiency.
For Gibbs, the numbers are straightforward. He produced 219 rushing yards, 45 receiving yards and three touchdowns.
For Robinson, the key numbers are nine catches, 156 yards, 14 targets and one touchdown.
For St. Brown, nine catches, 149 yards, 13 targets and one touchdown demonstrate how important he was to Detroit’s passing attack.
This broader approach prevents the analysis from becoming a simple list of statistical leaders.
New York Giants vs Detroit Lions Match Player Stats: Key Takeaways
The most important statistical lessons from this matchup can be summarized clearly.
- Detroit’s rushing attack was the biggest difference.
The Lions gained 237 rushing yards on 20 attempts, while New York managed 122 yards on 39 attempts. - Gibbs produced an extraordinary all-purpose performance.
He recorded 219 rushing yards, 45 receiving yards and three total touchdowns. - New York’s passing attack was extremely explosive.
The Giants generated 395 gross passing yards and averaged 21.0 yards per reception. - Robinson was New York’s leading receiver.
He finished with 156 yards and a touchdown on nine catches. - St. Brown was Detroit’s primary receiving threat.
He recorded nine catches for 149 yards and a touchdown. - Both quarterbacks threw for two touchdowns and one interception.
Winston produced 366 passing yards, while Goff produced 279. - The game was decided by late execution.
New York failed to convert in overtime, and Gibbs scored a 69-yard touchdown on Detroit’s first overtime play. - Detroit’s defensive pressure mattered late.
The Lions recorded seven quarterback hits and produced the overtime sack that ended New York’s final possession.
Frequently Asked Questions
What was the final score between the Giants and Lions in 2025?
The Detroit Lions defeated the New York Giants 34-27 in overtime on November 23, 2025, at Ford Field. (NFL)
How many rushing yards did Jahmyr Gibbs have against the Giants?
Jahmyr Gibbs rushed for 219 yards on 15 carries, averaging 14.6 yards per carry. He scored two rushing touchdowns and had a long run of 69 yards. (ESPN)
How many receiving yards did Wan’Dale Robinson have?
Wan’Dale Robinson recorded nine receptions for 156 yards and one touchdown on 14 targets. His longest reception was 40 yards. (ESPN)
How did Jameis Winston perform against Detroit?
Winston completed 18 of 36 passes for 366 yards, two touchdowns and one interception. He also caught a 33-yard touchdown pass on a trick play.
How did Jared Goff perform against the Giants?
Goff completed 28 of 42 passes for 279 yards, two touchdowns and one interception. His touchdown passes went to Amon-Ra St. Brown and Jahmyr Gibbs. (ESPN)
Who was the leading receiver for the Lions?
Amon-Ra St. Brown led Detroit with nine receptions for 149 yards and one touchdown. Jahmyr Gibbs also caught 11 passes for 45 yards and a touchdown. (ESPN)
Conclusion
The new york giants vs detroit lions match player stats show a game in which two very different offensive approaches produced a highly competitive result.
New York’s passing attack was the more explosive aerial unit. Winston threw for 366 yards, Robinson produced 156 receiving yards, and the Giants finished with 399 receiving yards as a team. The offense also produced three receiving touchdowns and entered halftime with a 20-17 lead.
Detroit’s defining advantage was its ground game. The Lions rushed for 237 yards on only 20 attempts, with Gibbs accounting for 219 of those yards. His receiving contribution pushed him to 264 scrimmage yards, and his three total touchdowns made him the central statistical figure of the game. (ESPN)
St. Brown also played a major role with nine receptions for 149 yards and a touchdown, while Goff completed 28 of 42 passes for 279 yards and two touchdowns.
Defensively, both teams recorded an interception. New York generated three sacks, while Detroit produced the decisive overtime sack of Winston. The game ultimately came down to a single possession in overtime, and Gibbs finished it immediately with a 69-yard touchdown.
From a statistical perspective, the matchup is a strong example of why football analysis should combine passing, rushing, receiving, defensive pressure, field position and situational performance. New York accumulated impressive passing numbers, but Detroit’s extraordinary rushing efficiency gave the Lions the decisive advantage when the game reached its final possession.
The new york giants vs detroit lions match player stats therefore tell a more complete story than the 34-27 final score alone. They show a Giants offense capable of explosive passing production, a Lions offense powered by an exceptional rushing performance, and an overtime finish determined by one of the biggest plays of the game.
Official reference: The NFL’s official game center provides the final score, quarter-by-quarter scoring and game information. official NFL game center