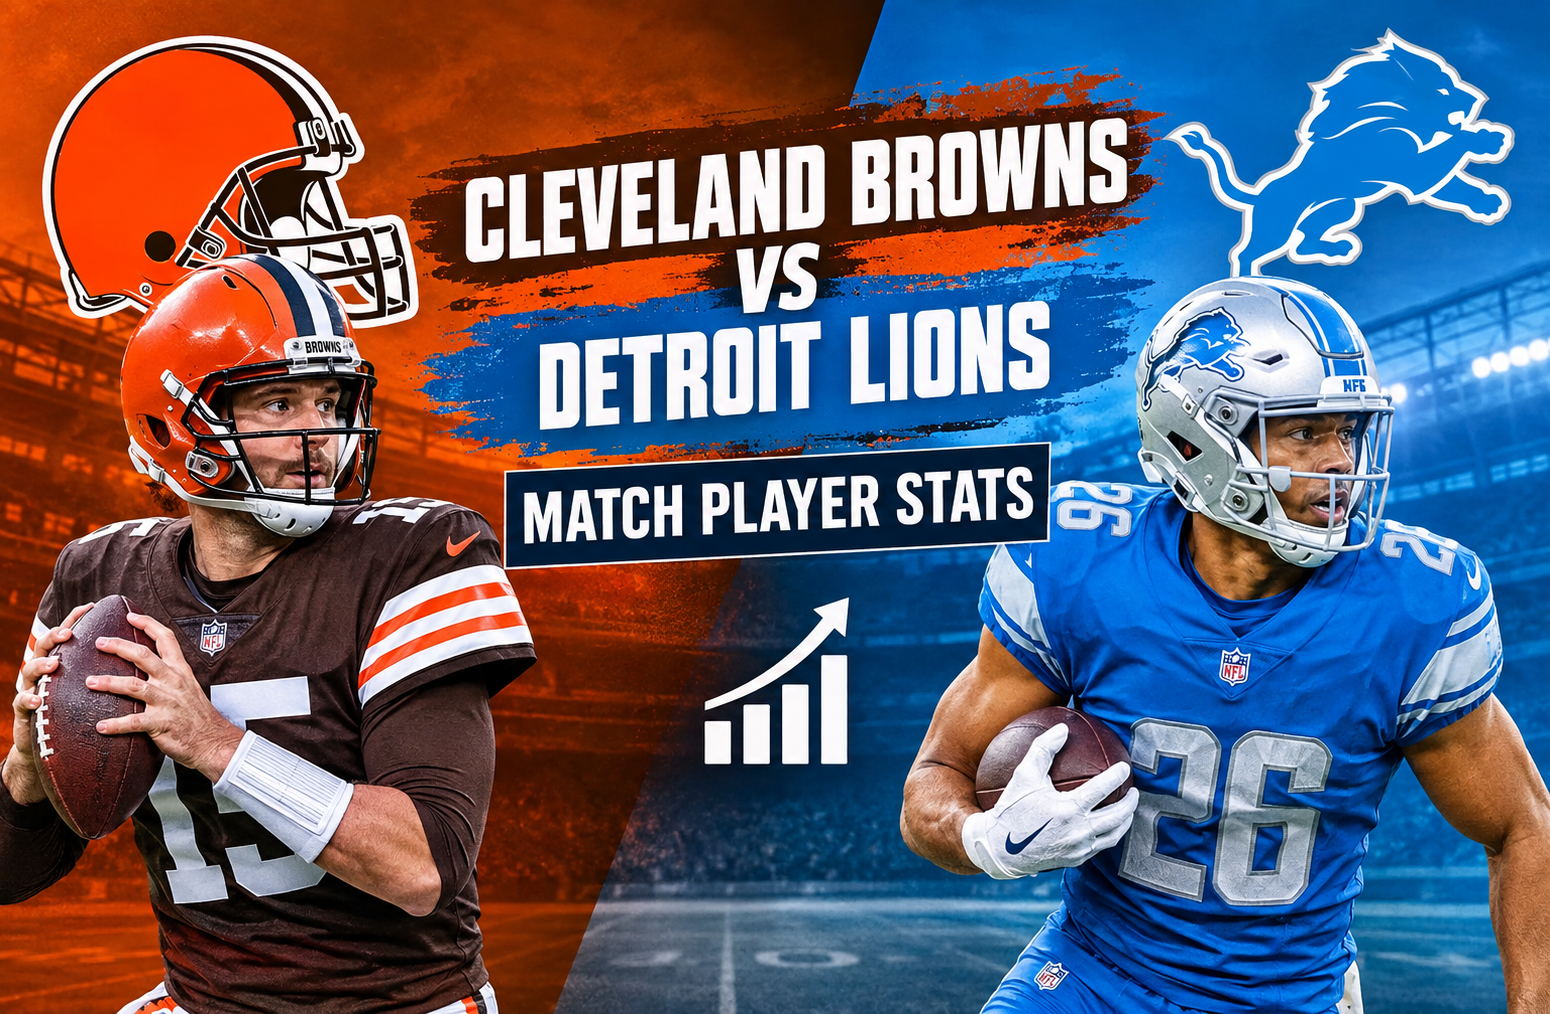
Cleveland Browns vs Detroit Lions Match Player Stats
The cleveland browns vs detroit lions match player stats from September 28, 2025, tell a much clearer story than the final score alone. Detroit defeated Cleveland 34-10 at Ford Field, improving to 3-1 while the Browns fell to 1-3. The Lions scored in every quarter except the third, while Cleveland managed points only in the first and third quarters.
For readers looking beyond the scoreboard, this game provides several useful statistical lessons. Cleveland actually controlled the ball for 31:44 compared with Detroit’s 28:16, but that possession advantage did not translate into sustained offensive production. The Browns finished with 249 total yards, while Detroit produced 277. More importantly, Cleveland committed three turnovers and converted only 3 of 14 third downs. Detroit converted 6 of 14 third downs and went 3-for-3 in the red zone.
This breakdown examines the passing, rushing, receiving, defensive and special teams numbers, while also explaining which statistics mattered most to the outcome.
Cleveland Browns vs Detroit Lions Match Player Stats: Game Overview
The game was played on September 28, 2025, at Ford Field in Detroit. The Lions won 34-10.
| Category | Cleveland Browns | Detroit Lions |
| Final Score | 10 | 34 |
| Record After Game | 1-3 | 3-1 |
| Total Yards | 249 | 277 |
| Passing Yards | 170 | 168 |
| Rushing Yards | 79 | 109 |
| Total Plays | 65 | 56 |
| Yards Per Play | 3.8 | 4.9 |
| First Downs | 16 | 16 |
| Third Down | 3/14 | 6/14 |
| Red Zone | 1/2 | 3/3 |
| Turnovers | 3 | 1 |
| Time of Possession | 31:44 | 28:16 |
| Sacks | 3 | 0 |
The numbers show why this was not simply a case of Detroit overwhelming Cleveland in total yardage.
The Lions gained only 28 more total yards, yet they won by 24 points. That difference came largely from efficiency, turnovers, scoring opportunities and explosive plays.
Detroit averaged 4.9 yards per play compared with Cleveland’s 3.8. The Lions also avoided sacks, committed only one turnover and converted all three of their red-zone opportunities. Cleveland, meanwhile, threw two interceptions, lost one fumble and struggled to sustain drives.
Quarter-by-Quarter Breakdown
The scoring pattern shows how the game developed.
| Quarter | Cleveland | Detroit |
| First | 7 | 7 |
| Second | 0 | 13 |
| Third | 3 | 0 |
| Fourth | 0 | 14 |
| Final | 10 | 34 |
The first quarter was competitive. Both teams scored seven points, and Cleveland opened the game with an 88-yard touchdown drive.
The second quarter changed the rhythm.
Detroit added 13 points while Cleveland failed to score. The Lions then shut out the Browns in the fourth quarter while adding another 14 points.
That late-game scoring gap is important because Cleveland had opportunities to remain competitive. The Browns finished with 16 first downs, the same total as Detroit, but their drives repeatedly stalled because of inefficient third-down execution and turnovers.
Joe Flacco’s Passing Performance
Joe Flacco completed 16 of 34 passes for 184 yards according to the supplied player data. He averaged 5.4 yards per attempt, threw no touchdowns and had two interceptions.
His overall passing line was:
| Statistic | Joe Flacco |
| Completions | 16 |
| Attempts | 34 |
| Completion Rate | 47.1% |
| Passing Yards | 184 |
| Yards Per Attempt | 5.4 |
| Touchdowns | 0 |
| Interceptions | 2 |
| Sacks | 3 |
| QBR | 11.7 |
| Passer Rating | 39.3 |
The most important issue was not simply the completion percentage. The combination of low efficiency, two interceptions and three sacks made it difficult for Cleveland to maintain offensive momentum.
Flacco’s 184 passing yards were not enough to compensate for the lost possessions. Cleveland’s team passing total was 170 yards because the team statistic accounts for sack yardage.
The game also illustrated how an effective opening drive can become less meaningful when later possessions break down.
Flacco’s first series was excellent. He completed his first five attempts and helped Cleveland travel 88 yards for a touchdown. But the offense could not reproduce that efficiency consistently.
That context matters when reading the quarterback statistics. A box score identifies production, but it does not by itself explain every factor behind that production.
Dillon Gabriel’s Limited Appearance
Dillon Gabriel attempted one pass and completed none.
His statistical line was:
- 0 completions
- 1 attempt
- 0 yards
- 0 touchdowns
- 0 interceptions
- 0 sacks
With only one passing attempt, there is not enough statistical evidence to draw a meaningful performance conclusion about Gabriel from this game.
This is an important distinction when analyzing player statistics. A player with one passing attempt should not be evaluated in the same way as a quarterback who attempted 34 passes.
Jared Goff’s Passing Statistics
Jared Goff completed 16 of 27 passes for 168 yards and two touchdowns. He threw one interception and was not sacked.
| Statistic | Jared Goff |
| Completions | 16 |
| Attempts | 27 |
| Completion Rate | 59.3% |
| Passing Yards | 168 |
| Yards Per Attempt | 6.2 |
| Touchdowns | 2 |
| Interceptions | 1 |
| Sacks | 0 |
| QBR | 56.2 |
| Passer Rating | 86.7 |
Goff did not produce a huge passing-yard total, but his performance was more efficient in the areas that directly affected scoring.
His 6.2 yards per attempt exceeded Cleveland’s team figure of 4.5. More importantly, Detroit protected the football better and avoided sacks.
Goff’s two touchdown passes went to Amon-Ra St. Brown, who finished with seven catches for 70 yards.
The passing comparison demonstrates why raw yardage can be misleading. Cleveland had slightly more individual quarterback passing yards from Flacco, but Detroit’s passing attack produced two touchdowns and fewer negative plays.
Quinshon Judkins Leads Cleveland’s Rushing Attack
Quinshon Judkins was Cleveland’s leading rusher.
He carried the ball 21 times for 82 yards and scored one touchdown. His 3.9 yards per carry represented the majority of Cleveland’s rushing production.
| Statistic | Quinshon Judkins |
| Carries | 21 |
| Rushing Yards | 82 |
| Average | 3.9 |
| Touchdowns | 1 |
| Long Run | 11 yards |
Judkins also contributed as a receiver, catching four passes for 33 yards.
That gives him 115 yards from scrimmage across rushing and receiving production, making him one of the more involved Cleveland offensive players in the game.
His workload is particularly notable because Cleveland’s entire rushing attack produced 79 net rushing yards on 27 attempts.
The broader takeaway is that Cleveland leaned heavily on Judkins, but Detroit generally prevented explosive runs.
Jahmyr Gibbs Provides Detroit’s Most Efficient Rushing Production
Jahmyr Gibbs was Detroit’s leading rusher.
He carried 15 times for 91 yards, averaging 6.1 yards per carry, and scored one touchdown. His longest run covered 24 yards.
| Statistic | Jahmyr Gibbs |
| Carries | 15 |
| Rushing Yards | 91 |
| Average | 6.1 |
| Touchdowns | 1 |
| Long Run | 24 yards |
Gibbs also caught two passes for six yards.
His 91 rushing yards represented a major part of Detroit’s 109-yard rushing total.
The efficiency difference between Gibbs and Judkins is particularly interesting. Judkins received more rushing attempts, but Gibbs averaged 6.1 yards per carry compared with Judkins’ 3.9.
That helped Detroit generate more yardage with fewer rushing attempts.
David Montgomery’s Numbers
David Montgomery carried nine times for 12 yards.
His average of 1.3 yards per carry was modest, but the Detroit rushing attack did not depend on one player producing every yard.
Detroit finished with 109 rushing yards as a team, with Gibbs supplying the most explosive contribution.
Montgomery also received one target but did not record a reception.
Detroit’s Receiving Leaders
Amon-Ra St. Brown produced the game’s most productive receiving performance.
He caught seven passes on seven targets for 70 yards and two touchdowns.
| Detroit Receiver | Receptions | Targets | Yards | TD | Long |
| Amon-Ra St. Brown | 7 | 7 | 70 | 2 | 25 |
| Jameson Williams | 2 | 8 | 40 | 0 | 27 |
| Sam LaPorta | 3 | 4 | 39 | 0 | 27 |
| Kalif Raymond | 2 | 3 | 13 | 0 | 7 |
| Jahmyr Gibbs | 2 | 3 | 6 | 0 | 4 |
St. Brown was especially efficient because he caught every pass thrown his way.
His seven receptions also accounted for nearly half of Jared Goff’s 16 completions.
Jameson Williams produced 40 yards on only two catches. His 20.0 yards per reception helped give Detroit an explosive receiving element even though his target volume was higher than his reception total.
Sam LaPorta added 39 yards on three receptions.
Together, the three leading Detroit receivers combined for 149 yards.
Cleveland’s Receiving Leaders
Cleveland’s receiving production was spread across several players.
| Cleveland Receiver | Receptions | Targets | Yards | TD | Long |
| Isaiah Bond | 3 | 6 | 58 | 0 | 35 |
| Jerry Jeudy | 3 | 9 | 48 | 0 | 33 |
| Quinshon Judkins | 4 | 4 | 33 | 0 | 16 |
| Harold Fannin Jr. | 2 | 6 | 24 | 0 | 13 |
| David Njoku | 2 | 3 | 11 | 0 | 9 |
| Cedric Tillman | 1 | 2 | 6 | 0 | 6 |
| Jerome Ford | 1 | 2 | 4 | 0 | 4 |
Isaiah Bond led Cleveland in receiving yardage with 58 yards.
His three receptions averaged 19.3 yards, and he produced the team’s longest reception of 35 yards.
Jerry Jeudy recorded 48 yards on three catches from nine targets. The difference between his targets and receptions is noteworthy because Cleveland needed more successful completions to sustain drives.
Judkins was the only Cleveland player with more than three receptions, catching all four of his targets.
Cleveland’s Passing Game Had Explosive Plays, But Not Enough Sustained Success
One of the more revealing details in the cleveland browns vs detroit lions match player stats is the contrast between Cleveland’s receiving averages and its final offensive output.
The Browns recorded 184 receiving yards among their listed receivers, while their team passing figure was 170 yards after accounting for sacks.
They had several sizable completions, including catches of 35 yards by Isaiah Bond and 33 yards by Jerry Jeudy.
But explosive plays alone were not enough.
Cleveland completed only 16 passes on 35 team attempts. The offense also converted just three of its 14 third-down opportunities.
That means the Browns had moments of offensive productivity without consistently converting those moments into extended possessions.
Detroit’s Defense Creates the Biggest Statistical Separation
Detroit’s defense recorded three sacks, 10 passes defended and nine quarterback hits.
Aidan Hutchinson led the pass rush with two sacks, two tackles for loss and four quarterback hits.
Alex Anzalone added one sack and one pass defended.
| Detroit Defender | Tackles | Sacks | TFL | PD | QB Hits |
| Jack Campbell | 11 | 0 | 1 | 0 | 0 |
| Derrick Barnes | 7 | 0 | 0 | 0 | 1 |
| Alex Anzalone | 6 | 1 | 0 | 1 | 1 |
| Terrion Arnold | 6 | 0 | 0 | 0 | 0 |
| Brian Branch | 5 | 0 | 1 | 3 | 0 |
| Aidan Hutchinson | 4 | 2 | 2 | 0 | 4 |
Hutchinson’s four quarterback hits stand out because pressure can affect a quarterback even when a play does not end in a sack.
Detroit also intercepted Flacco twice through D.J. Reed and Kerby Joseph.
Reed returned his interception 34 yards, while Joseph recorded no return yardage.
Aidan Hutchinson’s Impact
Hutchinson’s statistics are a strong example of why defensive evaluation requires more than the tackle column.
He finished with four tackles, two sacks, two tackles for loss and four quarterback hits.
Four quarterback hits were the most among Detroit’s listed defenders.
The sacks directly affected Cleveland’s passing efficiency, while the pressure numbers indicate that Hutchinson was consistently involved in disrupting the quarterback.
Detroit’s defense finished with three total sacks, compared with none for the Browns.
That difference was significant because Cleveland’s offense was already struggling to generate efficient passing plays.
Jack Campbell Leads Detroit in Tackles
Jack Campbell recorded 11 tackles, including seven solo tackles and one tackle for loss.
He led all Detroit defenders in total tackles.
The number is useful when looking at the volume of defensive involvement, although tackles alone do not indicate whether a defender dominated the game. Campbell’s role can be better understood alongside Detroit’s overall defensive performance, including the 10 passes defended and three sacks.
Cleveland’s Defensive Leaders
Cleveland’s defense had several players with strong tackle totals despite the 34-point result.
Ronnie Hickman and Carson Schwesinger each recorded nine tackles.
Devin Bush added eight tackles.
| Cleveland Defender | Tackles | Solo | Sacks | TFL | QB Hits |
| Ronnie Hickman | 9 | 4 | 0 | 1 | 0 |
| Carson Schwesinger | 9 | 4 | 0 | 0 | 0 |
| Devin Bush | 8 | 6 | 0 | 0 | 0 |
| Grant Delpit | 5 | 4 | 0 | 0 | 0 |
| Maliek Collins | 5 | 1 | 0 | 0 | 1 |
| Jerome Baker | 3 | 1 | 0 | 1 | 1 |
Cleveland’s defense recorded 63 tackles, four tackles for loss and five quarterback hits.
The Browns also intercepted Goff once through Denzel Ward.
However, Cleveland did not record a sack.
That defensive pressure gap is one of the clearest statistical differences between the teams.
Turnovers Changed the Game
Turnovers were arguably the most important statistical category.
Cleveland committed three turnovers:
- Two interceptions
- One lost fumble
Detroit committed one turnover:
- One interception
The Browns therefore finished with a minus-two turnover margin.
Detroit’s defense converted its takeaways into additional opportunities, while Cleveland’s lone interception of Goff did not offset its own mistakes.
This is especially important because total yardage was relatively close.
Detroit did not need to gain hundreds more yards than Cleveland. It needed to make better use of possessions.
Third Down Efficiency
Third down was another major separator.
Cleveland converted only 3 of 14 third downs.
Detroit converted 6 of 14.
| Team | Third-Down Conversion | Percentage |
| Cleveland | 3/14 | 21.4% |
| Detroit | 6/14 | 42.9% |
Detroit’s conversion rate was exactly twice Cleveland’s.
This helped explain why the Lions could score 34 points despite running only 56 offensive plays compared with Cleveland’s 65.
The Browns actually ran nine more plays.
That is a critical point for anyone studying the box score. More plays do not automatically mean a more productive offense.
Red-Zone Efficiency
Detroit was perfect in the red zone.
The Lions finished 3-for-3.
Cleveland went 1-for-2.
| Team | Red-Zone Trips | Scores | Conversion |
| Cleveland | 2 | 1 | 50% |
| Detroit | 3 | 3 | 100% |
This difference is directly reflected in the final score.
Detroit maximized its opportunities when it reached scoring territory.
Cleveland did not.
Red-zone performance often becomes more important than overall yardage in games where the teams finish relatively close in total offensive production.
Time of Possession Was Misleading
Cleveland held the ball for 31:44.
Detroit held the ball for 28:16.
At first glance, that might suggest Cleveland controlled the game.
It did not.
The Browns had more possession time, but much of that time did not become points.
Detroit scored 34 points in fewer total offensive plays and with less possession time.
That tells us that Cleveland’s possession advantage was not matched by offensive efficiency.
The official statistics also show Cleveland with 65 total plays and Detroit with 56.
This is one of the clearest examples of why time of possession should be treated as context rather than as a standalone measure of performance.
Special Teams Statistics
Special teams also contributed to the overall statistical picture.
Cleveland
Andre Szmyt converted one of two field-goal attempts and made his only extra-point attempt, finishing with four points.
Corey Bojorquez punted seven times for 314 yards, averaging 44.9 yards per punt. Four of his punts finished inside the 20-yard line.
DeAndre Carter returned five kickoffs for 129 yards, averaging 25.8 yards per return.
Detroit
Jake Bates converted both field-goal attempts and all four extra-point attempts for 10 points.
Jack Fox punted five times for 221 yards, averaging 44.2 yards per punt, with all five punts placed inside the 20.
Kalif Raymond was particularly effective in punt returns.
He returned five punts for 76 yards, averaging 15.2 yards per return, and recorded a 65-yard punt return touchdown.
That special teams touchdown was a major scoring contribution.
Kalif Raymond’s Punt Return Touchdown
Raymond’s punt return touchdown deserves special attention because it came outside the traditional offensive statistics.
Detroit’s defense and special teams helped produce the separation that the offense did not need to create entirely by itself.
The Lions’ defense recorded a defensive touchdown according to the team statistics supplied, while Raymond’s punt return also provided a major special teams contribution.
For readers analyzing the game, this is another reason to examine the complete box score instead of focusing only on quarterback and running-back numbers.
The Most Important Statistical Difference
If the entire game is reduced to one comparison, turnovers and efficiency provide the clearest explanation.
Cleveland:
- 249 total yards
- 170 passing yards
- 79 rushing yards
- 3 turnovers
- 3/14 on third down
- 1/2 in the red zone
Detroit:
- 277 total yards
- 168 passing yards
- 109 rushing yards
- 1 turnover
- 6/14 on third down
- 3/3 in the red zone
The yardage difference was only 28 yards.
The scoring difference was 24 points.
That gap demonstrates how strongly field position, possession value and finishing drives affected the game.
Cleveland’s Offensive Challenges
The Browns faced several statistical problems simultaneously.
Inefficient Passing
Flacco completed fewer than half of his attempts and threw two interceptions.
Limited Rushing Efficiency
Cleveland averaged only 2.9 yards per rushing attempt as a team.
Poor Third-Down Conversion
The Browns converted only 21.4 percent of third downs.
Turnovers
Three turnovers created additional opportunities for Detroit.
Red-Zone Conversion
Cleveland scored on only one of two red-zone trips.
These problems reinforced each other. An offense that struggles on third down gets fewer opportunities to extend drives. Turnovers end possessions immediately. Poor red-zone conversion prevents yardage from becoming points.
Detroit’s Offensive Strengths
Detroit’s offense did not need a massive passing performance from Goff.
Instead, it combined several efficient elements.
The Lions:
- Ran for 109 yards
- Averaged 4.9 yards per offensive play
- Completed 16 of 27 passes
- Threw two touchdown passes
- Avoided sacks
- Converted 43 percent of third downs
- Scored on every red-zone trip
Gibbs supplied explosive rushing production.
St. Brown converted all seven of his targets into receptions and scored twice.
Williams provided 40 receiving yards on two catches.
That balance helped Detroit maintain control without requiring an enormous statistical performance from any single offensive category.
What the Player Stats Reveal About the Game
The cleveland browns vs detroit lions match player stats reveal a game in which efficiency mattered more than volume.
Cleveland had:
- More offensive plays
- More possession time
- More quarterback passing yards from Flacco
- The same number of first downs as Detroit
Yet Detroit won comfortably.
Why?
Because the Lions were more effective when opportunities mattered most.
They turned three red-zone trips into three scores. They committed one turnover compared with Cleveland’s three. Also they produced more rushing yards and avoided sacks.
The Browns’ offense showed some explosive receiving ability, but those individual plays were not frequent enough to overcome the negative plays.
Player Stat Leaders at a Glance
Cleveland Leaders
Passing: Joe Flacco, 16/34, 184 yards
Rushing: Quinshon Judkins, 21 carries, 82 yards, 1 TD
Receiving: Isaiah Bond, 3 receptions, 58 yards
Tackles: Ronnie Hickman and Carson Schwesinger, 9 each
Interceptions: Denzel Ward, 1
Kick Returns: DeAndre Carter, 5 returns, 129 yards
Detroit Leaders
Passing: Jared Goff, 16/27, 168 yards, 2 TD
Rushing: Jahmyr Gibbs, 15 carries, 91 yards, 1 TD
Receiving: Amon-Ra St. Brown, 7 receptions, 70 yards, 2 TD
Tackles: Jack Campbell, 11
Sacks: Aidan Hutchinson, 2
Interceptions: D.J. Reed and Kerby Joseph, 1 each
Punt Returns: Kalif Raymond, 5 returns, 76 yards, 1 TD
Frequently Asked Questions
What was the final score between the Browns and Lions?
The Detroit Lions defeated the Cleveland Browns 34-10 on September 28, 2025, at Ford Field.
Who was Cleveland’s leading rusher?
Quinshon Judkins led Cleveland with 21 carries for 82 yards and one touchdown.
Who led Detroit in rushing?
Jahmyr Gibbs led the Lions with 91 rushing yards on 15 carries and scored one touchdown.
How did Jared Goff perform?
Goff completed 16 of 27 passes for 168 yards, two touchdowns and one interception. He was not sacked.
How many touchdowns did Amon-Ra St. Brown score?
St. Brown caught seven passes for 70 yards and scored two receiving touchdowns.
How many turnovers did each team commit?
Cleveland committed three turnovers, including two interceptions and one lost fumble. Detroit committed one turnover, an interception.
Conclusion
The cleveland browns vs detroit lions match player stats show that the 34-10 result was driven less by a massive difference in total yardage and more by efficiency, turnovers and scoring opportunities.
Detroit gained 277 total yards compared with Cleveland’s 249, but the Lions were much more efficient per play. Gibbs led the rushing attack with 91 yards and a touchdown, while St. Brown delivered seven catches, 70 yards and two touchdowns.
For Cleveland, Judkins was the leading rusher with 82 yards and a touchdown, while Isaiah Bond led the team in receiving yards with 58. Flacco finished with 184 passing yards but threw two interceptions and was sacked three times.
The defensive statistics also mattered. Detroit generated three sacks, including two from Aidan Hutchinson, while the Lions’ secondary intercepted Flacco twice. Cleveland recorded one interception from Denzel Ward but did not sack Goff.
Ultimately, the statistical profile is clear: Cleveland had more plays and more possession, but Detroit made more of its opportunities. The Lions converted twice as many third downs, went 3-for-3 in the red zone and committed two fewer turnovers.

2 Comments