Tampa Bay Buccaneers vs New Orleans Saints Match Player Stats
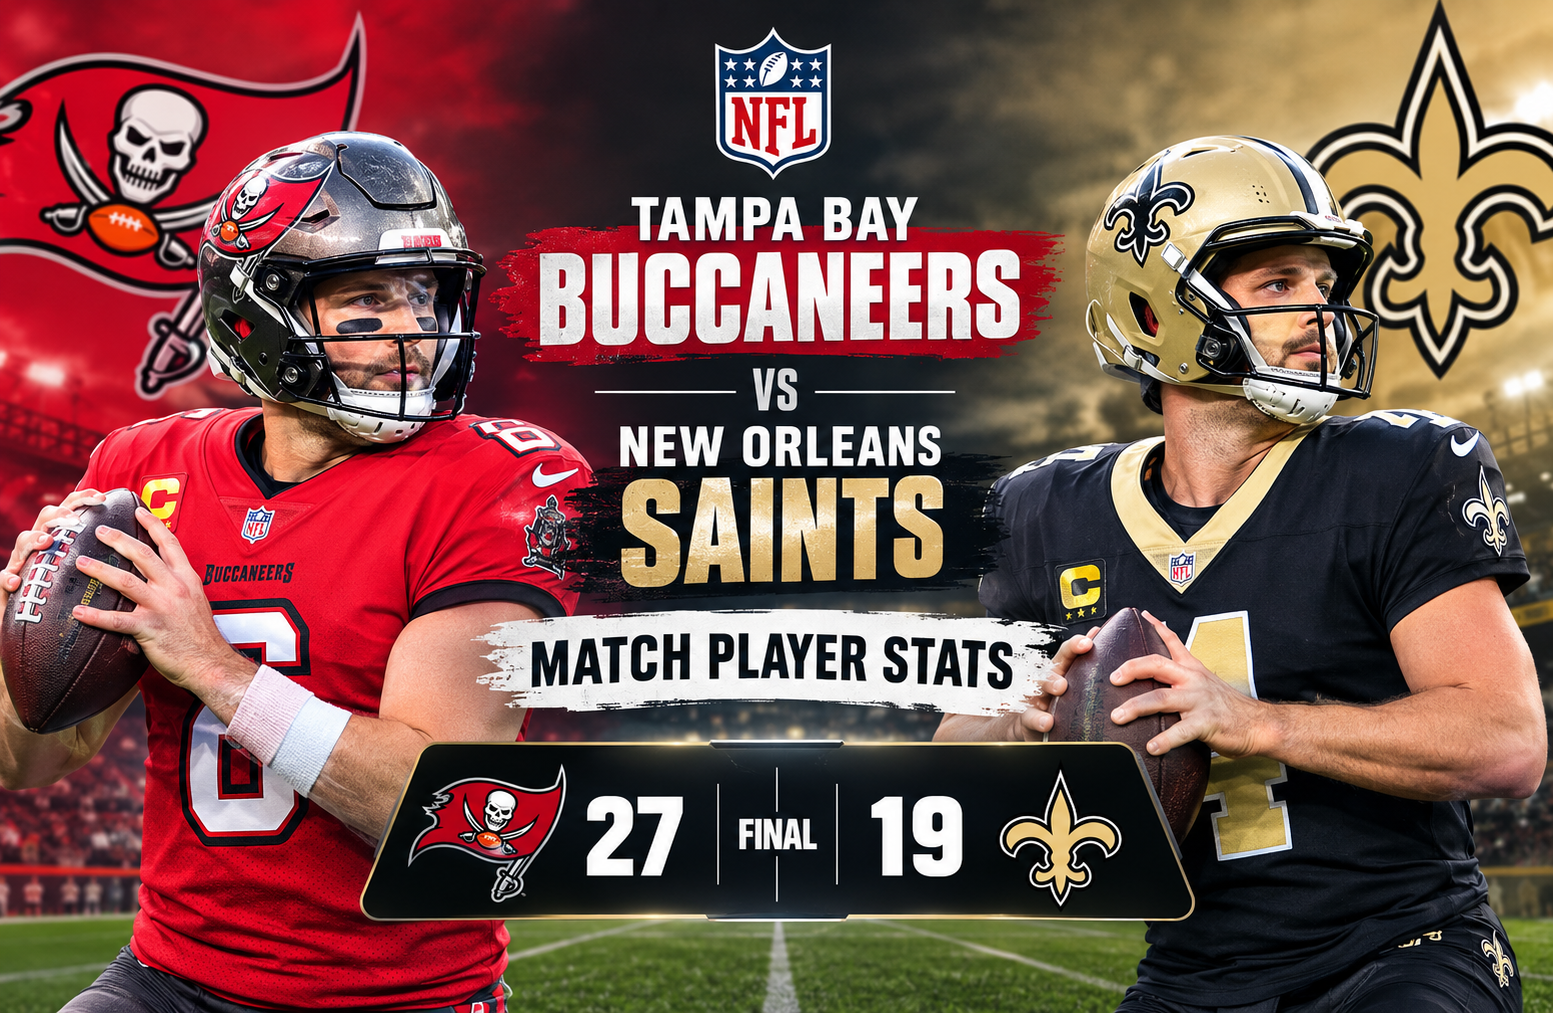
The Tampa Bay Buccaneers vs New Orleans Saints Match Player Stats from January 5, 2025, tell the story of a game that changed direction dramatically after halftime. Tampa Bay defeated New Orleans 27-19 at Raymond James Stadium, overcoming a 16-6 deficit before producing 21 unanswered points across the second half. The result moved Tampa Bay to 10-7 and secured the NFC South title, while New Orleans finished the season at 5-12. (ESPN)
The final score alone does not fully explain how the Buccaneers won. New Orleans actually controlled much of the first half, with Spencer Rattler directing a productive passing attack and the Saints entering halftime with a 10-point advantage. Tampa Bay’s response was built around better rushing efficiency, improved third-down execution, several important plays from Baker Mayfield, and a fourth-quarter offensive surge.
The official NFL game summary shows that Tampa Bay finished with 395 total yards compared with New Orleans’ 292. The Buccaneers also averaged 5.8 yards per rushing attempt compared with 3.4 for the Saints and converted 10 of 16 third downs. Those efficiency differences became especially important as the game moved into the second half. (NFL)
This breakdown examines the individual performances behind those numbers, including quarterback play, rushing production, receiving efficiency, defensive contributions, kicking, special teams, and the most important statistical turning points.
Tampa Bay Buccaneers vs New Orleans Saints Match Player Stats: Game Overview
The January 5 meeting was the 2024 NFL regular season finale for both teams. New Orleans entered the game at 5-11, while Tampa Bay was 9-7 and needed the victory to secure the NFC South. Tampa Bay ultimately finished 10-7 after the comeback win. (ESPN)
Final Score and Quarter Breakdown
| Quarter | New Orleans Saints | Tampa Bay Buccaneers |
| Q1 | 3 | 3 |
| Q2 | 13 | 3 |
| Q3 | 3 | 7 |
| Q4 | 0 | 14 |
| Final | 19 | 27 |
The scoring pattern is one of the clearest ways to understand the game.
New Orleans scored 13 points in the second quarter and carried a 16-6 advantage into halftime. Tampa Bay then scored seven points in the third quarter before taking complete control in the fourth, scoring 14 points without allowing New Orleans to answer.
The Saints’ final points came on a 49-yard Blake Grupe field goal in the third quarter. From there, the Buccaneers finished the game with two touchdowns.
That fourth-quarter sequence transformed a game that appeared to be slipping away from Tampa Bay into a division-clinching victory. (ESPN)
Baker Mayfield’s Complete Offensive Performance
Baker Mayfield’s passing numbers were not overwhelming, but his overall contribution was much larger than the basic passing line suggests.
He completed 21 of 32 attempts for 221 yards, two touchdowns and one interception. His official passer rating was 93.4, while his QBR was listed at 90.0 in the supplied game data.
More importantly, Mayfield contributed 68 rushing yards on nine carries.
That rushing production was a major part of Tampa Bay’s comeback.
Mayfield averaged 7.6 yards per rushing attempt and produced a 28-yard run, giving the Saints defense another problem to account for when defending Tampa Bay’s passing game.
The official game report records Tampa Bay with 179 rushing yards on 31 attempts. That was 115 more rushing yards than New Orleans produced. (NFL)
Mayfield’s Fourth-Quarter Impact
Mayfield’s most important work came late.
With Tampa Bay trailing 19-13 in the third quarter, the Buccaneers began finding more success on offense. The game-winning sequence eventually came in the fourth quarter when Mayfield connected with Jalen McMillan for a 32-yard touchdown.
That play tied the game at 19-19 before the extra point gave Tampa Bay a 20-19 lead.
Mayfield’s legs then became important on the next major scoring drive. His 28-yard run helped Tampa Bay maintain possession and move toward the Saints’ end zone. Bucky Irving eventually finished the drive with an 11-yard rushing touchdown.
The NFL’s Week 18 analysis specifically highlighted Mayfield’s fourth-quarter running and passing as central to Tampa Bay’s comeback. (NFL)
Spencer Rattler’s Passing Numbers
Spencer Rattler produced one of his more productive passing games of the season.
He completed 26 of 42 passes for 240 yards and one touchdown without throwing an interception. His average was 5.7 yards per attempt, and the supplied data lists his passer rating at 85.4 with a 53.9 QBR.
The raw passing yardage was actually higher than Mayfield’s 221 yards.
That makes the final result particularly interesting.
The Saints did not lose because Rattler threw multiple interceptions or because their quarterback completely collapsed. Instead, Tampa Bay’s advantage came from a combination of rushing production, third-down efficiency, defensive pressure at key moments and better finishing.
The Saints’ official postgame notes also point out that Rattler completed passes to 10 different New Orleans players in the first half. His 26 completions were the highest total of his rookie season. (NFL Clubs)
Rattler’s Distribution
Rattler’s passing attack was spread around the formation rather than concentrated entirely on one player.
Juwan Johnson was his leading receiving target, while Marquez Valdes-Scantling, Foster Moreau, Cedrick Wilson Jr. and Dante Pettis also contributed.
This distribution helped New Orleans sustain drives early, but the offense struggled to produce points after halftime.
The contrast is important: New Orleans generated 228 net passing yards, but the team produced only 64 rushing yards and 292 total yards. Tampa Bay generated 179 rushing yards and 216 net passing yards for 395 total yards. (NFL)
Bucky Irving’s Rushing Production
Bucky Irving was one of the most important players in the Buccaneers‘ offensive game plan.
He carried the ball 19 times for 89 yards, averaging 4.7 yards per attempt. His longest run went for 25 yards, and he scored the touchdown that effectively sealed the game.
Irving’s contribution mattered because Tampa Bay consistently created manageable situations on the ground.
The Buccaneers averaged 5.8 yards per rushing attempt as a team. That number is substantially higher than New Orleans’ 3.4-yard average.
Tampa Bay also ran the ball 31 times compared with only 19 rushing attempts for New Orleans.
That 12-carry difference helped Tampa Bay maintain offensive balance while also controlling the clock.
Baker Mayfield as a Rushing Threat
Mayfield’s 68 rushing yards deserve special attention because they were not simply a small supplementary contribution.
His nine carries produced 7.6 yards per attempt, and his longest run covered 28 yards.
That meant Tampa Bay’s quarterback was responsible for nearly as many rushing yards as its leading running back.
The Saints therefore had to account for Mayfield when defending third-down situations and passing formations.
This is one of the clearest examples of why quarterback rushing numbers should not be treated as secondary statistics. In a close game, several successful scrambles can change field position, extend drives and force defenders to hesitate.
Sean Tucker and Tampa Bay’s Secondary Rushing Contributions
Sean Tucker added 16 yards on two carries, averaging 8.0 yards per attempt.
His longest run went for 14 yards.
Jalen McMillan also carried once for six yards.
Combined with Irving and Mayfield, these contributions gave Tampa Bay a diversified rushing attack.
The team did not depend exclusively on one ball carrier. Instead, the Buccaneers used their quarterback, primary back and supporting runners to produce 179 rushing yards.
That was one of the clearest statistical advantages in the game.
New Orleans Saints Rushing Attack
New Orleans struggled to generate consistent rushing production.
Clyde Edwards-Helaire led the Saints with eight carries for 26 yards. He averaged 3.3 yards per attempt and had a longest run of 12 yards.
Jamaal Williams also received eight carries but gained only 15 yards.
Jordan Mims added 12 yards on two carries, while Rattler rushed once for 11 yards.
The complete team total was 64 rushing yards on 19 attempts.
That 3.4-yard average placed significant pressure on Rattler and the passing game.
When a team averages fewer than four yards per rush while facing a defense that can generate pressure, sustaining drives becomes much harder.
Juwan Johnson Leads New Orleans Receivers
Juwan Johnson was arguably the most productive Saints receiver from a yardage standpoint.
He caught six passes for 80 yards on seven targets, averaging 13.3 yards per reception. His longest catch covered 26 yards.
The Saints’ official postgame notes described Johnson as a consistent target for Rattler and noted that the 80 receiving yards represented a season best for him. The performance also helped him finish the season with a career-high 548 receiving yards. (NFL Clubs)
Johnson’s performance showed that New Orleans could create explosive plays through the passing game.
The problem was consistency after halftime.
New Orleans finished with 240 gross passing yards, but the Saints lost 12 yards on two sacks, leaving them with 228 net passing yards. (NFL)
Mike Evans’ Nine-Catch Performance
Mike Evans led Tampa Bay in receptions and receiving yards.
He finished with nine catches for 89 yards on 14 targets.
His average was 9.9 yards per reception, and his longest reception was 14 yards.
The numbers may look less explosive than Jalen McMillan’s receiving line, but Evans’ workload tells another story.
Fourteen targets represented nearly half of Tampa Bay’s 31 pass attempts.
Evans was repeatedly involved in important situations, and his final reception became one of the defining moments of the game.
With 36 seconds remaining and Tampa Bay already leading 27-19, Mayfield completed a short pass to Evans for nine yards. That reception pushed Evans beyond 1,000 receiving yards for the season.
According to ESPN, Evans entered the game needing 85 yards to reach 1,000. His nine-yard final catch gave him 89 yards for the game and allowed him to reach the milestone for the 11th consecutive season, matching Jerry Rice’s NFL record for consecutive 1,000-yard seasons. (ESPN)
Jalen McMillan’s Game-Changing Touchdown
Jalen McMillan provided one of the biggest individual plays of the afternoon.
He caught five passes for 74 yards on six targets.
His average of 14.8 yards per reception was Tampa Bay’s best among players with multiple catches and a positive yardage total.
Most importantly, his longest catch was a 33-yard touchdown.
That fourth-quarter touchdown came with 10:18 remaining and put Tampa Bay ahead.
McMillan’s performance illustrates an important statistical distinction.
Mike Evans produced the larger workload, but McMillan supplied the explosive scoring play that changed the scoreboard.
Both forms of production mattered.
Tampa Bay’s Other Receiving Contributions
Devin Culp caught two passes for 36 yards, averaging 18.0 yards per catch. His longest reception covered 20 yards.
Payne Durham caught two passes for 16 yards and scored a touchdown.
Sterling Shepard added one reception for 11 yards.
Bucky Irving caught two passes, although his receiving total was negative five yards.
Tampa Bay finished with 21 receptions for 221 receiving yards and two passing touchdowns.
The offense therefore combined moderate volume with several efficient individual contributions.
New Orleans Receiving Depth
New Orleans finished with 26 receptions for 240 yards and one touchdown.
In addition to Johnson, Marquez Valdes-Scantling caught three passes for 33 yards, while Foster Moreau recorded four receptions for 31 yards.
Cedrick Wilson Jr. added three catches for 22 yards.
Dante Pettis produced the Saints’ only receiving touchdown, catching two passes for 16 yards.
Clyde Edwards-Helaire also caught one pass for 14 yards.
The Saints’ receiving statistics demonstrate that Rattler had multiple options available. However, the offense could not maintain its first-half scoring pace.
Defensive Player Stats
Defense played a different role for each team.
Tampa Bay recorded 61 total tackles, two sacks, seven tackles for loss and six quarterback hits.
New Orleans recorded 60 tackles, one sack, six tackles for loss and one quarterback hit.
The difference in quarterback pressure was particularly notable.
Tampa Bay Defensive Leaders
Josh Hayes led Tampa Bay with 12 tackles, including 10 solo tackles.
Lavonte David recorded nine tackles and four solo stops.
Zyon McCollum added six tackles, four solo tackles and four passes defended.
Yaya Diaby recorded five tackles, one sack, four tackles for loss and four quarterback hits.
Vita Vea added three tackles, one sack, one tackle for loss and one quarterback hit.
Diaby’s four quarterback hits were especially significant because they show pressure beyond the official sack total.
A defensive front can affect a quarterback without producing a sack on every pressure. Hits, hurried throws and disrupted timing can all contribute to a defensive performance.
New Orleans Defensive Leaders
Demario Davis led New Orleans with nine tackles, including six solo stops, along with one pass defended.
Will Harris recorded eight tackles, all eight solo, plus one tackle for loss and one pass defended.
Nephi Sewell also recorded eight tackles, five solo tackles, two tackles for loss and one sack.
Jordan Howden intercepted one Mayfield pass and returned it three yards.
The Saints therefore did produce individual defensive plays, but Tampa Bay’s offense ultimately generated more sustained efficiency.
Third-Down Efficiency Was a Major Difference
One of the most revealing numbers from the official NFL team statistics is third-down conversion rate.
Tampa Bay converted 10 of 16 third-down opportunities.
New Orleans converted only 3 of 13.
That means Tampa Bay converted 62.5 percent of its third downs, while New Orleans converted only 23.1 percent. (NFL)
This is a much larger difference than the final score might suggest.
Third-down efficiency affects possession, field position and fatigue.
Tampa Bay also controlled the ball for 32:16 compared with 27:44 for New Orleans.
The Buccaneers therefore had both more efficient third-down offense and more possession time.
Total Yardage Shows Tampa Bay’s Offensive Advantage
The total yardage numbers were decisive.
| Category | Saints | Buccaneers |
| Total yards | 292 | 395 |
| Passing yards | 228 net | 216 net |
| Rushing yards | 64 | 179 |
| Offensive plays | 63 | 64 |
| Yards per play | 4.6 | 6.2 |
| First downs | 19 | 20 |
| Third down | 3/13 | 10/16 |
| Time of possession | 27:44 | 32:16 |
New Orleans actually gained more net passing yards, 228 to 216.
But Tampa Bay’s 179 rushing yards created a 103-yard advantage in total offense.
The Buccaneers also averaged 6.2 yards per offensive play compared with 4.6 for New Orleans.
This is why simply comparing quarterback passing yards can be misleading.
Rattler threw for 240 yards.
Mayfield threw for 221.
Yet Tampa Bay’s offense produced 395 total yards, while New Orleans finished with 292.
Turnovers and Ball Security
The turnover numbers were relatively unusual because Tampa Bay won despite committing the only turnover.
Mayfield threw one interception, which was recorded by Jordan Howden.
Tampa Bay also had one fumble, although it was not lost.
New Orleans did not record a fumble and did not throw an interception.
The Saints therefore finished with zero turnovers, while Tampa Bay had one.
Despite that disadvantage, the Buccaneers still won by eight points.
That tells us the game’s outcome was driven more heavily by offensive efficiency and late execution than by turnover margin.
Special Teams Player Stats
Special teams played an important supporting role.
Blake Grupe
New Orleans kicker Blake Grupe was perfect on field goals.
He converted all four attempts, including a long of 49 yards, and made his only extra-point attempt.
His 13 points accounted for a large portion of New Orleans’ total.
The Saints’ four field goals also demonstrate that the offense was moving the ball well enough to reach scoring range, but it did not consistently finish those possessions with touchdowns.
Chase McLaughlin
Tampa Bay’s Chase McLaughlin made both of his field-goal attempts.
His longest field goal was 52 yards.
He also converted all three extra-point attempts.
He finished with nine points.
Sean Tucker’s Kick Returns
Sean Tucker provided useful field-position value on kick returns.
He returned three kicks for 88 yards, averaging 29.3 yards per return, with a longest return of 36 yards.
Those returns helped Tampa Bay start possessions with favorable field position.
Punt Returns
Dante Pettis returned one punt for nine yards for New Orleans.
Trey Palmer returned one punt for Tampa Bay for zero yards.
The return numbers were not a dominant factor, but Tucker’s kickoff production was a useful complementary contribution.
The Fourth Quarter Changed the Game
The fourth quarter is the most important statistical chapter of this matchup.
Tampa Bay entered the quarter trailing 19-13.
The Buccaneers then produced two touchdowns.
The first came when Mayfield connected with McMillan for a 32-yard touchdown.
The second came when Irving ran 11 yards for a touchdown after Tampa Bay had sustained another long drive.
The Buccaneers’ two fourth-quarter scoring drives were part of a broader trend: their offense became more efficient as the game progressed.
New Orleans, meanwhile, failed to score in the fourth quarter.
That combination produced the 14-0 fourth-quarter margin that ultimately decided the game.
Why Tampa Bay’s Running Game Mattered So Much
The most useful lesson from the player statistics is the relationship between rushing efficiency and late-game control.
Tampa Bay ran 31 times for 179 yards.
New Orleans ran 19 times for 64 yards.
The Buccaneers therefore produced 115 more rushing yards.
That advantage allowed Tampa Bay to keep its offense balanced and reduce the pressure on Mayfield to win every passing situation.
Mayfield’s own rushing production amplified the effect.
A defense preparing for Irving also had to account for quarterback scrambles.
That creates uncertainty for defenders, particularly on third downs.
How New Orleans Built Its First-Half Lead
The Saints’ first-half success was not accidental.
They scored 16 points before halftime and held Tampa Bay to only six.
Rattler consistently distributed the ball, while Johnson produced several important gains.
Grupe was also perfect on his first three field-goal attempts before the halftime period ended.
Dante Pettis’ touchdown provided the Saints with their only touchdown of the game.
New Orleans entered halftime with a 16-6 advantage.
The major problem was sustaining that offensive level after halftime.
How Tampa Bay Reversed the Momentum
Tampa Bay’s comeback developed in stages.
First came the Payne Durham touchdown in the third quarter.
Then New Orleans responded with another Grupe field goal to make the score 19-13.
The decisive shift came in the fourth quarter.
McMillan’s 32-yard touchdown gave Tampa Bay its first lead since the opening quarter.
Irving’s 11-yard touchdown later extended that advantage to eight points.
The Buccaneers’ ability to produce touchdowns rather than settle for field goals was a major difference.
New Orleans had four successful field goals.
Tampa Bay had only two.
But the Buccaneers produced three touchdowns.
That touchdown differential explains much of the scoring gap.
What the Player Stats Reveal About the Matchup
The Tampa Bay Buccaneers vs New Orleans Saints Match Player Stats provide several useful conclusions.
1. Passing yardage alone does not tell the full story
Rattler threw for 240 yards.
Mayfield threw for 221.
Yet Tampa Bay won comfortably in total offense.
The difference was rushing.
2. Third-down execution separated the offenses
Tampa Bay converted 62.5 percent of its third downs.
New Orleans converted 23.1 percent.
That is a major possession and drive-sustainability advantage.
3. McMillan supplied the explosive receiving play
Evans dominated targets and receptions.
McMillan produced the key 32-yard touchdown.
Both players contributed in different ways.
4. Irving delivered the finishing touchdown
Irving’s 89 rushing yards were important throughout the game, but his fourth-quarter touchdown gave Tampa Bay the final cushion.
5. Rattler’s performance was better than the final score suggests
The rookie quarterback completed 26 passes for 240 yards and one touchdown without an interception.
His individual statistics were respectable, but New Orleans struggled to maintain overall offensive efficiency.
A Closer Look at Efficiency
Efficiency statistics help explain the matchup more clearly than raw totals.
Tampa Bay averaged 6.2 yards per offensive play.
New Orleans averaged 4.6.
That means Tampa Bay gained roughly 35 percent more yardage per play.
The Buccaneers also averaged 5.8 yards per rushing attempt, compared with 3.4 for New Orleans.
Those numbers show that Tampa Bay was more productive whenever it successfully established offensive rhythm.
New Orleans, meanwhile, needed more plays to create comparable yardage.
That becomes increasingly difficult when third-down conversion is also poor.
Red-Zone Performance
Tampa Bay scored touchdowns on two of three red-zone opportunities.
New Orleans scored a touchdown on one of two red-zone opportunities.
The Buccaneers therefore converted 67 percent of their red-zone trips into touchdowns, while New Orleans converted 50 percent.
Again, this was not an enormous difference in percentage terms, but the touchdown count mattered.
New Orleans repeatedly relied on Grupe’s field-goal accuracy.
Tampa Bay ultimately found the end zone three times.
A Statistical View of the Final Result
The final 27-19 score can be understood through several connected factors:
- Tampa Bay produced 395 total yards.
- Tampa Bay rushed for 179 yards.
- Tampa Bay converted 10 of 16 third downs.
- Tampa Bay controlled possession for more than 32 minutes.
- Tampa Bay scored three touchdowns.
- The Buccaneers scored 14 fourth-quarter points.
- New Orleans produced only 64 rushing yards.
- New Orleans converted just 3 of 13 third downs.
- The Saints failed to score in the fourth quarter.
No single statistic explains everything.
Together, however, they create a clear picture of how the Buccaneers turned a 10-point halftime deficit into an eight-point victory.
Historical Importance of Mike Evans’ Performance
The final reception by Evans deserves separate mention because it extended an important NFL achievement.
Evans entered the game needing 85 receiving yards to reach 1,000 for the season.
He finished with 89.
That gave him 1,004 yards for the 2024 regular season and extended his streak to 11 consecutive 1,000-yard seasons.
ESPN reported that the achievement matched Jerry Rice’s NFL record for consecutive 1,000-yard seasons. (ESPN)
The sequence also illustrates how individual milestones can intersect with team objectives.
Tampa Bay was already in position to secure the division title.
Instead of simply ending the game, the Buccaneers continued to run their offense, and Mayfield found Evans for the needed yardage.
New Orleans’ Defensive Effort
The Saints defense did have productive individual performances.
Demario Davis recorded nine tackles.
Will Harris and Nephi Sewell each recorded eight.
Sewell also added a sack and two tackles for loss.
Jordan Howden intercepted Mayfield.
However, the Saints defense eventually struggled to stop Tampa Bay’s rushing attack and fourth-quarter drives.
The one-sack total also stands out when compared with Tampa Bay’s two sacks and six quarterback hits.
Tampa Bay’s Defensive Response
Tampa Bay’s defense was not dominant for the entire game.
New Orleans scored 16 first-half points and moved the ball effectively through the air.
But the defense held the Saints scoreless in the fourth quarter.
Yaya Diaby’s four quarterback hits were especially notable, while Vita Vea recorded a sack and a quarterback hit.
Zyon McCollum’s four passes defended also showed the secondary’s contribution.
The defense ultimately made enough stops for the offense to complete the comeback.
What the Official Numbers Confirm
The official NFL game summary confirms that Tampa Bay had:
- 395 total yards
- 179 rushing yards
- 216 net passing yards
- 20 first downs
- 10-of-16 third-down conversion
- 32:16 possession
- Three touchdowns
New Orleans finished with:
- 292 total yards
- 64 rushing yards
- 228 net passing yards
- 19 first downs
- 3-of-13 third-down conversion
- 27:44 possession
- One touchdown
These numbers provide a stronger explanation of the game than the final score alone. (NFL)
Frequently Asked Questions
Who won the Buccaneers vs Saints game on January 5, 2025?
The Tampa Bay Buccaneers defeated the New Orleans Saints 27-19 at Raymond James Stadium. (NFL)
How many passing yards did Baker Mayfield have?
Baker Mayfield completed 21 of 32 passes for 221 yards, with two touchdowns and one interception.
How many rushing yards did Bucky Irving have?
Bucky Irving rushed 19 times for 89 yards and one touchdown, averaging 4.7 yards per carry.
Who led the Saints in receiving?
Juwan Johnson led New Orleans with six receptions for 80 yards on seven targets.
How many yards did Mike Evans have?
Mike Evans caught nine passes for 89 yards on 14 targets. His final nine-yard catch helped him reach 1,000 receiving yards for the season.
What was the biggest statistical difference between the teams?
The biggest difference was rushing production. Tampa Bay gained 179 rushing yards on 31 attempts, while New Orleans gained 64 yards on 19 attempts. Tampa Bay also had a major advantage on third down, converting 10 of 16 opportunities compared with New Orleans’ 3 of 13. (NFL)
Conclusion
The Tampa Bay Buccaneers vs New Orleans Saints Match Player Stats from January 5, 2025, show a game defined by adjustment and late execution.
New Orleans controlled the first half and entered halftime with a 16-6 lead. Spencer Rattler completed 26 passes for 240 yards and avoided an interception, while Juwan Johnson delivered 80 receiving yards and Blake Grupe made all four of his field-goal attempts.
Tampa Bay changed the game’s direction through its rushing attack and improved third-down execution. Bucky Irving rushed for 89 yards and scored the decisive rushing touchdown. Baker Mayfield added 68 rushing yards while throwing two touchdown passes. Jalen McMillan supplied the crucial 32-yard touchdown reception, and Mike Evans finished with nine catches for 89 yards.
The team statistics reinforce the individual performances. Tampa Bay gained 395 total yards to New Orleans’ 292 and converted 10 of 16 third downs. The Buccaneers also controlled possession for 32:16 and produced 179 rushing yards.
Most importantly, Tampa Bay scored 14 points in the fourth quarter while New Orleans scored none.
The final 27-19 result therefore reflects more than a simple comeback. It was a game in which Tampa Bay gradually turned superior rushing efficiency, third-down execution and late-game offensive production into a division-clinching victory. (NFL)