Miami Dolphins vs Detroit Lions Match Player Stats
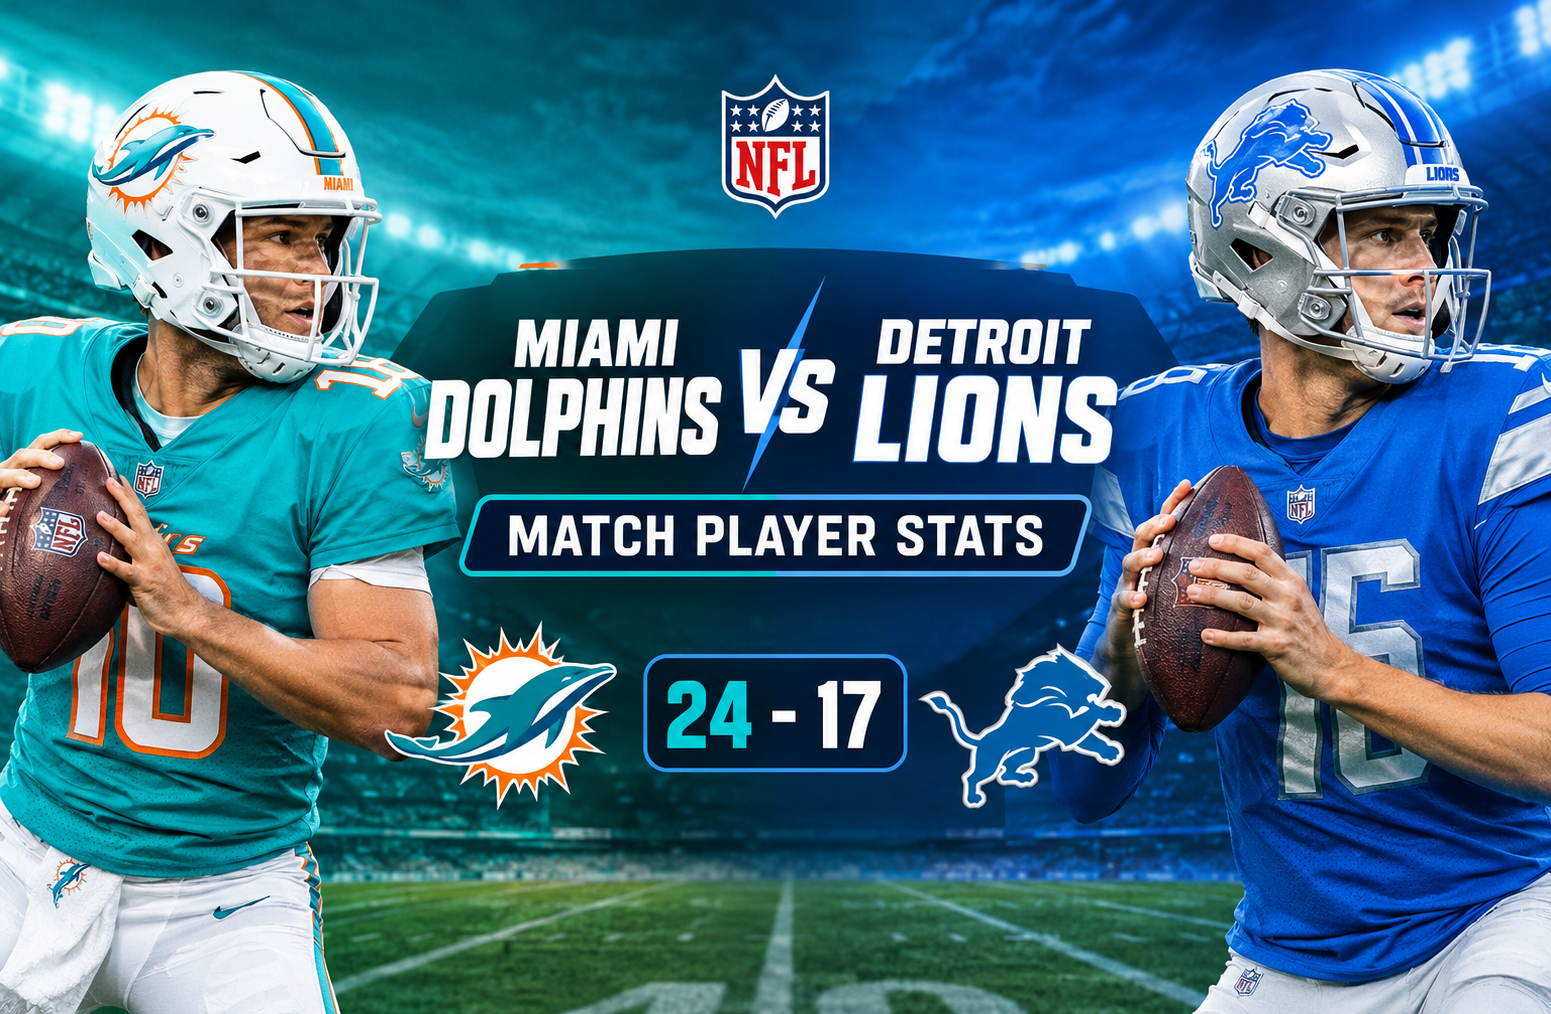
The Miami Dolphins vs Detroit Lions Match Player Stats from the August 16, 2025, NFL preseason game reveal how Miami secured a 24-17 victory over Detroit through efficient passing, productive receiving, and timely defensive plays. The Dolphins finished with 259 passing yards, three passing touchdowns, and 97 rushing yards, while the Lions recorded 170 passing yards and 104 rushing yards. Although Detroit built a second-quarter lead, Miami responded with 14 points in the second half to complete the comeback.
The preseason matchup at Detroit gave both teams an opportunity to evaluate quarterbacks, running backs, receivers, defensive players, and special teams contributors. Miami’s Quinn Ewers delivered two touchdown passes without an interception, while Zach Wilson added another passing touchdown. For Detroit, Kyle Allen threw two touchdown passes, and receiver Jackson Meeks led the Lions with 93 receiving yards and a score.
This detailed breakdown covers the final score, individual player statistics, quarterback efficiency, rushing production, receiving performances, defensive contributions, and special teams results. It also explains what the numbers reveal about the contest and why individual preseason performances should be evaluated in the context of playing time, opponent quality, and team development.
Miami Dolphins vs Detroit Lions Match Player Stats: Game Overview
The Dolphins won 24-17 after overcoming a 14-point second-quarter surge by the Lions. Miami’s ability to score in the opening and closing quarters proved decisive, while Detroit’s offense struggled to add points after halftime.
| Game Detail | Information |
| Matchup | Miami Dolphins vs Detroit Lions |
| Date | August 16, 2025 |
| Competition | NFL preseason |
| Venue designation | Detroit was the home team |
| Final score | Miami Dolphins 24, Detroit Lions 17 |
| Winning team | Miami Dolphins |
| Winning margin | 7 points |
| Miami’s first-quarter points | 7 |
| Detroit’s first-quarter points | 0 |
| Miami’s second-quarter points | 0 |
| Detroit’s second-quarter points | 14 |
| Miami’s third-quarter points | 7 |
| Detroit’s third-quarter points | 3 |
| Miami’s fourth-quarter points | 10 |
| Detroit’s fourth-quarter points | 0 |
The final result tells only part of the story. Detroit controlled the scoring during the second quarter, but Miami regained momentum after halftime. The Dolphins’ 10-point fourth quarter created the final seven-point margin.
Because this was a preseason contest, the result should be viewed primarily as a record of player evaluation and execution rather than a direct forecast of regular-season success. Preseason lineups, substitutions, and playing time differ from those used in competitive regular-season games.
Quarter-by-Quarter Scoring Breakdown
The scoring sequence helps explain how Miami turned an uneven contest into a victory.
| Quarter | Miami Dolphins | Detroit Lions | Quarter Winner |
| First quarter | 7 | 0 | Miami |
| Second quarter | 0 | 14 | Detroit |
| Third quarter | 7 | 3 | Miami |
| Fourth quarter | 10 | 0 | Miami |
| Final score | 24 | 17 | Miami Dolphins |
First quarter: Miami establishes an early advantage
Miami opened the game with seven points, while Detroit failed to score in the first quarter. That early lead gave the Dolphins a positive start and demonstrated their ability to convert an opening scoring opportunity.
Second quarter: Detroit takes control
The Lions responded with 14 unanswered points in the second quarter. Miami did not score during the period, allowing Detroit to build a seven-point lead at halftime.
This stretch showed that Detroit could generate scoring opportunities even though its overall offensive production finished below Miami’s.
Third quarter: The Dolphins begin their comeback
Miami scored seven points in the third quarter, while Detroit managed only a field goal. The scoring gap narrowed, and the Dolphins entered the final quarter with the opportunity to take control.
Fourth quarter: Miami completes the turnaround
The Dolphins added 10 points in the fourth quarter and held Detroit scoreless. That combination of offensive production and defensive resistance decided the game.
The key takeaway is the change in scoring after halftime. Detroit scored all 14 of its second-quarter points before adding just three more for the remainder of the contest.
Team Statistics Comparison
The team totals provide a clearer view of how Miami won despite Detroit recording more rushing yards.
| Statistical Category | Miami Dolphins | Detroit Lions |
| Passing yards | 259 | 170 |
| Rushing yards | 97 | 104 |
| Combined passing and rushing yards | 356 | 274 |
| Pass completions | 26 | 20 |
| Pass attempts | 40 | 30 |
| Completion percentage | 65.0% | 66.7% |
| Passing touchdowns | 3 | 2 |
| Rushing touchdowns | 0 | 0 |
| Interceptions thrown | 0 | 1 |
| Sacks recorded by defense | 3 | 1 |
| Total tackles | 75 | 69 |
| Tackles for loss | 6 | 5 |
| Quarterback hits | 8 | 2 |
| Passes defended | 3 | 10 |
| Final points | 24 | 17 |
Note: Combined offensive yardage above adds the supplied passing and rushing totals. It excludes any separate adjustments that may appear in other official statistical summaries.
Passing production created the largest statistical difference
Miami gained 89 more passing yards than Detroit. The Dolphins also completed six more passes and threw one additional touchdown.
Detroit actually posted a slightly higher completion percentage, but that figure does not measure the full value of a passing performance. Total yardage, touchdown production, interceptions, sacks, and the ability to sustain drives all contribute to offensive effectiveness.
Miami’s 259 passing yards and three touchdown passes gave the team a clear advantage through the air.
Detroit had the edge in rushing yardage
The Lions recorded 104 rushing yards on 30 attempts, compared with Miami’s 97 yards on 20 attempts.
Detroit’s additional rushing attempts helped increase its total yardage, but Miami averaged 4.9 yards per carry compared with Detroit’s 3.5. The difference suggests that Miami’s rushing attempts were more productive on a per-carry basis, even though neither team recorded a rushing touchdown.
Defensive pressure favored Miami
Miami recorded three sacks and eight quarterback hits, while Detroit recorded one sack and two quarterback hits. The Dolphins also forced an interception.
Those numbers point to a meaningful difference in disruption. Even when a defense does not produce a turnover, pressure can affect a quarterback’s timing, limit the available passing window, and force an offense into less favorable situations.
Miami Dolphins Passing Stats
Miami’s passing offense was led by Zach Wilson and Quinn Ewers. Both quarterbacks avoided interceptions, and Ewers produced two touchdown passes despite attempting fewer passes than Wilson.
| Quarterback | Completions/Attempts | Completion % | Passing Yards | Yards per Attempt | TDs | INTs | Sacks Taken | Passer Rating |
| Zach Wilson | 15/23 | 65.2% | 151 | 6.6 | 1 | 0 | 1 | 98.3 |
| Quinn Ewers | 11/17 | 64.7% | 116 | 6.8 | 2 | 0 | 0 | 123.7 |
| Team total | 26/40 | 65.0% | 259 | 6.7 | 3 | 0 | 1 | 111.0 |
Zach Wilson: 151 passing yards and one touchdown
Wilson completed 15 of 23 passes for 151 yards and one touchdown. He averaged 6.6 yards per attempt and recorded a 98.3 passer rating.
His statistical line reflects a productive passing contribution. Wilson generated more passing yardage than any other Miami quarterback in the game, and he did so without throwing an interception.
However, a quarterback’s total yards alone do not reveal how consistently an offense moved the chains. Completion location, down-and-distance situations, pressure faced, and third-down performance would be needed for a deeper evaluation.
Quinn Ewers: Two touchdown passes without a turnover
Ewers completed 11 of 17 passes for 116 yards and two touchdowns. He averaged 6.8 yards per attempt and posted a 123.7 passer rating.
His two touchdown passes were particularly important because Miami finished with three passing touchdowns overall. Ewers also avoided interceptions and did not take a recorded sack.
The combination of touchdown production and ball security made his statistical performance efficient. His passer rating exceeded Wilson’s, although the difference should be interpreted alongside their respective attempts, situations, and playing time.
A strong preseason performance can help a young quarterback demonstrate command of the offense, but one game does not establish long-term readiness or predict future regular-season results.
What Miami’s quarterback numbers reveal
Three details stand out:
- Both quarterbacks completed more than 64% of their passes.
- Neither Miami quarterback threw an interception.
- Ewers accounted for two of the team’s three passing touchdowns.
Miami’s combined 65% completion rate and 111.0 passer rating indicate a productive passing performance. The offense also spread its production across two quarterbacks rather than depending on one player for every successful drive.
Detroit Lions Passing Stats
Detroit used Kyle Allen and Hendon Hooker at quarterback. Allen produced two touchdown passes, while Hooker had a more difficult statistical outing.
| Quarterback | Completions/Attempts | Completion % | Passing Yards | Yards per Attempt | TDs | INTs | Sacks Taken | Passer Rating |
| Kyle Allen | 14/17 | 82.4% | 124 | 7.3 | 2 | 0 | 1 | 136.3 |
| Hendon Hooker | 6/13 | 46.2% | 61 | 4.7 | 0 | 1 | 2 | 28.0 |
| Team total | 20/30 | 66.7% | 170 | 6.2 as displayed | 2 | 1 | 3 | 91.7 |
Kyle Allen: Efficient passing and two touchdowns
Allen completed 14 of 17 attempts for 124 yards and two touchdowns. His 82.4% completion rate and 136.3 passer rating were the strongest individual quarterback figures in the supplied statistics.
Allen also averaged 7.3 yards per attempt, showing that his high completion rate was accompanied by useful passing production. He did not throw an interception.
His performance was a major contributor to Detroit’s second-quarter scoring surge. The Lions’ challenge was maintaining that production across the full game.
Hendon Hooker: A difficult statistical stretch
Hooker completed six of 13 passes for 61 yards, with no touchdown passes and one interception. He averaged 4.7 yards per attempt and took two sacks.
His 28.0 passer rating reflected the combined effect of limited passing production, the interception, and the absence of a touchdown pass.
These numbers describe his performance in this game, not his overall ability. A fair evaluation would also consider protection, receiver separation, route execution, defensive coverage, and the specific situations in which he entered the contest.
Comparing the Detroit quarterbacks
Allen’s numbers were more efficient across nearly every major passing measure. He completed a higher share of attempts, gained more yards per attempt, threw two touchdowns, and avoided interceptions.
Hooker’s interception and two sacks reduced Detroit’s ability to sustain passing drives. The contrast also helps explain why the Lions’ passing production did not remain consistent throughout the contest.
Miami Dolphins Rushing Stats
Miami’s rushing attack generated 97 yards on 20 carries. Although the team did not score a rushing touchdown, several individual performances provided useful production.
| Player | Carries | Rushing Yards | Yards per Carry | Rushing TDs | Longest Run |
| Ollie Gordon II | 10 | 50 | 5.0 | 0 | 19 |
| Aaron Shampklin | 2 | 32 | 16.0 | 0 | 26 |
| Mike Boone | 3 | 13 | 4.3 | 0 | 8 |
| Jaylen Wright | 4 | 3 | 0.8 | 0 | 3 |
| Quinn Ewers | 1 | -1 | -1.0 | 0 | -1 |
| Team total | 20 | 97 | 4.9 | 0 | 26 |
Ollie Gordon II: Miami’s leading rusher
Gordon led Miami with 50 rushing yards on 10 carries, averaging 5.0 yards per attempt. His longest run covered 19 yards.
Gordon’s workload was larger than that of any other Miami runner in the supplied data. His average also matched the team’s overall rushing rate, making him a productive contributor to the ground game.
He added two receptions for nine receiving yards, giving him a small additional role in the passing attack.
Aaron Shampklin: Big gains on limited carries
Shampklin recorded 32 yards on just two attempts, averaging 16.0 yards per carry. His longest run was 26 yards.
The average is eye-catching, but the sample size matters. With only two carries, a single explosive run can have a major effect on the final average. His performance demonstrates big-play potential in this contest, but additional carries would be needed to assess consistency.
Mike Boone and Jaylen Wright
Boone gained 13 yards on three attempts, averaging 4.3 yards per carry. Wright recorded three yards on four attempts, averaging 0.8.
Their figures show how individual results varied within the same rushing offense. The difference may reflect blocking, defensive alignment, the type of play called, or the down-and-distance situation. The available totals do not establish which factor was responsible.
Miami’s rushing takeaway
Miami averaged more yards per carry than Detroit, but neither side scored on the ground. The Dolphins’ rushing game therefore supported the offense rather than providing a direct source of touchdowns.
Shampklin supplied the most explosive per-carry production, while Gordon delivered the largest volume of rushing yards.
Detroit Lions Rushing Stats
Detroit ran the ball 30 times for 104 yards, averaging 3.5 yards per carry. The Lions used several runners, but no player recorded a rushing touchdown.
| Player | Carries | Rushing Yards | Yards per Carry | Rushing TDs | Longest Run |
| Jacob Saylors | 13 | 39 | 3.0 | 0 | 11 |
| Sione Vaki | 5 | 30 | 6.0 | 0 | 14 |
| Deon Jackson | 4 | 20 | 5.0 | 0 | 8 |
| Craig Reynolds | 6 | 13 | 2.2 | 0 | 7 |
| Kyle Allen | 1 | 1 | 1.0 | 0 | 1 |
| Hendon Hooker | 1 | 1 | 1.0 | 0 | 1 |
| Team total | 30 | 104 | 3.5 | 0 | 14 |
Jacob Saylors: Detroit’s leading rusher by volume
Saylors carried the ball 13 times for 39 yards, averaging 3.0 yards per attempt. He handled the largest share of Detroit’s recorded rushing workload.
His 39 yards led the Lions’ individual rushing totals, but his average was below the team’s 3.5-yard mark. The result suggests that Detroit gained its rushing production through a collection of moderate gains rather than sustained high efficiency from its most-used runner.
Sione Vaki: Strong production per attempt
Vaki gained 30 yards on five carries, averaging 6.0 yards per carry. His longest run was 14 yards.
Among Detroit’s listed runners with multiple carries, Vaki recorded the highest average. His numbers suggest that his rushing opportunities produced useful yardage, although five carries are not enough to establish a reliable long-term trend.
Deon Jackson and Craig Reynolds
Jackson gained 20 yards on four carries, averaging 5.0 yards per attempt. Reynolds gained 13 yards on six carries, averaging 2.2.
Jackson was more productive on a per-carry basis, while Reynolds received more rushing attempts. That distinction matters when assessing a preseason depth chart because workload and efficiency measure different things.
Detroit’s rushing performance in context
The Lions had seven more rushing attempts and gained seven more total rushing yards than Miami. However, their 3.5-yard average trailed Miami’s 4.9.
Detroit’s ground game contributed to the offense’s total yardage, but the supplied statistics show no rushing touchdowns from either team. The decisive scoring difference came through the passing game and the timing of each team’s points.
Miami Dolphins Receiving Stats
Miami’s receiving group was central to the victory. The Dolphins recorded 26 receptions for 267 receiving yards and three receiving touchdowns, with Theo Wease Jr. and Dee Eskridge providing the biggest scoring contributions.
| Receiver | Receptions | Targets | Receiving Yards | Yards per Reception | Receiving TDs | Longest Reception |
| Theo Wease Jr. | 6 | 9 | 80 | 13.3 | 2 | 23 |
| Dee Eskridge | 3 | 6 | 53 | 17.7 | 1 | 27 |
| Tanner Conner | 6 | 7 | 48 | 8.0 | 0 | 13 |
| Tahj Washington | 4 | 5 | 33 | 8.3 | 0 | 9 |
| AJ Henning | 2 | 3 | 16 | 8.0 | 0 | 12 |
| Chris Myarick | 1 | 1 | 13 | 13.0 | 0 | 13 |
| Andrew Armstrong | 1 | 2 | 12 | 12.0 | 0 | 12 |
| Ollie Gordon II | 2 | 2 | 9 | 4.5 | 0 | 14 |
| Erik Ezukanma | 1 | 3 | 3 | 3.0 | 0 | 3 |
| Tarik Black | 0 | 0 | 0 | 0.0 | 0 | 0 |
| Team total | 26 | 40 | 267 | 10.3 | 3 | 27 |
The team receiving total is reproduced from the supplied box-score data. Individual receiving yards can differ from team passing yards because passing and receiving statistics may use different accounting conventions.
Theo Wease Jr.: Miami’s leading receiver
Wease caught six passes for 80 yards and two touchdowns on nine targets. He averaged 13.3 yards per reception and recorded a longest catch of 23 yards.
His two receiving touchdowns were especially important because they accounted for two of Miami’s three passing scores. Wease also led the Dolphins in receiving yards, making him the team’s most productive receiver by both yardage and scoring impact.
His performance illustrates why touchdowns and total yardage should be evaluated together. A receiver can accumulate substantial yardage without scoring, while another can have a smaller total but contribute directly to the final result through red-zone production.
Wease combined both forms of value in this game.
Dee Eskridge: Explosive receiving production
Eskridge finished with three receptions for 53 yards and one touchdown on six targets. His average of 17.7 yards per catch was the highest among Miami’s receivers with recorded receptions.
His longest reception covered 27 yards. That figure tied the longest recorded reception for either team.
Eskridge’s performance provided Miami with a second major scoring threat. His production also gave the offense a way to generate meaningful yardage without relying entirely on short completions.
Tanner Conner: Reliable volume underneath
Conner caught six passes for 48 yards on seven targets. His 85.7% catch rate, calculated from the supplied receiving totals, showed that he converted most of his opportunities into receptions.
He did not record a receiving touchdown, but his six catches matched Wease for the most receptions on the Dolphins. Conner’s role was therefore more about maintaining possession and contributing consistent short-to-intermediate gains than delivering the largest explosive plays.
Tahj Washington and the supporting receivers
Washington recorded four receptions for 33 yards on five targets. His 8.3 yards per reception gave Miami another productive option in the passing game.
Henning added 16 yards on two catches, while Myarick and Armstrong each recorded a reception for more than 10 yards. Gordon contributed two catches for nine yards, giving Miami’s leading rusher a modest role as a receiving option.
These supporting contributions matter in preseason evaluation because coaches are assessing how players perform when opportunities arrive. A small receiving total does not automatically indicate a poor performance, particularly when playing time and target distribution are not fully considered.
Detroit Lions Receiving Stats
Detroit’s receivers recorded 20 receptions for 185 yards and two touchdowns. Jackson Meeks led the group in both catches and receiving yardage, while Isaac TeSlaa also found the end zone.
| Receiver | Receptions | Targets | Receiving Yards | Yards per Reception | Receiving TDs | Longest Reception |
| Jackson Meeks | 7 | 8 | 93 | 13.3 | 1 | 27 |
| Isaac TeSlaa | 4 | 5 | 41 | 10.3 | 1 | 18 |
| Zach Horton | 2 | 4 | 15 | 7.5 | 0 | 9 |
| Dominic Lovett | 2 | 3 | 14 | 7.0 | 0 | 9 |
| Ronnie Bell | 1 | 1 | 11 | 11.0 | 0 | 11 |
| Tom Kennedy | 1 | 1 | 8 | 8.0 | 0 | 8 |
| Jacob Saylors | 1 | 2 | 5 | 5.0 | 0 | 5 |
| Jakobie Keeney-James | 0 | 0 | 0 | 0.0 | 0 | 0 |
| Sione Vaki | 2 | 2 | -2 | -1.0 | 0 | 4 |
| Team total | 20 | 29 | 185 | 9.3 | 2 | 27 |
Jackson Meeks: Detroit’s leading offensive receiver
Meeks delivered seven receptions for 93 yards and one touchdown on eight targets. He averaged 13.3 yards per catch and produced the same 27-yard longest reception recorded by Miami’s Eskridge.
Meeks led Detroit in receiving yards and catches, giving the Lions a reliable target throughout his opportunities. His 93 receiving yards were also the highest individual receiving total by either team.
Although Detroit lost, Meeks’ performance was a clear positive from an individual statistical perspective. His output demonstrated that the Lions could generate productive receiving plays even while their overall passing yardage remained below Miami’s.
Isaac TeSlaa: A second scoring option
TeSlaa recorded four catches for 41 yards and a touchdown on five targets. His 10.3 yards per reception reflected useful production, and his touchdown gave Detroit another player who directly contributed to the scoreboard.
Meeks and TeSlaa combined for 134 receiving yards and two touchdowns. That accounted for most of Detroit’s 185 receiving yards and all two of its recorded receiving touchdowns.
Supporting contributions from Detroit’s receivers
Horton caught two passes for 15 yards, while Lovett added two catches for 14 yards. Bell and Kennedy contributed 11 and eight receiving yards, respectively.
Saylors added a five-yard reception, and Vaki finished with two catches but minus-two net receiving yards in the supplied statistics.
Vaki’s negative receiving total should be interpreted carefully. It reflects the recorded yardage associated with his receiving opportunities, not a conclusion about his overall offensive contribution. His 30 rushing yards, for example, represent a separate part of his performance.
Miami versus Detroit: Receiving comparison
| Receiving Measure | Miami | Detroit | Advantage |
| Receptions | 26 | 20 | Miami |
| Receiving yards | 267 | 185 | Miami |
| Receiving touchdowns | 3 | 2 | Miami |
| Average yards per reception | 10.3 | 9.3 | Miami |
| Longest recorded reception | 27 | 27 | Tie |
| Leading receiver’s yards | 80 | 93 | Detroit |
Miami had the better collective receiving output, but Detroit had the leading individual receiver by yardage. That contrast is important: the Dolphins spread their production across several targets, while Meeks accounted for a large share of the Lions’ receiving total.
Defensive Player and Team Statistics
Defense was another important part of the result. Miami registered more sacks, quarterback hits, total tackles, and tackles for loss. Detroit, however, recorded more passes defended.
| Defensive Category | Miami Dolphins | Detroit Lions |
| Total tackles | 75 | 69 |
| Solo tackles | 35 | 39 |
| Sacks | 3 | 1 |
| Tackles for loss | 6 | 5 |
| Passes defended | 3 | 10 |
| Quarterback hits | 8 | 2 |
| Defensive touchdowns | 0 | 0 |
| Team interceptions | 1 | 0 |
Miami’s defensive pressure
The Dolphins recorded three sacks, eight quarterback hits, and six tackles for loss. They also recorded one interception through Ethan Robinson, who returned it for two yards.
The combination of pressure and a turnover helped Miami limit Detroit’s ability to sustain offensive momentum. Quarterback hits are particularly useful as a supporting measure because they show disruption beyond sacks alone.
However, these totals do not identify every player’s individual tackle or pressure contribution. Without a complete individual defensive box score, it would be inappropriate to assign specific sack totals or tackle totals to defenders who are not identified in the supplied data.
Detroit’s pass defense
Detroit recorded 10 passes defended, compared with Miami’s three. This was the Lions’ clearest advantage in the defensive comparison.
Passes defended can result from different types of plays, including deflections and coverage breakups. The statistic suggests that Detroit disrupted several passing attempts, but it does not by itself show whether those plays occurred on third down, near the goal line, or in low-risk situations.
The Lions also recorded one sack and two quarterback hits. Their ability to defend passes did not translate into a team interception, according to the supplied data.
What the defensive statistics tell us
Miami’s greater pass-rush production and interception total point toward a more disruptive defensive performance. Detroit’s higher number of passes defended shows that its secondary also generated resistance.
The most useful distinction is between disruption and prevention. A defense can break up passes yet still allow touchdowns, while pressure and turnovers can alter the outcome of individual drives. Miami’s three sacks and one interception were part of a broader performance that helped the Dolphins hold Detroit scoreless in the fourth quarter.
Turnovers and Ball Security
Turnovers can change a football game quickly, especially when offenses are still developing timing and evaluating players during preseason action.
| Turnover Category | Miami Dolphins | Detroit Lions |
| Team fumbles | 3 | 0 |
| Fumbles lost | 1 | 0 |
| Fumbles recovered | 2 | 1 |
| Interceptions thrown | 0 | 1 |
| Defensive interceptions recorded | 1 | 0 |
Miami recorded three fumbles and lost one. Detroit recorded no team fumbles but recovered one fumble, according to the supplied team statistics. These entries should be read as the reported box-score categories rather than as a complete play-by-play reconstruction.
Miami’s fumble concerns
AJ Henning recorded one fumble that was lost. Eskridge and Jaylen Wright each recorded a fumble that was not listed as lost, while Tanner Conner and Channing Tindall were credited with recoveries in the supplied data.
The lost fumble is an important counterpoint to Miami’s victory. The offense produced three passing touchdowns, but ball security remained an area worth reviewing.
Detroit’s interception problem
Hooker threw Detroit’s only recorded interception. Miami’s Ethan Robinson was credited with the defensive interception and two return yards.
The interception was particularly relevant because it gave Miami a defensive takeaway without requiring the offense to win every possession through sustained yardage.
Why turnovers require context
A turnover count does not explain every aspect of a team’s ball security. Fumble recoveries, forced fumbles, and interceptions should be checked against the detailed play-by-play record when reconstructing exactly how possession changed.
For this game, the supplied data supports two straightforward conclusions: Miami lost one fumble and intercepted one Detroit pass, while Detroit did not throw an interception-free game overall because Hooker was picked off.
Special Teams Statistics
Special teams contributed field goals, extra points, kick returns, punt returns, and field-position opportunities. The figures show that Detroit had more kick-return yardage and punting volume, while Miami recorded more punt-return yardage.
Kicking statistics
| Kicker | Field Goals | Field-Goal Percentage | Longest Field Goal | Extra Points | Total Kicking Points |
| Jason Sanders, Miami | 1/1 | 100% | 22 yards | 3/3 | 6 |
| Jake Bates, Detroit | 1/1 | 100% | 33 yards | 2/2 | 5 |
Both kickers converted their only recorded field-goal attempt. Sanders made all three extra points, while Bates made two.
The difference in kicking points reflects the supplied scoring totals, including each kicker’s field goals and successful extra points. These figures should not be confused with total team points, which also include touchdowns and other scoring plays.
Kick-return statistics
| Team | Player | Returns | Return Yards | Average | Longest Return |
| Miami | AJ Henning | 2 | 64 | 32.0 | 33 |
| Miami | Dee Eskridge | 1 | 27 | 27.0 | 27 |
| Miami total | 3 | 91 | 30.3 | 33 | |
| Detroit | Jacob Saylors | 2 | 61 | 30.5 | 37 |
| Detroit | Grant Stuard | 2 | 50 | 25.0 | 27 |
| Detroit | Deon Jackson | 1 | 29 | 29.0 | 29 |
| Detroit total | 5 | 140 | 28.0 | 37 |
Detroit accumulated 140 kick-return yards, 49 more than Miami. Saylors recorded the longest kick return in the supplied statistics at 37 yards.
Miami averaged 30.3 yards per kick return, compared with Detroit’s 28.0. That distinction illustrates why total return yardage and return efficiency should be examined separately. Detroit had more opportunities, but Miami gained more yards per return on average.
Punt-return statistics
| Player | Returns | Return Yards | Average | Longest Return |
| AJ Henning, Miami | 3 | 41 | 13.7 | 26 |
| Dee Eskridge, Miami | 2 | 15 | 7.5 | 12 |
| Miami total | 5 | 56 | 11.2 | 26 |
| Detroit team | 0 | 0 | Not applicable | Not applicable |
Miami recorded five punt returns for 56 yards. Detroit had no punt returns listed in the supplied data.
Henning led Miami’s punt-return group in both total yardage and average return distance. His 26-yard longest return was also the longest punt return recorded for the Dolphins.
Punting statistics
| Punter | Punts | Total Yards | Average | Inside the 20 | Longest Punt |
| Jake Bailey, Miami | 2 | 109 | 54.5 | 1 | 59 |
| Ryan Stonehouse, Miami | 2 | 80 | 40.0 | 1 | 42 |
| Miami total | 4 | 189 | 47.3 | 2 | 59 |
| Jack Fox, Detroit | 7 | 355 | 50.7 | 2 | 63 |
Fox punted seven times for 355 yards, averaging 50.7 yards per punt. His longest punt traveled 63 yards.
Miami used Bailey and Stonehouse for four punts combined. Bailey averaged 54.5 yards, while Stonehouse averaged 40.0. Together, the Miami punters averaged 47.3 yards per punt.
Detroit’s greater punt total indicates that the Lions punted more often in the recorded game statistics. It does not, by itself, reveal how many drives stalled because of penalties, failed third downs, or other situations.
Key Player Comparisons From the Game
The most revealing individual comparisons involve the quarterbacks, leading receivers, and running backs. Each group contributed differently to the final result.
Quinn Ewers vs. Kyle Allen
| Statistic | Quinn Ewers | Kyle Allen |
| Completions | 11 | 14 |
| Attempts | 17 | 17 |
| Passing yards | 116 | 124 |
| Passing touchdowns | 2 | 2 |
| Interceptions | 0 | 0 |
| Yards per attempt | 6.8 | 7.3 |
| Passer rating | 123.7 | 136.3 |
Allen had the better completion rate, more passing yards, and higher passer rating. Both quarterbacks threw two touchdown passes without an interception being recorded against them.
Ewers’ contribution helped Miami finish with three passing touchdowns overall, while Allen’s performance helped Detroit build its second-quarter lead. Neither quarterback’s statistics alone explain the final result because the teams used multiple passers and experienced different outcomes in the second half.
Theo Wease Jr. vs. Jackson Meeks
| Statistic | Theo Wease Jr. | Jackson Meeks |
| Receptions | 6 | 7 |
| Targets | 9 | 8 |
| Receiving yards | 80 | 93 |
| Yards per reception | 13.3 | 13.3 |
| Receiving touchdowns | 2 | 1 |
| Longest reception | 23 | 27 |
Meeks led the matchup in receiving yards, but Wease scored twice. Their identical 13.3 yards per reception show that both generated similar average production per catch.
The main difference was scoring impact. Wease’s two touchdowns gave Miami an important advantage in the red zone, while Meeks supplied Detroit with a strong individual receiving performance.
Ollie Gordon II vs. Jacob Saylors
| Statistic | Ollie Gordon II | Jacob Saylors |
| Carries | 10 | 13 |
| Rushing yards | 50 | 39 |
| Yards per carry | 5.0 | 3.0 |
| Rushing touchdowns | 0 | 0 |
| Longest run | 19 | 11 |
Gordon gained 11 more yards on three fewer carries. His 5.0-yard average was two yards per attempt higher than Saylors’ 3.0.
Saylors handled a larger rushing workload, but Gordon produced more yardage with fewer opportunities. This comparison highlights why rushing totals should be considered alongside attempts rather than used as a standalone measure of performance.
What the Match Player Statistics Reveal
The numbers support several useful conclusions about the game, while also showing why preseason statistics require careful interpretation.
1. Miami’s passing offense was the main statistical advantage
Miami finished with 259 passing yards, compared with Detroit’s 170. The Dolphins also recorded three passing touchdowns, one more than the Lions.
The difference was not simply a matter of attempting more passes. Miami completed 26 of 40 attempts, while Detroit completed 20 of 30. Both teams produced completion rates above 65%, but Miami generated more passing yardage and more passing scores.
2. Detroit’s rushing volume did not translate into greater efficiency
Detroit recorded 104 rushing yards on 30 attempts. Miami gained 97 yards on 20 attempts.
The Lions had the higher total, but the Dolphins averaged 4.9 yards per carry compared with Detroit’s 3.5. That gap suggests Miami generated more yardage from each rushing opportunity.
Neither team scored a rushing touchdown, so the ground game did not directly account for a touchdown advantage.
3. Miami had more disruptive defensive production
The Dolphins recorded three sacks, eight quarterback hits, and one interception. Detroit recorded one sack, two quarterback hits, and no interceptions.
These figures support the view that Miami generated more disruption against the opposing passing game. However, a complete defensive evaluation would also require pressure rates, missed tackles, coverage assignments, and individual player participation.
4. Both teams had productive individual receivers
Wease finished with 80 yards and two touchdowns for Miami. Meeks recorded 93 yards and one touchdown for Detroit.
The comparison demonstrates that the losing team can still produce the game’s leading individual performer in a statistical category. Meeks’ yardage total exceeded Wease’s, but Miami received more collective receiving production and an additional receiving touchdown.
5. The fourth quarter determined the outcome
Miami scored 10 points in the fourth quarter, while Detroit scored none. The Dolphins’ ability to finish the game with points while keeping the Lions off the scoreboard was central to the seven-point victory.
This is one of the clearest findings from the scoring record. Detroit’s second-quarter surge created a lead, but Miami produced the stronger finish.
How to Interpret Preseason Player Statistics Correctly
Preseason box scores are useful, but they should not be treated as complete measures of player ability.
First, playing time varies. One quarterback may face a starting defensive unit, while another may play against reserves. Those situations can change completion rates, passing yardage, and the difficulty of individual throws.
Second, sample sizes are often small. Shampklin’s 16.0 yards per carry came from two rushing attempts. That is an impressive result for the game, but it is not enough to establish a dependable rushing average over a full season.
Third, team results depend on several units. A quarterback’s statistics may be affected by receiver separation, offensive line protection, dropped passes, and field position. Defensive results likewise depend on coverage, pass rush, tackling, and the situation in which a player enters the game.
Finally, individual statistics should be checked against the official box score before publication. Totals, team-level accounting, and individual receiving figures can sometimes appear different across statistical displays. The supplied figures are therefore best understood as the reported game data rather than a substitute for a complete play-by-play audit.
For the original record, consult the ESPN box score for the Dolphins vs. Lions preseason game.
Frequently Asked Questions
1. Who won the Miami Dolphins vs Detroit Lions game on August 16, 2025?
The Miami Dolphins defeated the Detroit Lions 24-17 in their NFL preseason matchup on August 16, 2025. Miami overcame a second-quarter deficit by scoring 17 points in the second half while allowing only three.
2. How many passing yards did the Dolphins record?
Miami recorded 259 team passing yards. Zach Wilson threw for 151 yards, and Quinn Ewers added 116 yards in the supplied individual statistics. The quarterbacks combined for three passing touchdowns and no interceptions.
3. Who was Miami’s leading receiver against Detroit?
Theo Wease Jr. led Miami with six receptions for 80 yards and two receiving touchdowns. Dee Eskridge added 53 yards and one touchdown on three receptions.
4. Who led the Lions in receiving yards?
Jackson Meeks led Detroit with 93 receiving yards on seven catches. He also recorded one receiving touchdown and a longest reception of 27 yards.
5. Which quarterback had the highest passer rating?
Kyle Allen recorded the highest individual passer rating in the supplied statistics, finishing with a 136.3 rating. He completed 14 of 17 passes for 124 yards and two touchdowns without an interception.
6. What was the biggest statistical difference between the teams?
Passing production was the clearest difference. Miami recorded 259 passing yards and three passing touchdowns, while Detroit finished with 170 passing yards and two passing touchdowns. Miami also recorded three sacks and one interception.
Conclusion
The Miami Dolphins’ 24-17 preseason victory over the Detroit Lions on August 16, 2025, was shaped by passing efficiency, receiving touchdowns, defensive pressure, and a strong finish. Miami gained 259 passing yards, recorded three passing touchdowns, and generated more sacks and quarterback hits than Detroit.
Quinn Ewers threw two touchdown passes without an interception, while Zach Wilson contributed 151 passing yards and another touchdown. Theo Wease Jr. led Miami’s receivers with 80 yards and two scores. For Detroit, Kyle Allen delivered two touchdown passes, Jackson Meeks led all receivers with 93 yards, and Sione Vaki averaged 6.0 yards per carry.
Detroit produced more total rushing yards and recorded more passes defended, but Miami’s passing advantage and second-half scoring proved decisive. The final score reflects the Dolphins’ stronger finish, while the individual statistics offer a useful look at the performances of players competing for opportunities during preseason.
The most important distinction is that these figures describe one preseason game, not a complete assessment of either team’s regular-season potential. Playing time, competition, consistency, and performance across multiple games are all necessary for a broader evaluation.