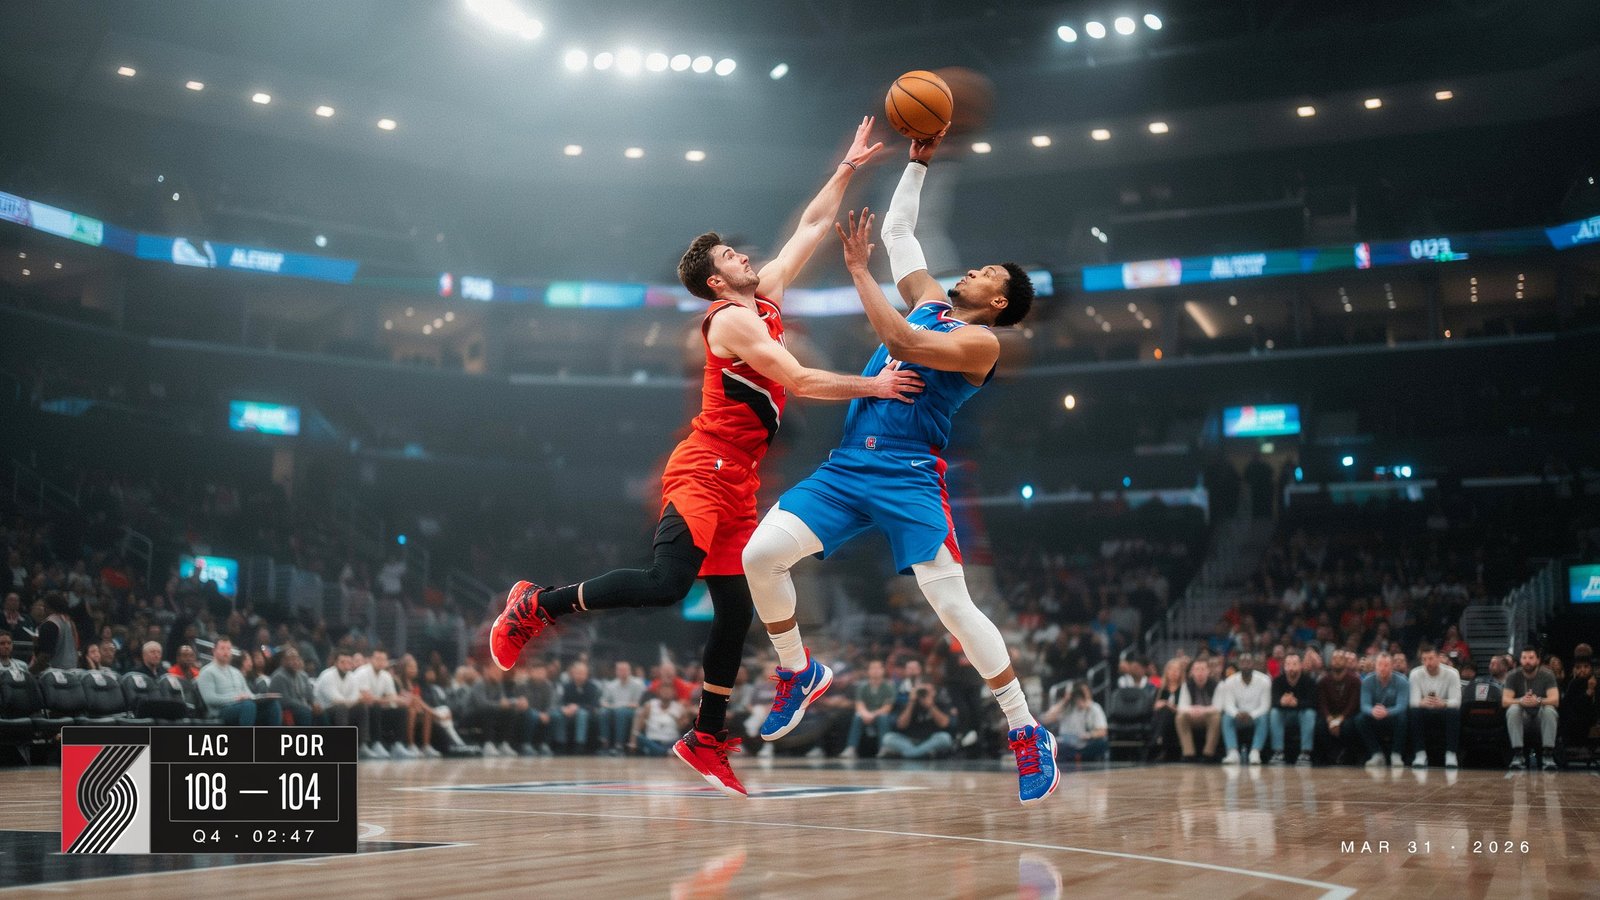
la clippers vs portland trail blazers match player stats
The la clippers vs portland trail blazers match player stats from March 31, 2026, tell a much more interesting story than the final score alone. Portland defeated the LA Clippers 114-104 at Intuit Dome, but the Clippers actually shot better from the field. The difference came from what happened after missed shots, particularly Portland’s work on the offensive glass, its second-chance scoring, and the production of Jrue Holiday and Deni Avdija.
The game was played at Intuit Dome in Inglewood, California, in front of 17,927 fans. Portland finished with a 39-38 record and improved its road mark to 18-21, while the Clippers entered at 39-37 with a 21-16 home record. The result left Los Angeles with a 2-1 lead in the season series at that point, with another meeting scheduled for April 10 in Portland.
For readers looking for a quick answer, Jrue Holiday led all scorers with 30 points, Deni Avdija produced 28 points, 11 rebounds, and 8 assists, while Kawhi Leonard paced the Clippers with 23 points, 8 rebounds, and 3 assists. Darius Garland added 20 points and 4 assists for Los Angeles.
But the numbers become more useful when they are connected. Portland won despite making fewer field goals and shooting a lower overall percentage. The Trail Blazers created 18 offensive rebounds and 32 second-chance points, turning extra possessions into the central statistical advantage of the night.
Game summary and final score
The final score was:
Portland Trail Blazers 114, LA Clippers 104
The quarter-by-quarter scoring was:
| Quarter | Portland | LA Clippers |
| 1st | 34 | 31 |
| 2nd | 28 | 15 |
| 3rd | 29 | 28 |
| 4th | 23 | 30 |
| Final | 114 | 104 |
The second quarter was the defining stretch. Portland outscored Los Angeles 28-15, creating a 13-point advantage in that period alone. At halftime, the Trail Blazers led 62-46.
Los Angeles recovered somewhat after halftime. The Clippers won the fourth quarter 30-23 and cut into the deficit, but the large second-quarter gap proved too difficult to erase. NBA’s official game summary notes that Portland led the rest of the way after taking control during the opening period.
The game also had a notable late-third-quarter sequence. Scoot Henderson hit a step-back three-pointer at the end of the third quarter, capping a 16-5 Portland run and putting the Trail Blazers ahead 91-74 entering the final period.
That sequence matters because it explains why the Clippers’ fourth-quarter improvement did not translate into a comeback. Los Angeles scored 30 in the final quarter, but it entered the period down 17.
la clippers vs portland trail blazers match player stats: top performers
The individual numbers reveal two different paths to production.
Portland received its biggest scoring night from Jrue Holiday, while Deni Avdija provided the most complete all-around statistical performance. Los Angeles relied heavily on Kawhi Leonard, Darius Garland, Brook Lopez, and John Collins.
Jrue Holiday: 30 points
Jrue Holiday was Portland’s leading scorer with 30 points in 31:49.
His shooting line was particularly important:
- 10-of-21 from the field
- 7-of-15 from three-point range
- 3-of-3 from the free-throw line
- 6 rebounds
- 2 assists
- 2 steals
- 3 turnovers
- +6 plus/minus
Holiday’s seven made three-pointers were a major part of Portland’s perimeter production. He attempted 15 threes, meaning more than 70 percent of his field-goal attempts came from beyond the arc. He made 46.7 percent of those attempts.
This was not simply a high-volume scoring performance. Holiday also contributed six rebounds and two steals while finishing with a positive plus/minus.
The context is important. Portland did not need Holiday to create every possession. Avdija handled significant playmaking responsibility, allowing Holiday to attack opportunities as a scorer.
Deni Avdija: 28 points, 11 rebounds, 8 assists
Deni Avdija arguably produced the most complete individual statistical line of the game.
He finished with:
- 28 points
- 11 rebounds
- 8 assists
- 8-of-15 field goals
- 1-of-4 three-pointers
- 11-of-12 free throws
- 2 steals
- 2 turnovers
- +8 plus/minus
Avdija’s combination of scoring, rebounding, and passing is one of the clearest explanations for Portland’s control of the game. He was not dependent on three-point shooting. Instead, he generated value through efficient two-point scoring, free throws, rebounding, and ball movement.
His 11 rebounds were the highest total by any player in the game. His eight assists were also the game high. That means Avdija directly contributed to Portland’s offense in several different ways.
His free-throw performance deserves special attention. Avdija made 11 of 12 attempts, or 91.7 percent. The NBA recap noted that he had reached at least 10 free-throw attempts in 31 games during the season, second in the league at that point behind Luka Doncic.
For a box-score reader, this is a useful reminder that points alone do not describe offensive impact. Avdija’s 28 points were only two fewer than Holiday’s 30, but his eight assists and 11 rebounds added another dimension to his contribution.
Kawhi Leonard: 23 points
Kawhi Leonard led the Clippers with 23 points, 8 rebounds, and 3 assists.
His complete line included:
- 7-of-15 field goals
- 0-of-5 three-pointers
- 9-of-10 free throws
- 8 rebounds
- 3 assists
- 1 steal
- 1 block
- 3 turnovers
- 35:30 played
Leonard’s 23 points came despite going 0-for-5 from three. He compensated by shooting 9-of-10 at the free-throw line and 7-of-15 overall from the field.
The performance also continued a remarkable scoring streak. The Associated Press report carried by NBA noted that Leonard had scored at least 20 points in 52 consecutive games at that point.
His eight rebounds tied Avdija’s total for the Clippers’ team-high, but Los Angeles could not turn that individual production into enough overall possession control.
Darius Garland: 20 points and 4 assists
Darius Garland finished with:
- 20 points
- 7-of-17 field goals
- 3-of-8 three-pointers
- 3-of-3 free throws
- 2 rebounds
- 4 assists
- 2 steals
- 1 block
- 5 turnovers
- 37:15 played
Garland provided important perimeter scoring and playmaking, but his five turnovers were a significant part of his statistical profile in this game.
His three made three-pointers helped Los Angeles stay competitive from outside. However, Portland’s overall advantage on the glass meant that the Clippers’ shooting efficiency did not fully translate into possession control.
Full Portland Trail Blazers player stats
The complete Portland box score shows that the production was broader than the two leading scorers.
| Player | MIN | PTS | REB | AST | FG | 3PT | FT | STL | BLK | TO | +/- |
| Jrue Holiday | 31:49 | 30 | 6 | 2 | 10-21 | 7-15 | 3-3 | 2 | 0 | 3 | +6 |
| Deni Avdija | 34:08 | 28 | 11 | 8 | 8-15 | 1-4 | 11-12 | 0 | 0 | 2 | +8 |
| Toumani Camara | 32:35 | 17 | 7 | 0 | 7-16 | 3-9 | 0-0 | 2 | 1 | 1 | -5 |
| Scoot Henderson | 28:49 | 15 | 3 | 2 | 5-14 | 3-6 | 2-2 | 0 | 0 | 4 | -3 |
| Donovan Clingan | 28:54 | 4 | 4 | 1 | 2-5 | 0-2 | 0-0 | 1 | 1 | 2 | -12 |
| Kris Murray | 31:09 | 7 | 7 | 6 | 3-9 | 0-4 | 1-1 | 0 | 0 | 0 | +19 |
| Robert Williams III | 18:00 | 6 | 7 | 1 | 3-3 | 0-0 | 0-0 | 0 | 1 | 1 | +22 |
| Matisse Thybulle | 23:55 | 5 | 2 | 1 | 2-5 | 1-4 | 0-0 | 3 | 1 | 1 | +7 |
| Caleb Love | 1:06 | 2 | 0 | 0 | 1-1 | 0-0 | 0-0 | 0 | 0 | 0 | +1 |
| Sidy Cissoko | 8:30 | 0 | 1 | 1 | 0-2 | 0-1 | 0-0 | 0 | 0 | 0 | +8 |
| Blake Wesley | 1:06 | 0 | 0 | 0 | 0-0 | 0-0 | 0-0 | 0 | 0 | 0 | 0 |
Portland’s official box score confirms the major individual totals and the team’s 114-point output.
One particularly interesting number is Kris Murray’s +19. He scored only seven points, but Portland was substantially better during his minutes. Robert Williams III posted an even higher +22 despite scoring only six points.
Plus/minus should never be treated as a standalone measure of individual performance. Still, these numbers support a larger point: Portland’s victory was not dependent only on its two top scorers.
Full LA Clippers player stats
Los Angeles also received useful contributions beyond Leonard and Garland.
| Player | MIN | PTS | REB | AST | FG | 3PT | FT | STL | BLK | TO | +/- |
| Kawhi Leonard | 35:30 | 23 | 8 | 3 | 7-15 | 0-5 | 9-10 | 1 | 1 | 3 | -6 |
| Darius Garland | 37:15 | 20 | 2 | 4 | 7-17 | 3-8 | 3-3 | 2 | 1 | 5 | -7 |
| Brook Lopez | 35:46 | 18 | 7 | 2 | 7-16 | 2-8 | 2-2 | 0 | 3 | 1 | -11 |
| John Collins | 31:13 | 17 | 6 | 1 | 7-8 | 3-3 | 0-0 | 2 | 0 | 0 | -9 |
| Jordan Miller | 24:54 | 16 | 2 | 3 | 6-8 | 2-3 | 2-4 | 1 | 0 | 0 | +3 |
| Derrick Jones Jr. | 23:21 | 1 | 3 | 2 | 0-2 | 0-2 | 1-2 | 0 | 3 | 0 | +3 |
| Bennedict Mathurin | 22:23 | 4 | 0 | 0 | 2-7 | 0-1 | 0-0 | 0 | 0 | 2 | -18 |
| Kris Dunn | 19:56 | 3 | 2 | 2 | 1-2 | 0-0 | 1-2 | 1 | 1 | 1 | -12 |
| Nicolas Batum | 5:36 | 0 | 0 | 0 | 0-0 | 0-0 | 0-0 | 0 | 0 | 0 | -2 |
| Kobe Sanders | 1:22 | 2 | 0 | 1 | 1-1 | 0-0 | 0-0 | 1 | 0 | 2 | +3 |
| Cam Christie | 1:22 | 0 | 0 | 0 | 0-0 | 0-0 | 0-0 | 0 | 0 | 0 | +3 |
| TyTy Washington Jr. | 1:22 | 0 | 0 | 1 | 0-0 | 0-0 | 0-0 | 0 | 0 | 0 | +3 |
The Clippers made 38 of 76 field goals, which was exactly 50 percent. That was considerably better than Portland’s 41-of-91 shooting, or 45.1 percent.
That contrast is one of the most important details in the entire game.
Why Portland won despite shooting worse
At first glance, the shooting numbers seem to favor Los Angeles.
The Clippers:
- Shot 50.0 percent from the field
- Made 10 of 30 threes
- Shot 78.3 percent from the free-throw line
Portland:
- Shot 45.1 percent from the field
- Made 15 of 45 threes
- Shot 94.4 percent from the free-throw line
The three-point percentage was identical at 33.3 percent. Portland simply attempted 15 more threes and made five more.
The real separation came from possession volume.
Portland grabbed 48 total rebounds, compared with 30 for Los Angeles. More importantly, the Trail Blazers collected 18 offensive rebounds, generating additional possessions after missed shots. The NBA recap reported 32 Portland second-chance points.
This is the kind of statistic that can easily disappear when someone looks only at field-goal percentage.
If a team shoots poorly but repeatedly gets the rebound, it can turn one missed possession into multiple scoring opportunities. That was a major feature of this matchup.
Portland’s 18 offensive rebounds also fit its broader season profile. NBA’s recap noted that the Trail Blazers entered the game ranked second in the league in offensive rebounds at 14.1 per game and first in second-chance points at 18.2 per game.
The result was a simple but important basketball equation:
More offensive rebounds + more attempts + more second-chance scoring = enough offense to overcome lower field-goal efficiency.
The rebounding battle tells the real story
The raw rebound totals were:
- Portland: 48
- LA Clippers: 30
- Portland advantage: 18 rebounds
That is an enormous difference over 48 minutes.
The Clippers did have some interior success. They actually scored 52 points in the paint compared with Portland’s 48. They also finished with nine blocks compared with Portland’s four.
Yet the overall rebounding battle still favored Portland by 18.
The distinction between blocks and rebounds is useful here. A blocked shot can prevent a basket, but the possession does not necessarily end. If the attacking team recovers the ball, it gets another chance.
Portland repeatedly converted those extra chances into points.
That helps explain why the Clippers could win the field-goal percentage battle and still lose by double digits.
Portland’s second quarter changed the game
The second quarter deserves separate attention because it created the structural advantage that lasted through the final buzzer.
Portland won the period 28-15.
A 13-point quarter does not automatically decide a game, but the circumstances matter. Los Angeles entered halftime trailing 62-46, meaning Portland had already built a 16-point cushion.
The Clippers responded in the second half, but Portland continued to hold a substantial advantage after three quarters.
The third quarter finished 29-28 in Portland’s favor. The Trail Blazers therefore entered the final period with a 91-74 lead.
Los Angeles then scored 30 points in the fourth while Portland scored 23. That was a seven-point fourth-quarter advantage for the Clippers, but it was not enough.
This is an important way to read game flow. A team does not need to win every late-quarter exchange if it has already built a large possession and scoring advantage earlier.
Portland’s bench quietly mattered
The headline performers were Holiday and Avdija, but Portland’s reserves contributed several useful statistical signals.
Kris Murray finished with seven points, seven rebounds, and six assists while recording a team-high +19 among the listed rotation players.
Robert Williams III scored six points, grabbed seven rebounds, and finished +22.
Matisse Thybulle added five points, three steals, and a block.
These numbers help explain why Portland’s victory cannot be reduced to a two-player scoring story.
Murray’s six assists were especially notable. Avdija had eight, meaning those two players combined for 14 assists.
That is a strong indicator of how Portland distributed offensive responsibilities.
The Clippers had efficient secondary scoring
Los Angeles had five players score at least 16 points:
- Kawhi Leonard: 23
- Darius Garland: 20
- Brook Lopez: 18
- John Collins: 17
- Jordan Miller: 16
That balance is significant.
John Collins was particularly efficient, making 7 of 8 field goals and all three of his three-point attempts. He finished with 17 points in 31:13.
Jordan Miller was also highly efficient, scoring 16 points on 6-of-8 shooting and 2-of-3 from three.
So why did Los Angeles still lose?
Because efficient scoring from individual players does not automatically compensate for a possession deficit.
The Clippers had 30 rebounds to Portland’s 48. Their eight offensive rebounds were less than half of Portland’s 18. The teams committed the same number of turnovers, 14 each.
That means the biggest possession difference was created by rebounding rather than turnovers.
Shooting comparison
The team shooting statistics provide a useful side-by-side view.
| Category | Portland | LA Clippers |
| Field goals | 41-91 | 38-76 |
| Field-goal percentage | 45.1% | 50.0% |
| Three-pointers | 15-45 | 10-30 |
| Three-point percentage | 33.3% | 33.3% |
| Free throws | 17-18 | 18-23 |
| Free-throw percentage | 94.4% | 78.3% |
| Rebounds | 48 | 30 |
| Assists | 22 | 19 |
| Turnovers | 14 | 14 |
| Steals | 8 | 8 |
| Blocks | 4 | 9 |
The numbers show two different offensive profiles.
Los Angeles was more efficient on the shots it took.
Portland created more opportunities.
That distinction is critical when analyzing NBA box scores.
Portland attempted 91 field goals compared with 76 for Los Angeles. That is a 15-shot difference.
Even though Portland converted those attempts at a lower percentage, the additional volume helped it reach 114 points.
Portland also made five more three-pointers than Los Angeles.
Free throws were another hidden advantage
Portland made 17 of 18 free throws.
Los Angeles made 18 of 23.
The Clippers therefore scored one more free-throw point despite attempting five more free throws.
Portland’s 94.4 percent free-throw accuracy was one of its most efficient parts of the offensive performance.
Avdija was central to that efficiency, making 11 of 12 attempts.
Holiday also made all three of his free throws.
Together, Holiday and Avdija went 14-of-15 from the line.
That is 93.3 percent from the two players who combined for 58 of Portland’s 114 points.
The importance of equal turnovers
Turnovers often become the first explanation for a close loss, but that does not work here.
Both teams committed 14 turnovers.
Portland had 22 assists and Los Angeles had 19.
The Trail Blazers therefore finished with a three-assist advantage while committing the same number of turnovers.
This gave Portland a modest edge in ball movement without sacrificing possession security relative to the Clippers.
The larger difference remained the rebounding battle.
What the plus/minus numbers add
Plus/minus can be noisy over one game, so it should be treated as supporting evidence rather than a definitive ranking of players.
Still, several Portland numbers stand out.
Robert Williams III finished at +22.
Kris Murray finished at +19.
Deni Avdija finished at +8.
Jrue Holiday finished at +6.
On the Clippers side, Jordan Miller finished at +3, Derrick Jones Jr. at +3, and several rotation players were negative.
The contrast is interesting because Portland’s most positive plus/minus figures did not necessarily belong to its highest scorers.
That suggests the victory was influenced by lineup performance and possession control rather than simply individual scoring totals.
The matchup’s tactical lesson
The clearest tactical lesson from the game is that shooting efficiency and possession efficiency are different things.
Los Angeles shot 50 percent.
Portland shot about 45 percent.
If the game had been decided purely by shooting percentage, the Clippers would have had a strong statistical case.
Instead, Portland created substantially more possessions through offensive rebounding.
That allowed the Trail Blazers to absorb missed shots without immediately losing the possession battle.
This is why offensive rebounding is often especially valuable for a team that takes many three-pointers. Long-range misses can create unpredictable rebound locations, and a team that aggressively attacks the offensive glass can create additional scoring chances.
Portland’s 18 offensive rebounds were therefore not just a raw statistic. They were part of the strategy that supported the team’s high shot volume.
How the game affected the season series
The NBA’s official recap stated that Los Angeles entered the game leading the season series 2-0? No. The verified record after this matchup was 2-1 in favor of the Clippers.
The game was the third meeting between the teams at that point, and the NBA stated that the season series would conclude on April 10 in Portland.
This matters because some game summaries can become confusing when multiple meetings are listed together.
The verified sequence at this point should therefore be understood as a three-game season series with Los Angeles leading 2-1 after Portland’s 114-104 victory.
The supplied data listing a fourth completed game should not be treated as part of the completed series as of March 31. The official NBA reporting clearly identified April 10 as the final scheduled meeting.
Why the final score can be misleading
A 10-point victory can sometimes look straightforward.
This one was not.
The Clippers:
- Shot 50 percent
- Had five players score at least 16
- Blocked nine shots
- Scored 52 points in the paint
- Won the fourth quarter
Portland:
- Shot 45.1 percent
- Had 18 offensive rebounds
- Produced 32 second-chance points
- Made 15 three-pointers
- Shot 94.4 percent at the free-throw line
- Built a 17-point lead entering the fourth
The final score makes more sense once these numbers are considered together.
The Clippers were efficient but lost the possession battle.
Portland was less efficient from the field but generated more opportunities.
That is the central statistical story of the game.
A practical guide to reading the box score
For anyone searching for player statistics after an NBA game, it helps to look beyond points.
A useful five-step approach is:
1. Start with the top scorers
This identifies who carried the scoring load.
Here, Holiday led Portland with 30 and Leonard led Los Angeles with 23.
2. Check shooting volume
Thirty points on 21 attempts tells a different story from 30 points on 12 attempts.
Holiday’s 30 points came from 21 field-goal attempts, including 15 three-point attempts.
3. Check rebounds
A large rebounding difference can create extra possessions.
Portland’s 48 rebounds compared with Los Angeles’ 30 were among the most important numbers in the game.
4. Check assists and turnovers together
This helps measure how efficiently teams moved the ball.
Portland had 22 assists and 14 turnovers.
Los Angeles had 19 assists and 14 turnovers.
5. Look at the game flow
A fourth-quarter comeback can look impressive without changing the overall result.
In this game, Los Angeles won the fourth quarter 30-23 but entered it down 91-74.
That context makes the final 10-point margin much easier to understand.
la clippers vs portland trail blazers match player stats in one table
For readers who want the essential numbers without reading the full analysis, this is the quickest reference:
| Statistic | Portland | LA Clippers |
| Final score | 114 | 104 |
| Field goals | 41-91 | 38-76 |
| FG percentage | 45.1% | 50.0% |
| Three-pointers | 15-45 | 10-30 |
| 3PT percentage | 33.3% | 33.3% |
| Free throws | 17-18 | 18-23 |
| FT percentage | 94.4% | 78.3% |
| Rebounds | 48 | 30 |
| Assists | 22 | 19 |
| Turnovers | 14 | 14 |
| Steals | 8 | 8 |
| Blocks | 4 | 9 |
| Top scorer | Jrue Holiday, 30 | Kawhi Leonard, 23 |
| Top rebounder | Deni Avdija, 11 | Kawhi Leonard, 8 |
| Top assist total | Deni Avdija, 8 | Darius Garland, 4 |
These figures come from the official game record and corroborating box-score data.
What stands out most from the player statistics
Three conclusions are especially clear.
First, Jrue Holiday was Portland’s primary scorer. His seven made three-pointers gave Portland a major perimeter boost.
Second, Deni Avdija delivered the most complete all-around line. His 28 points, 11 rebounds, and eight assists covered scoring, rebounding, and creation.
Third, Portland’s team-level rebounding advantage was more important than the Clippers’ superior shooting percentage.
That last point is probably the most valuable takeaway for anyone learning how to analyze basketball statistics.
A team can shoot better and still lose decisively if it gives up too many second opportunities.
Final statistical perspective
The March 31 matchup between Portland and Los Angeles is a strong example of why NBA box scores should be read as connected data rather than isolated numbers.
Portland scored 114 points while shooting 45.1 percent.
Los Angeles scored 104 points while shooting 50 percent.
That appears unusual until the possession statistics are considered.
Portland grabbed 48 rebounds to Los Angeles’ 30. The Trail Blazers collected 18 offensive rebounds and scored 32 second-chance points. They also made 15 three-pointers to the Clippers’ 10 and converted 94.4 percent of their free throws.
At the individual level, Holiday’s 30 points provided the headline scoring performance, while Avdija’s 28 points, 11 rebounds, and eight assists made him a central figure in nearly every major statistical category. Leonard remained productive with 23 points and eight rebounds, while Garland, Lopez, Collins, and Miller all supplied double-digit scoring for Los Angeles.
The biggest lesson is not simply that Portland won 114-104. It is how Portland won.
The Trail Blazers created more opportunities, protected their advantage through the middle quarters, and used offensive rebounding to overcome a lower field-goal percentage.
For anyone studying individual performance, the matchup also shows why points should be viewed alongside rebounds, assists, shooting attempts, free throws, turnovers, and plus/minus.
Holiday’s scoring made the box score memorable.
Avdija’s all-around production made it more complete.
Portland’s rebounding made the team result possible.
Those three layers together provide the clearest interpretation of the game and explain why the final score does not tell the whole story.

One Comment