Detroit Pistons vs Toronto Raptors Match Player Stats
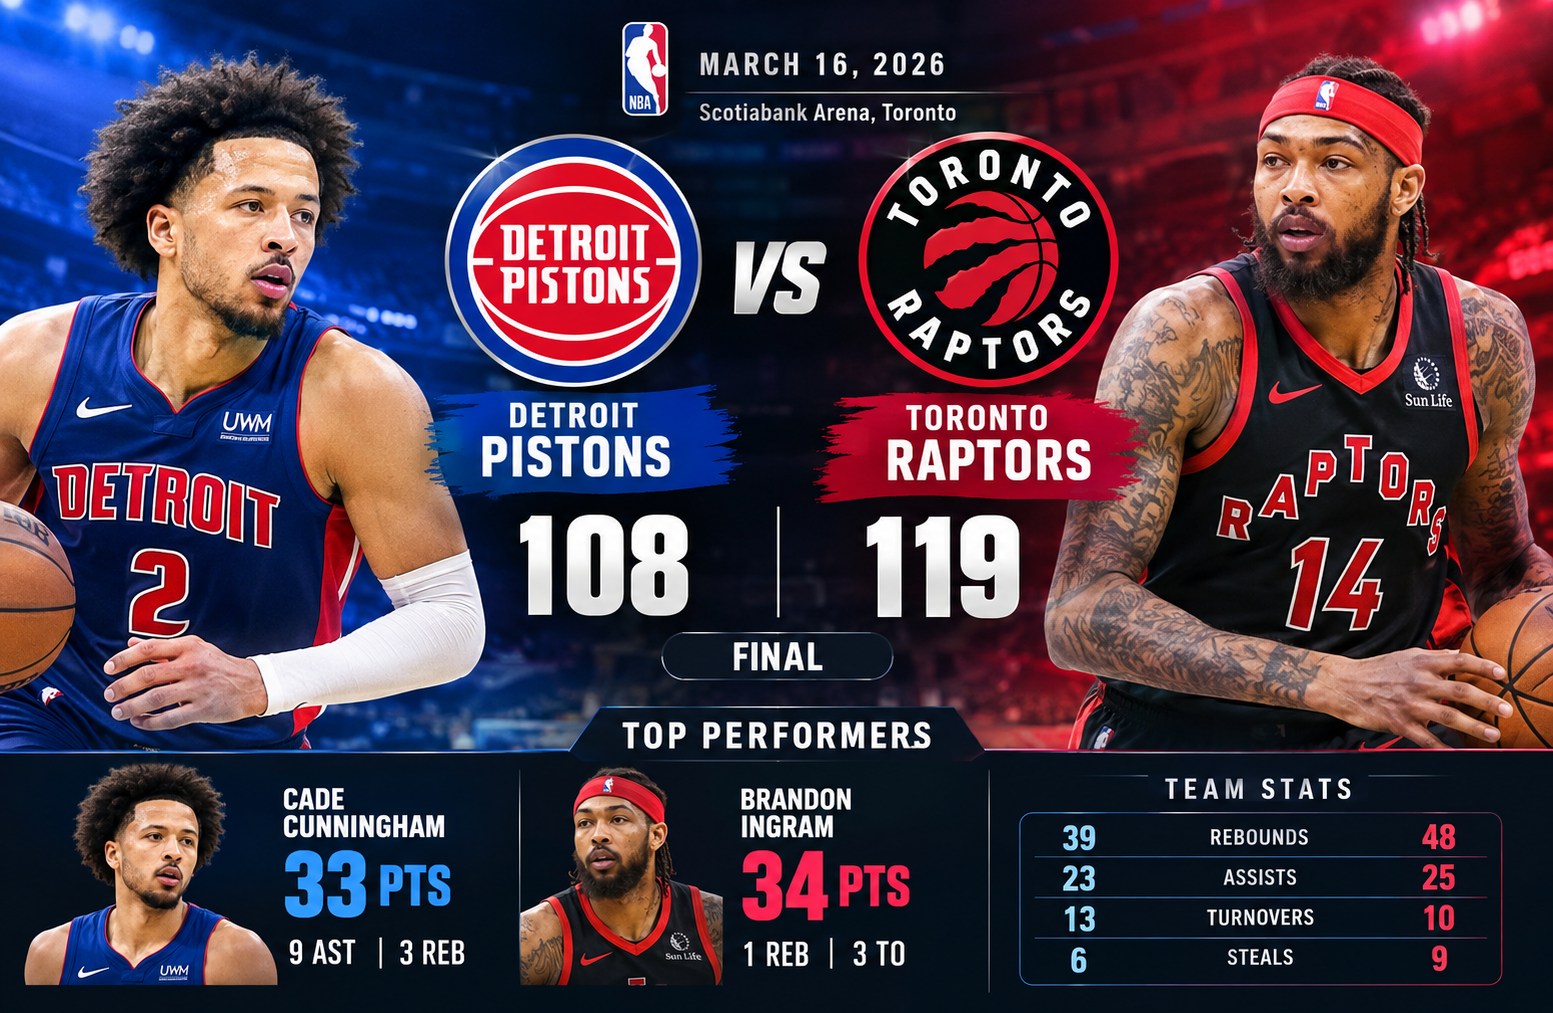
The Detroit Pistons vs Toronto Raptors match player stats from March 16, 2026, tell a much more detailed story than the 119-108 final score alone. Toronto used a dominant third quarter, stronger rebounding, and more efficient free-throw shooting to pull away at Scotiabank Arena after Detroit led 64-59 at halftime. Brandon Ingram led all scorers with 34 points, while Cade Cunningham answered with 33 points and 9 assists for Detroit.
The game was also notable because both teams entered with strong records. Detroit was 48-19 overall and 22-11 on the road, while Toronto was 38-29 and 19-16 at home. With the victory, Toronto evened the season series at 1-1 after Detroit had won the February 12 meeting 113-95.
Detroit Pistons vs Toronto Raptors Match Player Stats: Game Overview
The March 16 matchup took place at Scotiabank Arena in Toronto, Ontario, in front of 19,435 spectators.
| Category | Detroit Pistons | Toronto Raptors |
| Final Score | 108 | 119 |
| Q1 | 32 | 33 |
| Q2 | 32 | 26 |
| Q3 | 17 | 34 |
| Q4 | 27 | 26 |
| Field Goals | 41-85 | 44-91 |
| Field Goal % | 48% | 48% |
| 3-Pointers | 10-26 | 8-28 |
| 3-Point % | 38% | 29% |
| Free Throws | 16-24 | 23-30 |
| Free-Throw % | 67% | 77% |
| Rebounds | 39 | 48 |
| Assists | 23 | 25 |
| Turnovers | 13 | 10 |
| Steals | 6 | 9 |
| Blocks | 5 | 5 |
The most important contrast is efficiency versus volume. Both teams shot 48% from the field, but Toronto attempted six more field goals and converted seven more. The Raptors also reached the free-throw line more often and made a higher percentage of their attempts.
That combination helped Toronto produce 119 points despite making only eight of 28 three-point attempts.
How the Game Changed Quarter by Quarter
First Quarter: Toronto Starts Slightly Ahead
Toronto opened with a narrow 33-32 advantage.
Detroit scored efficiently enough to stay within one possession, but Toronto’s offense established the pattern that would become important later: the Raptors generated scoring opportunities through a combination of interior play, free throws, and perimeter attempts.
Second Quarter: Detroit Takes Control
Detroit responded with a 32-26 second quarter.
That six-point advantage turned the game around temporarily. At halftime, the Pistons led 64-59, giving them a five-point cushion.
Cade Cunningham was already carrying a significant offensive load, while Tobias Harris and Jalen Duren provided efficient secondary scoring.
Third Quarter: Toronto’s Decisive Run
The third quarter was the turning point.
Toronto outscored Detroit 34-17, producing a 17-point swing in a single period.
That changed a five-point Detroit halftime lead into a seven-point Toronto advantage entering the fourth quarter.
The Raptors’ third-quarter performance is one of the clearest explanations for the final result. Detroit’s offense went cold, while Toronto created enough scoring opportunities to build separation.
Fourth Quarter: Raptors Protect the Lead
Detroit won the fourth quarter 27-26, but the one-point advantage was not enough to erase Toronto’s third-quarter surge.
The Raptors therefore finished with an 11-point victory.
Detroit Pistons vs Toronto Raptors Match Player Stats: Top Performers
Brandon Ingram Leads Toronto With 34 Points
Brandon Ingram was Toronto’s leading scorer and the game’s highest scorer.
His line:
- 34 points
- 12-of-25 field goals
- 4-of-9 from three-point range
- 6-of-8 free throws
- 1 rebound
- 0 assists
- 3 turnovers
- +14 plus/minus
Ingram’s four made three-pointers were particularly useful because Toronto did not shoot well from outside as a team.
He finished with 34 of Toronto’s 119 points, meaning he accounted for roughly 28.6% of the Raptors’ scoring.
His scoring efficiency was not perfect, but the volume mattered. In a game where Toronto needed to overcome a difficult three-point shooting night, Ingram supplied consistent offensive production.
Cade Cunningham Scores 33 for Detroit
Cade Cunningham produced Detroit’s biggest individual scoring performance.
His final numbers were:
- 33 points
- 12-of-24 shooting
- 2-of-8 from three
- 7-of-8 free throws
- 3 rebounds
- 9 assists
- 4 turnovers
- 2 steals
- -13 plus/minus
Cunningham was only one point behind Ingram in scoring and also contributed nine assists.
His 12 made field goals were tied to a 50% shooting performance, while his seven made free throws added important points when Toronto was trying to create separation.
The interesting part of Cunningham’s performance is the contrast between his individual production and Detroit’s final result. His 33 points and nine assists were strong box-score contributions, but Toronto’s overall team advantages outweighed his production.
RJ Barrett Adds 27 Points
RJ Barrett was another major factor for Toronto.
He recorded:
- 27 points
- 11-of-17 field goals
- 1-of-4 three-pointers
- 4-of-4 free throws
- 6 rebounds
- 2 assists
- 3 turnovers
- +3 plus/minus
Barrett’s 11-for-17 shooting was one of the game’s most efficient high-volume scoring performances.
He also made all four of his free throws.
With Ingram scoring 34 and Barrett adding 27, Toronto received 61 points from two players.
Tobias Harris Provides Efficient Scoring
Tobias Harris gave Detroit 21 points on an extremely efficient shooting night.
His line included:
- 21 points
- 9-of-12 field goals
- 3-of-3 three-pointers
- 5 rebounds
- 2 assists
- -2 plus/minus
Harris was perfect from three-point range and converted 75% of his field-goal attempts.
His shooting helped Detroit maintain its offensive efficiency, but the Pistons did not get enough comparable production from the rest of their rotation to overcome Toronto’s second-half surge.
Jalen Duren Controls Detroit’s Interior
Jalen Duren finished with:
- 20 points
- 8-of-11 field goals
- 4-of-7 free throws
- 11 rebounds
- -7 plus/minus
Duren was Detroit’s leading rebounder and recorded a double-double.
His 11 rebounds were important, but Toronto’s Jakob Poeltl had an even bigger rebounding performance.
Jakob Poeltl Dominates the Glass
Jakob Poeltl produced one of the most important all-around performances of the game.
He recorded:
- 21 points
- 9-of-12 field goals
- 3-of-5 free throws
- 18 rebounds
- 5 assists
- 1 block
- +2 plus/minus
The 18 rebounds stand out immediately.
Poeltl collected seven more rebounds than Detroit’s leading rebounder, Duren, and helped Toronto finish with a 48-39 team rebounding advantage.
That nine-rebound team advantage gave Toronto additional possessions and reduced Detroit’s opportunities to generate second-chance points.
Poeltl also shot 75% from the field.
His performance shows why looking only at scoring can miss a major part of a basketball game’s story.
Scottie Barnes Fills the Box Score
Scottie Barnes scored only 14 points, but his overall contribution was much larger.
His line:
- 14 points
- 5-of-11 field goals
- 0-of-1 from three
- 4-of-5 free throws
- 10 rebounds
- 8 assists
- 1 turnover
- 1 steal
- 3 blocks
- +22 plus/minus
Barnes recorded a double-double and came close to a triple-double.
His eight assists were the most by any Toronto player, while his 10 rebounds tied him for a team-high-level rebounding contribution.
The +22 plus/minus was also the best listed mark among the major players in the game.
His statistical profile illustrates an important point: a player’s impact cannot always be summarized by points alone.
Immanuel Quickley Has a Difficult Shooting Night
Immanuel Quickley finished with only six points.
His statistics were:
- 6 points
- 1-of-12 field goals
- 1-of-6 three-pointers
- 3-of-4 free throws
- 1 rebound
- 7 assists
- 1 turnover
- 3 steals
- +14
The shooting numbers were difficult, but Quickley still contributed seven assists and three steals.
That combination helped Toronto maintain offensive organization and defensive pressure even when his own shot was not falling.
His performance is a good example of why the box score should be read as a complete statistical profile rather than a scoring leaderboard.
Detroit’s Supporting Cast
Detroit received strong performances from its primary scorers, but the supporting numbers were more uneven.
Paul Reed
Paul Reed contributed:
- 4 points
- 2-of-4 shooting
- 6 rebounds
- 3 blocks
- -4
His three blocks were a team-high for Detroit in the listed statistics.
Sandro Mamukelashvili
Mamukelashvili recorded:
- 8 points
- 3-of-7 shooting
- 1-of-4 from three
- 1-of-2 free throws
- 5 rebounds
- 2 steals
- +8
His +8 was one of Detroit’s better plus/minus figures.
Ausar Thompson
Thompson finished with:
- 4 points
- 2-of-8 shooting
- 1 rebound
- 3 assists
- 1 steal
- 1 block
- -9
Duncan Robinson
Robinson posted:
- 1 point
- 0-of-2 field goals
- 0-of-2 from three
- 3 rebounds
- 3 assists
- +2
The limited scoring from some of Detroit’s rotation players increased the importance of Cunningham, Harris, and Duren carrying the offense.
Toronto’s Supporting Production
Toronto’s supporting players also contributed in several different ways.
Jonathan Mogbo
Mogbo recorded:
- 2 points
- 1-of-1 shooting
- 3 rebounds
- +2
Jamal Shead
Shead finished with:
- 4 points
- 1-of-4 field goals
- 2-of-2 free throws
- 2 rebounds
- 3 assists
- 1 block
- -2
Ja’Kobe Walter
Walter contributed:
- 3 points
- 1-of-2 field goals
- 1-of-2 from three
- 2 rebounds
- 2 steals
- -8
These numbers demonstrate that Toronto did not depend on every rotation player to score heavily. Different players contributed through rebounding, passing, steals, and defensive plays.
What the Team Statistics Reveal
The team box score provides several clues about why Toronto won.
Rebounding Was a Major Difference
Toronto grabbed 48 rebounds compared with Detroit’s 39.
That is a nine-rebound advantage.
Poeltl’s 18 rebounds were the biggest individual reason for the difference.
Detroit had Duren’s 11 rebounds, but Toronto received substantial rebounding contributions from Poeltl and Barnes.
More rebounds can create additional possessions, particularly when offensive rebounds lead to second chances.
Toronto Won the Free-Throw Battle
Toronto went 23-of-30 at the line.
Detroit went 16-of-24.
The Raptors therefore made seven more free throws than the Pistons.
Toronto also shot 77% from the free-throw line compared with Detroit’s 67%.
This was especially important because Toronto’s three-point shooting was below Detroit’s.
Detroit Was More Efficient From Three
Detroit made 10 of 26 three-point attempts.
That equals approximately 38%.
Toronto made eight of 28, or approximately 29%.
So Detroit had a clear perimeter efficiency advantage.
However, Toronto compensated through field-goal volume, free throws, rebounding, and additional possessions.
Turnovers Favored Toronto
Detroit committed 13 turnovers.
Toronto committed only 10.
That three-turnover difference may appear modest, but it mattered in a game decided by 11 points.
Toronto also recorded nine steals compared with Detroit’s six.
Why Toronto Won Despite Making Fewer Three-Pointers
This is one of the most useful lessons from the game.
Toronto did not win because it shot better from three.
It did not.
Toronto’s 29% three-point percentage was nine percentage points lower than Detroit’s 38%.
Instead, the Raptors compensated in other areas.
They:
- Made seven more field goals.
- Attempted six more field goals.
- Made seven more free throws.
- Rebounded Detroit by nine.
- Committed three fewer turnovers.
- Produced four more assists.
- Recorded three more steals.
That broader statistical profile explains why a team can win comfortably despite losing the three-point percentage battle.
Detroit Pistons vs Toronto Raptors Match Player Stats and Plus/Minus
Plus/minus should be treated as context rather than a standalone measurement of individual performance.
The most notable figures were:
| Player | Team | Plus/Minus |
| Scottie Barnes | Toronto | +22 |
| Brandon Ingram | Toronto | +14 |
| Immanuel Quickley | Toronto | +14 |
| Tobias Harris | Detroit | -2 |
| Sandro Mamukelashvili | Detroit | +8 |
| Duncan Robinson | Detroit | +2 |
| Cade Cunningham | Detroit | -13 |
| Jalen Duren | Detroit | -7 |
| Ausar Thompson | Detroit | -9 |
| RJ Barrett | Toronto | +3 |
| Jakob Poeltl | Toronto | +2 |
Cunningham’s -13 should not be interpreted as meaning he individually performed poorly. He scored 33 points and recorded nine assists.
Instead, plus/minus reflects the team’s scoring margin while a player is on the court and can be affected by lineups, opponent combinations, and game flow.
Barnes’ +22 is particularly interesting because his 14-point scoring total does not immediately suggest how extensively he influenced the game.
The Halftime-to-Final Story
The score progression provides perhaps the clearest summary.
Detroit led:
64-59 at halftime
Toronto then outscored Detroit:
34-17 in the third quarter
That means Toronto transformed a five-point halftime deficit into a seven-point lead in one quarter.
Detroit slightly outscored Toronto in the fourth, 27-26, but the damage had already been done.
This is why the final score alone does not fully explain the game.
The decisive stretch was the third quarter.
Detroit Pistons vs Toronto Raptors Match Player Stats: Head-to-Head Series Context
The March 16 meeting was the second listed matchup between the teams during the 2025-26 season.
The previous meeting took place on February 12, 2026.
Detroit won that game:
Detroit 113, Toronto 95
The March 16 result reversed the outcome:
Toronto 119, Detroit 108
After the March game, the series was tied 1-1.
The teams were scheduled to meet again on April 1, 2026, with Toronto later listed as the home team in the provided data.
That means the March 16 game was particularly useful for understanding how the matchup changed between meetings.
Comparing the Two Meetings
The first meeting ended with Detroit winning by 18 points.
The second ended with Toronto winning by 11.
That creates a 29-point difference in the combined margin between the two games.
The results also show why individual game context matters.
A team that wins one matchup decisively can still lose the next when shooting, rebounding, turnovers, free throws, and lineup production change.
For readers researching head-to-head statistics, it is therefore useful to separate:
- individual scoring
- shooting efficiency
- rebounding
- assists
- turnovers
- defensive events
- quarter-by-quarter scoring
- final margin
Looking at only one category can produce an incomplete picture.
Key Statistical Takeaways
1. Ingram and Cunningham Led the Scoring
Ingram scored 34.
Cunningham scored 33.
They were separated by only one point.
2. Poeltl Owned the Rebounding Battle
Poeltl’s 18 rebounds were the game’s highest individual total.
Duren followed with 11.
3. Barnes Was Toronto’s Primary Facilitator
Barnes led Toronto with eight assists.
Cunningham led Detroit with nine.
4. Toronto Won the Possession-Related Categories
The Raptors had:
- 48 rebounds
- 10 turnovers
- 9 steals
Detroit had:
- 39 rebounds
- 13 turnovers
- 6 steals
5. Detroit Had the Better Three-Point Percentage
Detroit shot 38%.
Toronto shot 29%.
Yet Toronto won by 11.
That makes the matchup a useful example of why three-point percentage should not be analyzed in isolation.
How to Read NBA Match Player Statistics Correctly
For anyone using this type of game data for research, fantasy analysis, historical comparisons, or basketball writing, a structured approach helps.
Start With the Score
The final score establishes the basic result.
Check the Quarter Breakdown
Quarter-by-quarter scoring identifies when the game changed.
Examine Shooting
Look at:
- field-goal attempts
- field-goal percentage
- three-point attempts
- three-point percentage
- free throws
Move to Possession Indicators
Rebounds and turnovers can reveal why one team had more scoring opportunities.
Review Individual Production
Points are important, but assists, rebounds, steals, blocks, and shooting efficiency provide additional context.
Use Plus/Minus Carefully
Plus/minus is useful for understanding game flow, but it should not be treated as a complete player evaluation.
For broader statistical context and official basketball terminology, readers can consult the NBA official statistics resources.
Frequently Asked Questions
Who scored the most points in the Detroit Pistons vs Toronto Raptors game?
Brandon Ingram led all scorers with 34 points for Toronto. Cade Cunningham followed with 33 points for Detroit.
What was the final score between Detroit and Toronto?
Toronto defeated Detroit 119-108 on March 16, 2026, at Scotiabank Arena.
Who had the most rebounds in the game?
Jakob Poeltl led all players with 18 rebounds. Jalen Duren was Detroit’s leading rebounder with 11.
Who had the most assists?
Cade Cunningham led Detroit with nine assists, while Scottie Barnes led Toronto with eight.
Did Detroit shoot better from three-point range?
Yes. Detroit shot 38% from three-point range, making 10 of 26 attempts. Toronto shot 29%, making eight of 28.
What was the biggest turning point?
The third quarter was the decisive period. Toronto outscored Detroit 34-17 after trailing 64-59 at halftime.
Conclusion
The March 16, 2026 matchup between Detroit and Toronto was decided by much more than the individual scoring totals.
Brandon Ingram’s 34 points led Toronto, while Cade Cunningham’s 33 points and nine assists powered Detroit. Tobias Harris added 21 points on 9-of-12 shooting, Jalen Duren produced 20 points and 11 rebounds, and Jakob Poeltl delivered one of the game’s most influential interior performances with 21 points and 18 rebounds.
The central statistical difference was Toronto’s ability to generate production across several categories. The Raptors finished with nine more rebounds, three fewer turnovers, four more assists, three more steals, and seven more made free throws. Detroit countered with superior three-point accuracy, but that advantage was not enough to overcome Toronto’s broader statistical edge.
The third quarter ultimately defined the contest. Toronto turned a five-point halftime deficit into a seven-point lead by winning the period 34-17, then protected that advantage in the final quarter.
The result also brought the season series level at 1-1 after Detroit’s 113-95 victory over Toronto on February 12.
For anyone studying Detroit Pistons vs Toronto Raptors match player stats, this game provides a useful example of why a complete box-score analysis should combine individual production with shooting efficiency, rebounding, turnovers, free throws, defensive statistics, and quarter-by-quarter game flow.