Knicks vs Cleveland Cavaliers Match Player Stats
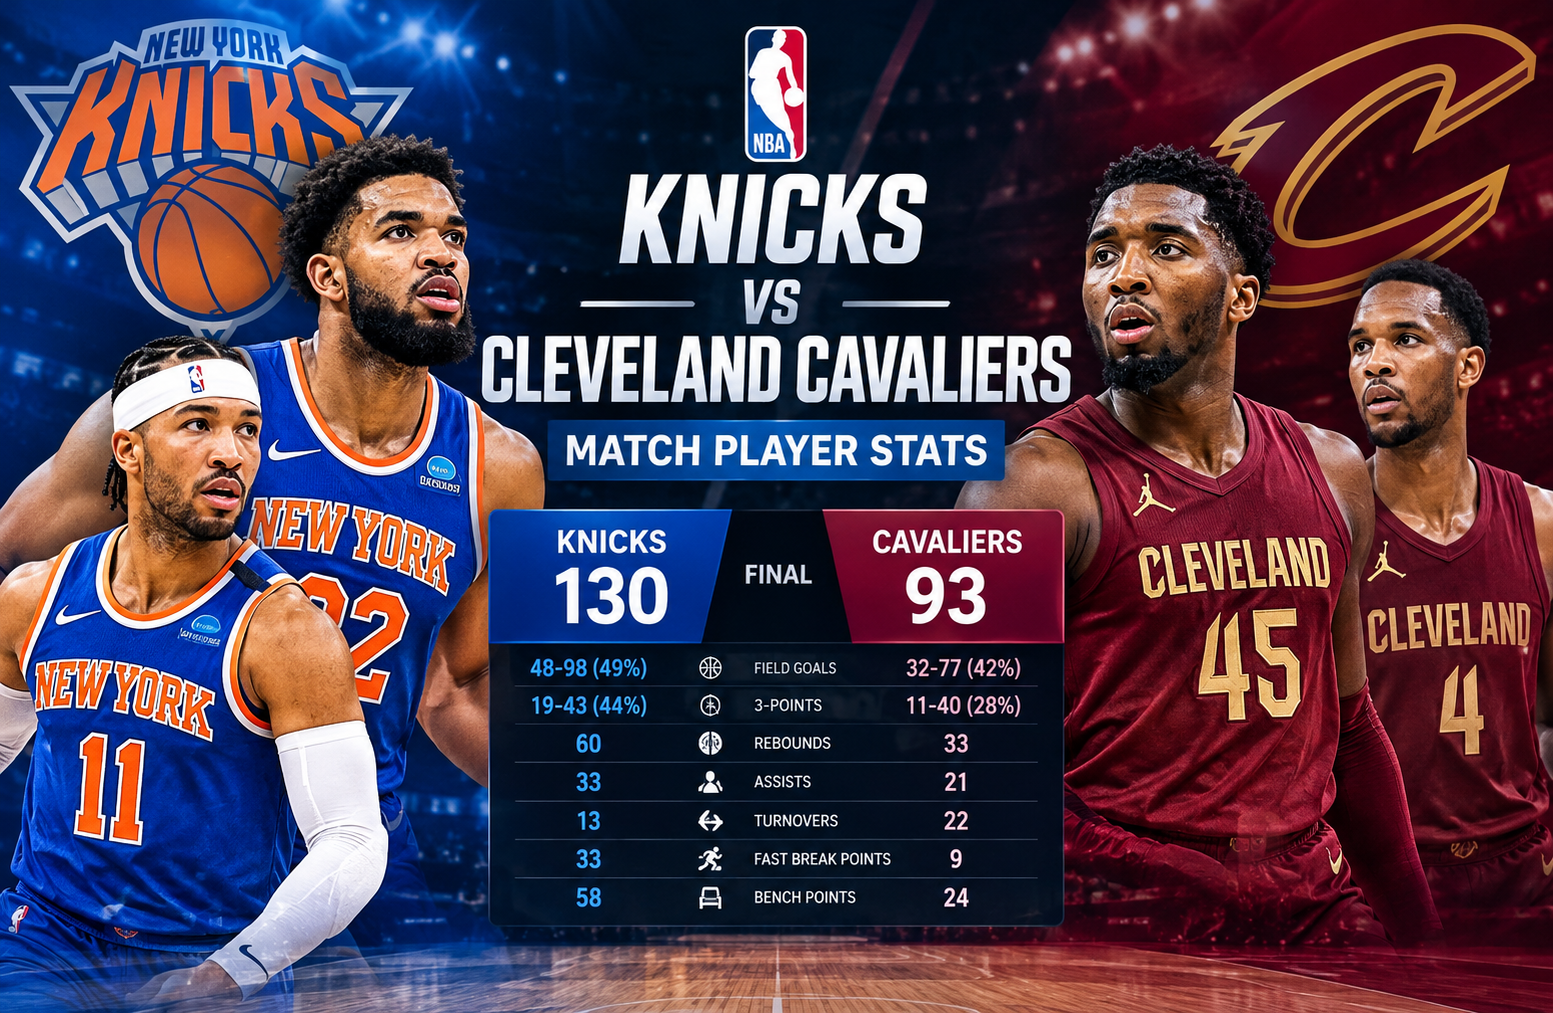
The knicks vs cleveland cavaliers match player stats from Game 4 of the 2026 Eastern Conference Finals tell a much bigger story than the 130-93 final score alone. New York dominated Cleveland across rebounding, three-point shooting, ball movement, transition scoring, and second-unit production to complete a 4-0 sweep and return to the NBA Finals for the first time since 1999. (NBA.com)
There is also an important date detail worth clearing up. The official NBA game page identifies the contest as Monday, May 25, 2026, at Rocket Arena, while the game information records Tuesday, May 26 at 12:00 AM. This reflects the timing around the game rather than a different matchup. The official box score lists New York’s 130-93 victory, 19,432 attendance, and the 4-0 series result. (NBA.com)
Knicks vs Cleveland Cavaliers Match Player Stats
Game 4 was one of those postseason performances where the individual numbers explain the result almost immediately.
Karl-Anthony Towns led New York with 19 points and 14 rebounds. OG Anunoby added 17 points, while Mikal Bridges and Jalen Brunson each scored 15. Josh Hart contributed 6 points, 11 rebounds, and 6 assists, giving New York another example of how its production extended beyond the traditional scoring leaders. (NBA.com)
Cleveland had a different statistical profile. Donovan Mitchell was clearly the Cavaliers’ primary offensive producer with 31 points. Evan Mobley finished with 15 points, 7 rebounds, and 4 assists, while James Harden scored 12. The problem for Cleveland was that Mitchell’s scoring could not offset New York’s depth, rebounding advantage, transition attack, and overall efficiency. (NBA.com)
Game 4 at a glance
| Category | New York Knicks | Cleveland Cavaliers |
| Final score | 130 | 93 |
| Q1 | 38 | 26 |
| Q2 | 30 | 23 |
| Q3 | 30 | 22 |
| Q4 | 32 | 22 |
| Field goals | 48-98 | 32-77 |
| Field goal percentage | 49% | 42% |
| Three-pointers | 19-43 | 11-40 |
| Three-point percentage | 44% | 28% |
| Free throws | 15-20 | 18-22 |
| Rebounds | 60 | 33 |
| Assists | 33 | 21 |
| Turnovers | 13 | 22 |
| Steals | 15 | 9 |
| Blocks | 2 | 4 |
The statistical gap was particularly striking because New York did not need one player to score 30 or more points. Instead, the Knicks created an overwhelming team performance.
How the Knicks Built a 37-Point Victory
The first major clue is the scoring distribution.
New York scored at least 30 points in every quarter. Cleveland never reached 27 points in a quarter. That consistency prevented the Cavaliers from finding a period in which they could build momentum.
The Knicks opened with a 38-26 first quarter and then added another 30 points in the second. At halftime, New York had established a 68-49 advantage.
The third quarter produced another 30-22 Knicks edge, pushing the margin to 27 entering the fourth. New York then added 32 points while Cleveland managed only 22.
The result was a 130-93 victory and a 37-point margin.
The NBA’s official game data also records New York’s largest lead at 45 points. (NBA.com)
This matters because a large playoff margin can sometimes come from a late bench-heavy quarter. That was not the main story here. New York established control early and continued extending the advantage.
Karl-Anthony Towns Delivered the Interior Production
Towns’ 19-point, 14-rebound performance was arguably the clearest individual statistical statement for New York.
He shot 8-for-11 from the field, including 3-for-3 from three-point range. That combination is particularly valuable because Cleveland could not simply defend him as a traditional interior scorer.
Towns finished with:
- 19 points
- 14 rebounds
- 3 assists
- 2 steals
- 2 blocks
- 8-for-11 shooting
- 3-for-3 from three-point range
- +25 plus/minus
His rebounding total was especially important.
Cleveland finished the game with 33 total rebounds. Towns alone collected 14, meaning he accounted for a substantial share of New York’s 60-board team total.
That helped create additional possessions and limited Cleveland’s ability to finish defensive sequences with rebounds.
Towns also gave New York spacing. A center shooting 3-for-3 from deep forces a defense to make difficult choices about where help should come from.
If Cleveland’s big defenders stayed close to the basket, Towns could stretch the floor.
If they moved away from the paint, New York could attack open driving and cutting lanes.
That is one reason his box-score line should not be evaluated only through the 19-point total.
Donovan Mitchell Was Cleveland’s Main Offensive Threat
Mitchell scored 31 points, making him the game’s leading scorer.
That performance deserves context.
Cleveland scored only 93 points, so Mitchell accounted for roughly one-third of the Cavaliers’ total scoring. He was responsible for keeping the offense competitive on an individual level even as the overall team performance deteriorated.
The problem was that New York forced Cleveland to win through individual scoring while generating more collective production.
Mitchell’s 31 points were not enough because Cleveland did not get a comparable amount of efficient support around him.
Mobley had 15 points.
Harden had 12.
No other Cavaliers player reached those scoring totals.
The NBA’s official game coverage identifies Mitchell as Cleveland’s top scorer while Towns led New York’s overall statistical production. (NBA.com)
This is an important lesson when reading playoff player statistics. The highest-scoring player is not automatically the player whose team controlled the game.
Mitchell won the individual scoring battle.
New York won almost every important team-level battle.
Josh Hart’s Numbers Show the Value of Secondary Contributions
Josh Hart scored only 6 points, but looking at his scoring total alone would seriously underestimate his impact.
His Game 4 line included:
- 6 points
- 11 rebounds
- 6 assists
- 2 steals
- 2-for-5 shooting
- +20 plus/minus
Hart’s rebounding and passing helped New York avoid becoming overly dependent on Brunson for creation.
A team with several players who can rebound, pass, defend, and initiate offense becomes difficult to disrupt over 48 minutes.
Hart also collected 11 rebounds despite playing fewer than 24 minutes.
That is the kind of contribution that can disappear if someone looks only at points per game.
OG Anunoby Provided Two-Way Balance
Anunoby scored 17 points on 6-for-13 shooting.
He also recorded 7 rebounds, 4 assists, and 2 steals.
His 17 points were the second-highest total among Knicks starters, but his broader contribution was more significant than the scoring number suggests.
Anunoby made 4 of his 4 free throws and helped New York maintain defensive pressure.
His presence also illustrates why the Knicks were able to distribute offensive responsibility.
New York did not need every starter to create 20-point scoring performances.
Instead, several players produced useful numbers across different statistical categories.
That approach becomes particularly valuable in playoff games where defensive schemes are designed to remove the primary option.
Jalen Brunson Did Not Need a Huge Scoring Night
Brunson scored 15 points in Game 4.
For a player who had been one of New York’s central offensive engines throughout the postseason, 15 points might initially look modest.
But the context is important.
The Knicks scored 130 points without requiring Brunson to carry the scoring load.
NBA.com reported that Brunson averaged 25.5 points during the Eastern Conference Finals and received the Larry Bird Trophy as the series MVP. (NBA.com)
His Game 4 performance therefore demonstrates an important characteristic of an effective playoff team.
A primary scorer does not always have to be the highest scorer.
If the defense focuses on limiting Brunson, New York has enough other offensive options to punish that strategy.
The Rebounding Difference Was Massive
One of the clearest numbers in the box score is the 60-33 rebounding advantage for New York.
That is a 27-rebound difference.
It is difficult to overcome a gap of that size in a playoff game.
New York’s rebounding advantage had several consequences.
First, it gave the Knicks more opportunities to end Cleveland possessions.
Second, offensive rebounds could create additional scoring opportunities.
Third, defensive rebounds allowed New York to start transition attacks quickly.
The Knicks’ 33 fast-break points compared with only 9 for Cleveland. The NBA also recorded a 58-24 advantage in bench points for New York. (NBA.com)
Those two numbers explain a major part of the blowout.
The Knicks were not simply making more shots in half-court possessions.
They were generating additional scoring opportunities through rebounding, transition, and bench production.
Three-Point Shooting Created Another Separation
New York made 19 of 43 three-point attempts.
That equals approximately 44%.
Cleveland made 11 of 40 from beyond the arc, or approximately 28%.
The difference was 8 made three-pointers.
Since every successful three is worth three points, that alone represents a 24-point difference in made three-point baskets.
Of course, basketball cannot be reduced to one category. But when three-point accuracy, rebounding, turnovers, and transition scoring all favor the same team, the statistical picture becomes overwhelming.
New York also avoided relying exclusively on three-point shooting.
The Knicks scored 50 points in the paint compared with Cleveland’s 36. (NBA.com)
That combination is important.
New York could score inside.
It could space the floor.
It could run.
It could create extra possessions.
That gave Cleveland several problems to solve simultaneously.
Turnovers Became a Major Factor
Cleveland committed 22 turnovers.
New York committed only 13.
That nine-turnover difference matters even before considering what happened after those mistakes.
The Knicks recorded 15 steals.
Cleveland had 9.
New York also produced 33 fast-break points compared with Cleveland’s 9.
This suggests a direct relationship between defensive pressure and offensive opportunities.
Cleveland’s turnovers did not simply disappear from the box score. Many contributed to opportunities for New York to attack before the Cavaliers could establish their half-court defense.
For a team already struggling to keep pace, giving an opponent additional transition possessions is particularly damaging.
The Bench Changed the Shape of the Game
One of the strongest statistics from Game 4 was the bench scoring difference.
New York’s reserves produced 58 points.
Cleveland’s bench produced 24.
That is a 34-point advantage from non-starters.
Landry Shamet was particularly important for the Knicks, scoring 16 points off the bench and making four three-pointers. (NBA.com)
This is one of the most useful numbers for understanding why the final margin became so large.
If a team’s starters build a lead and its bench maintains or expands it, the opponent loses opportunities to recover.
The Knicks were able to increase the lead without requiring their primary stars to play extended minutes in a game that was effectively decided before the closing minutes.
Comparing the Shooting Profiles
The team shooting numbers provide another useful layer.
New York:
- 48 made field goals
- 98 attempts
- 49% field goal shooting
- 19 made threes
- 44% three-point shooting
- 15-for-20 at the free-throw line
Cleveland:
- 32 made field goals
- 77 attempts
- 42% field goal shooting
- 11 made threes
- 28% three-point shooting
- 18-for-22 at the free-throw line
Interestingly, Cleveland actually shot a higher percentage from the free-throw line.
That did not matter much because free throws were a relatively small part of the overall possession battle.
New York generated more field-goal attempts, converted more shots, shot much better from three, and created more opportunities through rebounding and turnovers.
This is a good example of why a single efficiency percentage should not be treated as the entire story.
Why 130 Points Mattered Historically
New York’s 130 points were notable because the Knicks became the first team in NBA playoff history to score 130 points without having an individual 20-point scorer in the game. (NBA.com)
That is a striking illustration of balanced offense.
Towns led with 19.
Anunoby had 17.
Shamet had 16.
Brunson and Bridges each had 15.
The production was spread across the roster instead of concentrated in one player.
This is especially relevant for evaluating playoff basketball because opponents have more time to prepare for individual stars.
A balanced offense gives defensive schemes fewer obvious pressure points.
What the Plus/Minus Numbers Tell Us
Plus/minus should always be used carefully because it is influenced by lineup combinations and game context.
Still, Game 4 produced some useful signals.
Towns finished at +25.
Hart was +20.
Anunoby was +14.
New York’s bench also performed strongly.
Jordan Clarkson posted a team-high +28 among the Knicks, according to the supplied game data and official box-score information.
The broader lesson is more important than identifying one player as the definitive contributor.
New York’s positive plus/minus figures were spread across the roster because the Knicks consistently won their minutes.
Cleveland’s starters, meanwhile, finished with negative plus/minus figures in a game where the team trailed by large margins for much of the second half.
Cleveland’s Statistical Challenges
The Cavaliers did not simply lose because they missed a few shots.
Their problems appeared across multiple areas.
1. Rebounding
Cleveland lost the rebounding battle 60-33.
That limited second chances and made it harder to prevent New York from controlling possession.
2. Three-point efficiency
The Cavaliers shot 28% from three.
Against a team that made 44% of its attempts, that created a substantial scoring gap.
3. Turnovers
Cleveland committed 22 turnovers.
New York committed only 13.
That gave the Knicks more opportunities to attack in transition.
4. Bench scoring
Cleveland’s bench was outscored 58-24.
That made the depth advantage particularly clear as the game progressed.
5. Transition defense
New York scored 33 fast-break points.
Cleveland scored only 9.
That 24-point difference is significant on its own.
When combined with the rebounding and turnover numbers, it becomes one of the central explanations for the final margin.
The First Quarter Set the Tone
The opening period deserves special attention.
Cleveland scored 26 points, which is a respectable offensive quarter.
The problem was that New York scored 38.
The Knicks immediately created a 12-point advantage.
That meant Cleveland spent the rest of the game trying to close a gap against a team that was shooting efficiently and generating additional possessions.
NBA.com’s game analysis noted that New York’s previous road closeout opportunities had also featured fast starts and substantial early leads. (NBA.com)
The Game 4 performance followed that pattern.
New York did not wait until the second half to establish control.
The Second Half Turned Control Into a Blowout
At halftime, the Knicks led 68-49.
Cleveland needed a major third-quarter response.
Instead, New York outscored the Cavaliers 30-22.
That made the score 98-71.
The fourth quarter therefore began with Cleveland needing to overcome a 27-point deficit.
New York then scored another 32 points.
The NBA’s play-by-play records show that the Knicks eventually pushed their advantage as high as 45 points. (NBA.com)
With the game effectively decided, New York’s starters were pulled with 7:47 remaining while holding a 35-point lead. (NBA.com)
That detail is important when interpreting late-game statistics.
The final margin was already established before the final minutes, so the result was not dependent on a late scoring surge against Cleveland’s reserves.
What the Series Result Says About Game 4
Game 4 was the final chapter of a four-game Eastern Conference Finals sweep.
The Knicks won:
- Game 1: 115-104 in overtime
- Game 2: 109-93
- Game 3: 121-108
- Game 4: 130-93
The series ended 4-0 in New York’s favor. (NBA.com)
The progression is interesting.
New York won Game 1 by 11.
It won Game 2 by 16.
It won Game 3 by 13.
Then it won Game 4 by 37.
The final contest was therefore not simply another close game that went New York’s way.
It was the most decisive result of the series.
A Better Way to Read These Player Statistics
For readers researching individual player numbers, there are several useful lessons from this matchup.
Do not focus only on points
Towns had 19 points but 14 rebounds, 3 assists, 2 steals, and 2 blocks.
Hart had 6 points but 11 rebounds and 6 assists.
A box score becomes much more informative when several categories are considered together.
Look at efficiency
A player scoring 19 points on 8-for-11 shooting creates a different offensive impact from a player needing 20-plus attempts to reach the same total.
Compare team context
Mitchell scored 31 points.
But Cleveland scored 93.
That means his scoring performance occurred within a much less productive team environment.
Consider possession statistics
Rebounds and turnovers can create or remove opportunities before shooting efficiency even becomes relevant.
Examine role
Bench players should not be evaluated against the same expectations as primary stars.
Shamet’s 16 points were particularly valuable because they came from a reserve role and contributed to New York’s enormous bench-scoring advantage.
What These Numbers Mean for Future Knicks-Cavaliers Matchups
The Game 4 statistics offer a useful framework for analyzing future meetings between these teams.
The first area to monitor is rebounding.
If New York consistently creates a large possession advantage through the glass, Cleveland has to compensate elsewhere.
The second is three-point efficiency.
A 44% versus 28% difference is difficult to overcome.
The third is turnover control.
The Knicks generated 15 steals and converted Cleveland’s mistakes into transition opportunities.
The fourth is secondary scoring.
If Brunson is heavily defended, New York has multiple players capable of contributing meaningful offense.
The fifth is lineup depth.
The 58-24 bench-scoring advantage shows how quickly a game can move away from an opponent when the second unit continues producing.
Frequently Asked Questions
Who scored the most points in Knicks vs Cavaliers Game 4?
Donovan Mitchell led all players with 31 points for Cleveland. Karl-Anthony Towns led the Knicks with 19 points. (NBA.com)
How many rebounds did Karl-Anthony Towns have?
Towns recorded 14 rebounds, along with 19 points, 3 assists, 2 steals, and 2 blocks. (NBA.com)
What was the final score between the Knicks and Cavaliers?
New York defeated Cleveland 130-93 in Game 4 of the Eastern Conference Finals. (NBA.com)
How many three-pointers did the Knicks make?
New York made 19 of 43 three-point attempts, shooting approximately 44% from beyond the arc. Cleveland made 11 of 40. (NBA.com)
How many turnovers did each team have?
The Knicks committed 13 turnovers, while the Cavaliers committed 22. (NBA.com)
Did the Knicks sweep the Cavaliers?
Yes. New York won the Eastern Conference Finals 4-0 and advanced to the NBA Finals. (NBA.com)
Conclusion
The knicks vs cleveland cavaliers match player stats from Game 4 show why the Knicks were able to finish the Eastern Conference Finals with such a convincing result.
Karl-Anthony Towns supplied efficient scoring and dominant rebounding. Josh Hart influenced the game through rebounding, passing, and defense. OG Anunoby delivered balanced two-way production. Jalen Brunson contributed without needing to dominate the scoring column. Landry Shamet provided a major scoring boost from the bench.
For Cleveland, Donovan Mitchell’s 31 points stood out individually, while Evan Mobley contributed across several categories. But the Cavaliers could not match New York’s overall production.
The team statistics provide the clearest explanation. New York won the rebounding battle 60-33, made 19 three-pointers to Cleveland’s 11, committed nine fewer turnovers, scored 33 fast-break points to Cleveland’s 9, and received 58 points from its bench compared with 24 from the Cavaliers’ reserves. (NBA.com)
The final 130-93 score was therefore the result of sustained advantages rather than one isolated statistical category. New York combined efficient shooting, possession control, defensive pressure, transition offense, and balanced scoring to close the series with its largest victory of the four games.