Los Angeles Chargers vs Detroit Lions Match Player Stats
The Los Angeles Chargers vs Detroit Lions match player stats from the 2025 Pro Football Hall of Fame Game tell a much clearer story than the 34-7 final score alone. Los Angeles controlled the game through efficient quarterback play, timely rushing touchdowns, defensive takeaways, and strong field-position management, while Detroit struggled with turnovers and inconsistent quarterback execution. The Hall of Fame Game was played in Canton, Ohio, on July 31, 2025, with coverage and reporting continuing into August 1. The Chargers finished with a 34-7 victory.
Because this was a preseason contest, the player statistics need to be read differently from regular-season numbers. Many starters did not play, while several roster-bubble players received extended opportunities. That makes individual production particularly useful for understanding how players performed in limited opportunities, although one preseason game should not be treated as a complete evaluation of a player’s season-long ability.
Los Angeles Chargers vs Detroit Lions Match Player Stats: Game Overview
The Chargers scored in every quarter and built a 21-7 halftime advantage before adding 13 unanswered points in the second half. Their scoring distribution was 14 points in the first quarter, 7 in the second, 6 in the third, and 7 in the fourth. Detroit scored its only touchdown in the second quarter.
The early advantage mattered because Los Angeles created pressure on Detroit’s backup quarterbacks and repeatedly received favorable field position after turnovers.
The Chargers ultimately recorded three interceptions, while Detroit did not intercept a Chargers pass. Detroit also lost two fumbles, contributing to five total turnovers.
Final Score and Quarter-by-Quarter Breakdown
| Quarter | Los Angeles Chargers | Detroit Lions |
| Q1 | 14 | 0 |
| Q2 | 7 | 7 |
| Q3 | 6 | 0 |
| Q4 | 7 | 0 |
| Final | 34 | 7 |
The early advantage mattered because Los Angeles created pressure on Detroit’s backup quarterbacks and repeatedly received favorable field position after turnovers.
Trey Lance Leads the Chargers Passing Attack
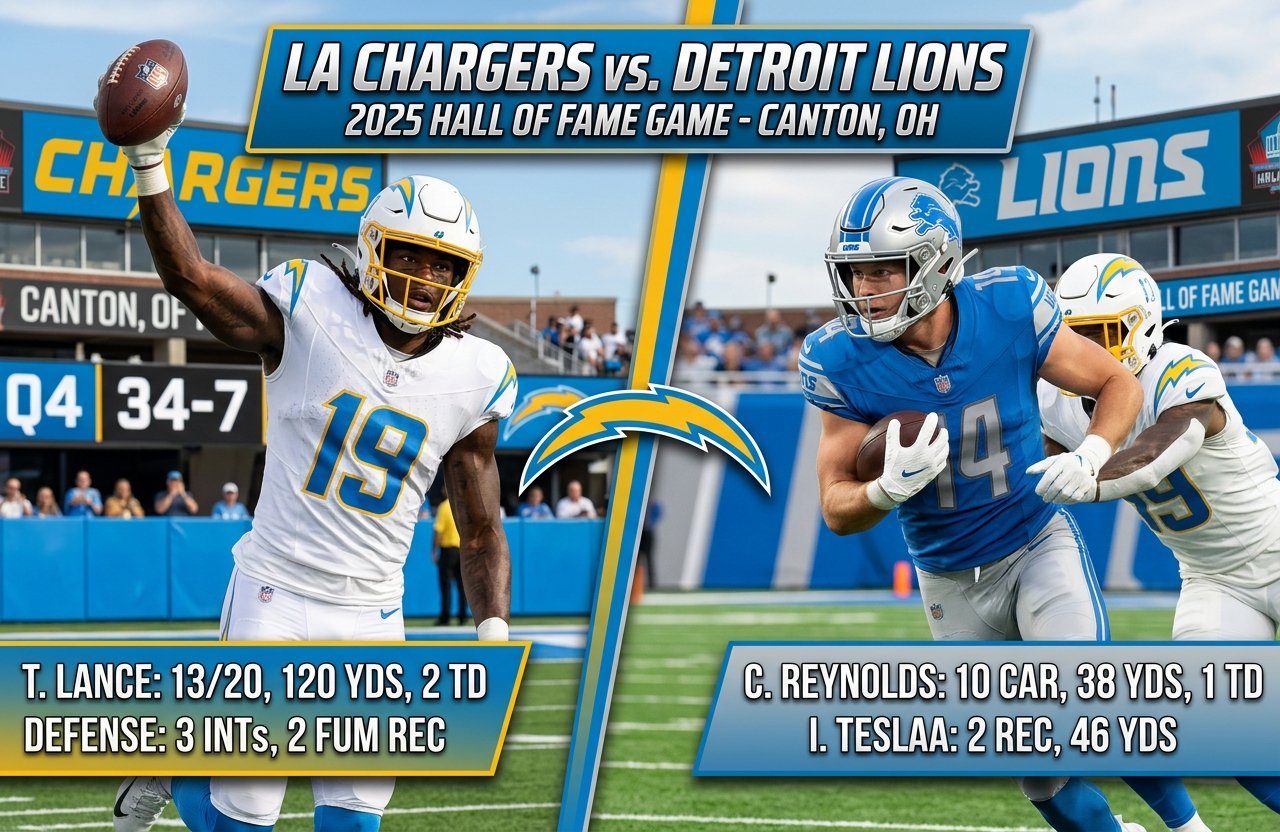
Trey Lance was the central offensive story of the game. He completed 13 of 20 passes for 120 yards and two touchdowns, without an interception. His passer rating was 114.6, and he added 8 rushing yards on three attempts.
His basic passing line was:
| Player | Comp/Att | Yards | TD | INT | Yards/Attempt | Rating |
| Trey Lance | 13/20 | 120 | 2 | 0 | 6.0 | 114.6 |
| DJ Uiagalelei | 2/3 | 25 | 0 | 0 | 8.3 | 92.4 |
| Chargers Total | 15/23 | 140 | 2 | 0 | 6.3 | 111.7 |
Lance’s numbers are particularly notable because he produced both Chargers passing touchdowns.
His first touchdown went to Will Dissly on a 5-yard completion. Later, he connected with KeAndre Lambert-Smith for a 15-yard touchdown. Both throws showed Lance making accurate decisions and delivering the ball effectively.
Why Lance’s Numbers Matter
The most important part of Lance’s performance was not simply the two touchdowns. He avoided the major mistake that Detroit’s quarterbacks could not avoid.
He finished:
- 13 completions
- 20 attempts
- 120 passing yards
- 2 passing touchdowns
- 0 interceptions
- 6.0 yards per attempt
- 114.6 passer rating
- 3 rushing attempts
- 8 rushing yards
For a preseason quarterback competing for a roster role, protecting the football is especially important. Lance managed to create scoring opportunities without throwing an interception.
DJ Uiagalelei’s Limited Opportunity
DJ Uiagalelei entered later and completed 2 of 3 passes for 25 yards.
His opportunities were limited compared with Lance, so direct comparisons should be treated cautiously. He did not throw a touchdown or interception and averaged 8.3 yards per attempt.
The most useful takeaway is that the Chargers finished the night with a clean passing turnover record. Their quarterbacks combined for 15 completions on 23 attempts, 140 yards, two touchdowns, and no interceptions.
That efficiency helped preserve the team’s advantage even when the offense did not consistently produce long drives.
Detroit Lions Quarterback Statistics
Detroit’s quarterback statistics were considerably less efficient.
The Lions combined for 12 completions on 20 attempts for 104 yards, with no passing touchdowns and three interceptions. Their team passer rating was only 35.2.
| Player | Comp/Att | Yards | TD | INT | Yards/Attempt | Rating |
| Kyle Allen | 9/14 | 91 | 0 | 2 | 6.5 | 43.2 |
| Hendon Hooker | 3/6 | 18 | 0 | 1 | 3.0 | 16.7 |
| Lions Total | 12/20 | 104 | 0 | 3 | 5.5 | 35.2 |
Kyle Allen’s Performance
Kyle Allen completed 9 of 14 attempts for 91 yards.
At first glance, the completion percentage was respectable. However, two interceptions dramatically changed the value of his overall performance.
This is an important lesson when examining quarterback statistics. Completion percentage by itself does not explain whether a quarterback protected possessions or created scoring opportunities.
Allen completed 64.3 percent of his attempts, but the two interceptions gave Los Angeles additional opportunities and contributed to the game’s growing imbalance.
Hendon Hooker’s Performance
Hendon Hooker completed 3 of 6 passes for 18 yards, with one interception.
His 3.0 yards per attempt illustrates how difficult it was for Detroit’s passing attack to generate meaningful yardage during his appearance.
Chargers Rushing Statistics
The Chargers ran the ball 35 times for 121 yards, averaging 3.5 yards per carry.
| Player | Carries | Yards | Average | TD | Long |
| Kimani Vidal | 9 | 37 | 4.1 | 2 | 16 |
| Hassan Haskins | 6 | 34 | 5.7 | 0 | 11 |
| Nyheim Hines | 8 | 34 | 4.3 | 0 | 9 |
| Omarion Hampton | 2 | 9 | 4.5 | 0 | 8 |
| Trey Lance | 3 | 8 | 2.7 | 0 | 5 |
| Chargers Total | 35 | 121 | 3.5 | 2 | 16 |
Kimani Vidal’s Two-Touchdown Night
Kimani Vidal was the standout Chargers runner.
He finished with:
- 9 carries
- 37 rushing yards
- 4.1 yards per carry
- 2 rushing touchdowns
- 16-yard longest run
Both of Vidal’s touchdowns came from 2 yards out. The first put Los Angeles ahead 14-0 in the opening quarter. His second touchdown came late in the fourth quarter to complete the scoring.
His rushing average was not spectacular, but touchdown production and short-yardage execution were important parts of the Chargers’ offensive success.
Hassan Haskins Provides Efficient Rushing
Hassan Haskins recorded 34 yards on six carries, averaging 5.7 yards per attempt.
That was the best rushing average among Chargers players with multiple carries.
Haskins did not score, but his efficiency helped maintain a productive rushing rotation.
Nyheim Hines Contributes on Offense and Special Teams
Nyheim Hines carried the ball eight times for 34 yards, averaging 4.3 yards per carry.
He also returned one kickoff for 39 yards.
That combination gave Hines production in multiple phases of the game and helped the Chargers maintain useful field position.
Detroit Lions Rushing Statistics
Detroit recorded 28 rushing attempts for 93 yards, averaging 3.3 yards per carry.
| Player | Carries | Yards | Average | TD | Long |
| Craig Reynolds | 10 | 38 | 3.8 | 1 | 13 |
| Jabari Small | 11 | 35 | 3.2 | 0 | 6 |
| Lions Total | 28 | 93 | 3.3 | 1 | 13 |
Craig Reynolds Scores Detroit’s Only Touchdown
Craig Reynolds was Detroit’s leading rusher with 38 yards on 10 carries.
He averaged 3.8 yards per carry and scored the Lions’ only touchdown on a 3-yard rushing play.
Reynolds also caught one pass for 10 yards, giving him 48 total yards from scrimmage.
Jabari Small’s Workload
Jabari Small received the most rushing attempts for Detroit with 11.
He finished with 35 yards, averaging 3.2 yards per carry.
The workload suggests Detroit was willing to give him a substantial evaluation opportunity, although the overall rushing attack struggled to generate consistent efficiency.
Chargers Receiving Statistics
The Chargers recorded 15 receptions for 145 receiving yards, with two touchdowns on 21 targets.
| Player | Receptions | Yards | Average | TD | Targets | Long |
| KeAndre Lambert-Smith | 2 | 43 | 21.5 | 1 | 2 | 28 |
| Tucker Fisk | 1 | 19 | 19.0 | 0 | 1 | 19 |
| Jaret Patterson | 2 | 18 | 9.0 | 0 | 2 | 12 |
| Will Dissly | 2 | 14 | 7.0 | 1 | 2 | 9 |
| Brenden Rice | 1 | 13 | 13.0 | 0 | 1 | 13 |
| Chargers Total | 15 | 145 | 9.7 | 2 | 21 | 28 |
KeAndre Lambert-Smith Makes a Big-Play Impact
KeAndre Lambert-Smith was one of the most efficient Chargers receivers.
He caught two passes for 43 yards, averaging 21.5 yards per reception. His longest reception went for 28 yards, and he scored one touchdown.
His touchdown was a 15-yard reception from Lance in the second quarter.
The combination of limited targets and significant yardage makes his production particularly interesting when examining preseason roster competition.
Will Dissly Scores the First Chargers Touchdown
Will Dissly caught two passes for 14 yards and scored a touchdown.
His touchdown came on a 5-yard reception from Lance, giving Los Angeles its first points of the game.
Dissly’s role was not built around volume. Instead, he contributed in a specific scoring situation and helped establish the Chargers’ early lead.
Detroit Lions Receiving Statistics
Detroit completed 12 passes for 109 receiving yards, averaging 9.1 yards per reception. The Lions did not record a receiving touchdown.
| Player | Receptions | Yards | Average | TD | Targets | Long |
| Isaac TeSlaa | 2 | 46 | 23.0 | 0 | 3 | 24 |
| Dominic Lovett | 5 | 31 | 6.2 | 0 | 9 | 10 |
| Craig Reynolds | 1 | 10 | 10.0 | 0 | 1 | 10 |
| Lions Total | 12 | 109 | 9.1 | 0 | 19 | 24 |
Isaac TeSlaa Leads Detroit in Receiving Yardage
Isaac TeSlaa produced the Lions’ biggest receiving yardage total.
He caught two passes for 46 yards, averaging 23 yards per reception. His longest catch traveled 24 yards.
The production came on only three targets, showing that Detroit could generate explosive plays through the passing game even though the overall offense struggled.
Dominic Lovett Leads in Receptions
Dominic Lovett caught five passes for 31 yards on nine targets.
His 55.6 percent target-to-reception conversion rate was not enough to compensate for the offense’s overall lack of scoring production, but his nine targets made him a significant part of Detroit’s passing workload.
Defensive Player Statistics and Turnovers
Turnovers were arguably the defining statistical category of the game.
The Chargers intercepted Detroit quarterbacks three times and recorded two additional lost fumbles by the Lions. Detroit did not intercept a Chargers pass.
Chargers Defensive Production
The Chargers recorded:
- 59 total tackles
- 37 solo tackles
- 2 sacks
- 3 tackles for loss
- 5 passes defended
- 2 quarterback hits
- 3 interceptions
- 108 interception return yards
The three interceptions were recorded by:
| Player | Interceptions | Return Yards |
| Nikko Reed | 1 | 60 |
| Myles Purchase | 1 | 48 |
| Tony Jefferson | 1 | 0 |
| Chargers Total | 3 | 108 |
Nikko Reed’s 60-yard interception return and Myles Purchase’s 48-yard return were particularly important because interceptions did more than simply end Detroit possessions. They also gave Los Angeles additional field-position advantages.
Detroit Defensive Production
Detroit’s defense recorded:
- 67 total tackles
- 35 solo tackles
- 1 sack
- 5 tackles for loss
- 1 pass defended
- 1 quarterback hit
- 0 interceptions
The Lions actually finished with more total tackles than the Chargers, 67 to 59.
That statistic is useful because it shows why total tackles alone cannot explain defensive effectiveness. Detroit’s defense spent considerable time dealing with Chargers possessions, especially after offensive turnovers created difficult situations.
Turnover Battle Explains Much of the 34-7 Result
The turnover margin was one of the clearest statistical differences.
Detroit committed five turnovers:
- 3 interceptions
- 2 lost fumbles
The Chargers committed one fumble but recovered it.
That created a plus-four turnover margin for Los Angeles.
This is important when interpreting the offensive statistics.
Los Angeles did not need to dominate every offensive category. Instead, the defense repeatedly created opportunities that reduced the distance the offense needed to travel.
Special Teams Statistics
Special teams also contributed to the overall statistical picture.
Chargers Kick Returns
The Chargers had one kick return:
- Nyheim Hines: 39 yards
- Average: 39.0 yards
- Long: 39 yards
Lions Kick Returns
Detroit recorded six kick returns for 157 yards.
| Player | Returns | Yards | Average | Long |
| Jakobie Keeney-James | 3 | 73 | 24.3 | 29 |
| Grant Stuard | 2 | 62 | 31.0 | 36 |
| Dominic Lovett | 1 | 22 | 22.0 | 22 |
| Lions Total | 6 | 157 | 26.2 | 36 |
Grant Stuard produced the best average among Detroit’s primary returners at 31.0 yards per return.
Kicking
Cameron Dicker handled the Chargers’ kicking duties and finished 2-for-3 on field goals, with a long of 27 yards. He also converted all four extra-point attempts for 10 total points.
Jake Bates made his only extra-point attempt for Detroit and finished with one point.
Punting
JK Scott punted three times for the Chargers for 154 yards, averaging 51.3 yards per punt.
Jack Fox punted four times for Detroit for 187 yards, averaging 46.8 yards.
The punting numbers show that both teams had capable field-position work, but Los Angeles benefited more from turnovers and offensive efficiency.
Key Statistical Differences Between the Teams
The following comparison summarizes the major team-level numbers.
| Category | Chargers | Lions |
| Final Score | 34 | 7 |
| Passing Yards | 140 | 104 |
| Passing TDs | 2 | 0 |
| Passing INTs | 0 | 3 |
| Rushing Attempts | 35 | 28 |
| Rushing Yards | 121 | 93 |
| Rushing TDs | 2 | 1 |
| Total Rushing Average | 3.5 | 3.3 |
| Receiving Yards | 145 | 109 |
| Receiving TDs | 2 | 0 |
| Total Interceptions | 3 | 0 |
| Lost Fumbles | 0 | 2 |
| Total Turnovers | 1 fumble, recovered | 5 |
| Sacks | 2 | 1 |
The biggest differences were not necessarily the rushing averages. Both teams averaged fewer than four yards per rushing attempt.
The major separation came from:
- Quarterback efficiency
- Turnover margin
- Defensive takeaways
- Red-zone execution
- Ability to turn mistakes into scoring opportunities
What the Los Angeles Chargers vs Detroit Lions Match Player Stats Reveal
The raw box score becomes more useful when viewed through several connected statistical themes.
1. Turnovers Created a Major Field-Position Advantage
Three interceptions and two lost fumbles gave Los Angeles opportunities that Detroit could not recover from.
The Chargers did not need to produce explosive offense on every drive because turnovers repeatedly shortened the field.
This is one reason a simple comparison of yards per play or rushing average can miss the larger story.
2. Trey Lance Protected the Football
Lance’s 13-for-20 passing line was solid, but the zero interceptions were particularly important when compared with Detroit’s three.
His two touchdown passes also turned his opportunities into points.
His performance demonstrated the value of combining efficient passing with ball security during a preseason evaluation.
3. Detroit’s Passing Game Could Not Overcome Mistakes
The Lions had 104 passing yards and 109 receiving yards, but their three interceptions prevented the passing game from becoming a reliable source of scoring.
Kyle Allen had a higher completion percentage than Hooker, but his two interceptions were costly.
Hooker’s 18 passing yards and one interception produced an even lower overall passing rating.
4. Kimani Vidal Converted Short-Field Opportunities
Vidal’s two rushing touchdowns were both 2-yard scores.
Those touchdowns illustrate how field position and finishing ability work together.
A drive does not need to produce a 50-yard play to become valuable. If the defense creates a short field, the offense’s ability to convert from close range can be just as important.
5. Detroit Still Produced Some Explosive Plays
The Lions’ result was poor, but the receiving numbers should not be ignored.
Isaac TeSlaa averaged 23 yards per reception and finished with 46 yards on two catches.
Detroit also had six kickoff returns for 157 yards.
Those numbers demonstrate that the game was not devoid of positive individual plays. The problem was that those moments did not consistently become sustained offensive production or points.
Preseason Context Matters When Evaluating These Player Stats
One of the biggest mistakes in interpreting preseason statistics is treating them as if they came from a normal regular-season matchup.
The Hall of Fame Game is primarily an evaluation environment.
Coaches are looking at:
- Quarterback decision-making
- Ball security
- Special teams reliability
- Roster-bubble players
- Position competition
- Technique
- Conditioning
- Communication
- Assignment discipline
The same principle applies to Detroit’s quarterbacks and other players competing for opportunities.
A player who records strong numbers against second- and third-string opposition may have demonstrated something valuable, but the context matters.
A player who records strong numbers against second- and third-string opposition may have demonstrated something valuable, but the context matters.
Why the 34-7 Score Should Not Be Treated as a Full-Season Prediction
The final score was decisive, but it came in the first preseason game.
That means the result does not automatically translate into regular-season performance.
The Chargers used the game to evaluate players such as Lance and multiple depth options. Detroit similarly gave opportunities to backup quarterbacks and players competing for roster positions.
The best way to use these statistics is therefore to identify individual performances and areas that coaching staffs could study on film.
The game itself showed:
- Los Angeles protected the ball better
- Los Angeles created turnovers
- Lance produced two touchdown passes
- Vidal scored twice
- Detroit’s quarterbacks threw three interceptions
- Detroit’s offense scored only once
- Both teams had relatively modest rushing efficiency
- Detroit generated some useful receiving and return production
Those observations are more informative than simply declaring one team “better” based on a preseason result.
Most Important Player Performances
Several players stand out statistically from the game.
Trey Lance
13/20, 120 yards, 2 TD, 0 INT, 114.6 rating
Lance was the most significant individual offensive performer for Los Angeles.
Kimani Vidal
9 carries, 37 yards, 2 TD
Vidal converted both of his scoring opportunities and finished as the Chargers’ leading rushing touchdown producer.
KeAndre Lambert-Smith
2 receptions, 43 yards, 1 TD
His 21.5 yards per catch showed big-play ability despite only two targets.
Isaac TeSlaa
2 receptions, 46 yards
TeSlaa led Detroit in receiving yardage and averaged 23 yards per reception.
Craig Reynolds
10 carries, 38 yards, 1 TD
Reynolds was Detroit’s leading rusher and scored the Lions’ only touchdown.
Nikko Reed
1 interception, 60 return yards
Reed’s interception return was the longest among the Chargers’ three defensive interceptions.
How to Read These Stats for Fantasy and Football Analysis
Preseason statistics can be useful for identifying players who deserve further monitoring, but they should not automatically be treated as fantasy projections.
For example, a two-touchdown preseason performance can demonstrate red-zone involvement without guaranteeing a similar regular-season workload.
Likewise, a receiver with two catches for 43 yards may have shown big-play ability without receiving a consistent target share.
For a more useful evaluation, track the following across subsequent games:
- Snap counts
- First-team opportunities
- Route participation
- Target share
- Red-zone usage
- Third-down involvement
- Turnover frequency
- Special teams participation
A single box score provides the starting point. A series of games provides much more reliable evidence.
Frequently Asked Questions
What was the final score of the Chargers vs Lions Hall of Fame Game?
The Los Angeles Chargers defeated the Detroit Lions 34-7 in the 2025 Hall of Fame Game in Canton, Ohio.
How did Trey Lance perform against the Lions?
Trey Lance completed 13 of 20 passes for 120 yards and two touchdowns, with no interceptions. He finished with a 114.6 passer rating.
How many interceptions did the Chargers have?
The Chargers recorded three interceptions. Nikko Reed, Myles Purchase, and Tony Jefferson each recorded one.
Who scored the Chargers’ rushing touchdowns?
Kimani Vidal scored both Chargers rushing touchdowns. Each touchdown came on a 2-yard run.
Who was Detroit’s leading receiver?
Isaac TeSlaa led the Lions in receiving yardage with 46 yards on two receptions.
How many turnovers did the Lions commit?
Detroit committed five turnovers, including three interceptions and two lost fumbles. The Chargers did not lose a fumble and recorded three interceptions.
Conclusion
The Los Angeles Chargers vs Detroit Lions match player stats from the 2025 Hall of Fame Game show a matchup decided by much more than the final 34-7 score.
Trey Lance completed 13 of 20 passes for 120 yards and two touchdowns without an interception. Kimani Vidal added two rushing touchdowns, while KeAndre Lambert-Smith delivered 43 receiving yards and a touchdown. The Chargers also generated three interceptions and benefited from two Detroit lost fumbles.
Detroit’s strongest individual offensive numbers came from Craig Reynolds on the ground and Isaac TeSlaa through the air. Reynolds rushed for 38 yards and a touchdown, while TeSlaa produced 46 receiving yards. However, three interceptions from Detroit quarterbacks and two lost fumbles created a difficult statistical environment for the Lions.
The most useful way to understand this preseason game is to view the numbers as evaluation evidence rather than as a direct forecast of the regular season. Lance’s ball security, Vidal’s goal-line production, Lambert-Smith’s explosive receiving, Detroit’s turnover problems, and the defensive takeaway totals are the main statistical details worth carrying forward.
The gamebook provides the underlying record for the scoring sequence and player performance.