Atlanta Falcons vs Tampa Bay Buccaneers Match Player Stats
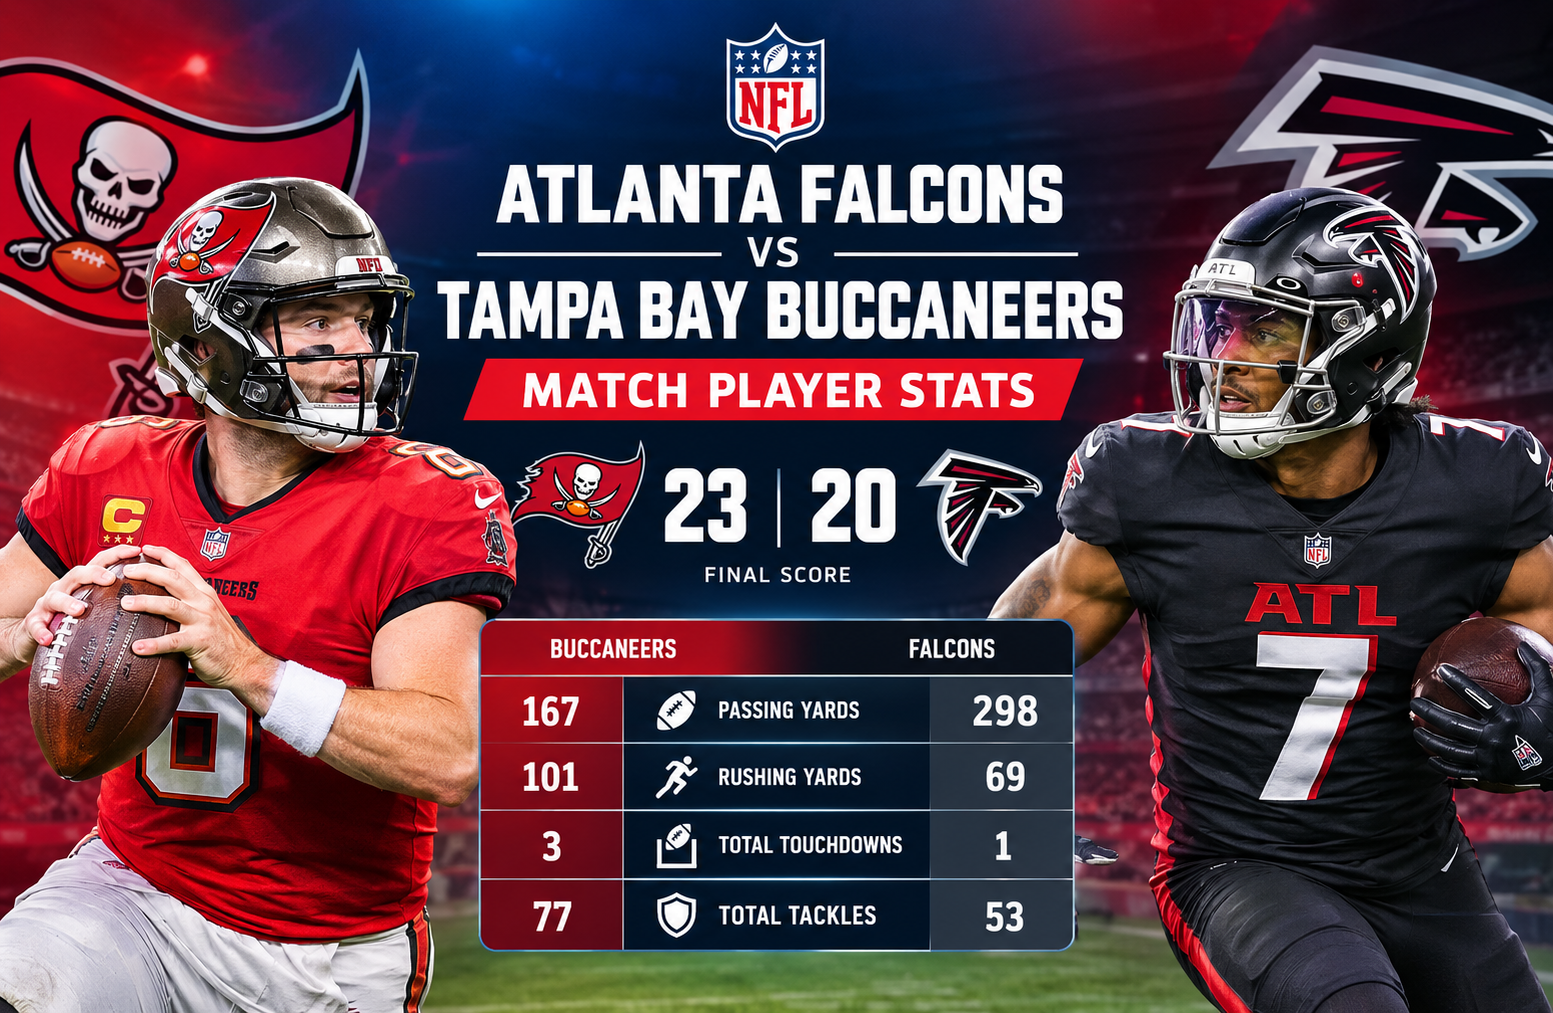
The atlanta falcons vs tampa bay buccaneers match player stats from NFL Week 1 on September 7, 2025 tell the story of a close divisional game decided by execution in key moments. The Tampa Bay Buccaneers defeated the Atlanta Falcons 23-20, beginning their season with a 1-0 record while Atlanta opened at 0-1. Although the final margin was only three points, the individual numbers reveal several important differences between the teams.
Tampa Bay received an efficient performance from Baker Mayfield, who completed 17 of 32 passes for 167 yards and three touchdowns without throwing an interception. His 99.3 passer rating reflected the value of those scoring throws. Mayfield also contributed 39 rushing yards on five carries, giving Tampa Bay an additional source of offense.
Atlanta’s Michael Penix Jr. produced more passing yards, completing 27 of 42 attempts for 298 yards and one touchdown. He also avoided an interception. However, Atlanta struggled to turn its greater passing volume into enough points. The Falcons rushed for only 69 yards as a team, compared with 101 rushing yards for Tampa Bay.
The receiving numbers provide another useful contrast. Tampa Bay rookie Emeka Egbuka led the Buccaneers with four receptions for 67 yards and two touchdowns. Atlanta’s Bijan Robinson was especially productive as a receiver, catching six passes for 100 yards and one touchdown. Those performances show how different the two offenses were able to create production.
atlanta falcons vs tampa bay buccaneers match player stats
The most important numbers from the matchup are summarized below.
| Category | Tampa Bay Buccaneers | Atlanta Falcons |
| Final Score | 23 | 20 |
| Record After Game | 1-0 | 0-1 |
| Passing Leader | Baker Mayfield | Michael Penix Jr. |
| Passing | 17/32, 167 yards | 27/42, 298 yards |
| Passing TDs | 3 | 1 |
| Interceptions | 0 | 0 |
| Rushing Leader | Baker Mayfield | Tyler Allgeier |
| Rushing Leader Stats | 5 carries, 39 yards | 10 carries, 24 yards |
| Team Rushing | 23 carries, 101 yards | 28 carries, 69 yards |
| Receiving Leader | Emeka Egbuka | Bijan Robinson |
| Receiving Leader Stats | 4 receptions, 67 yards, 2 TD | 6 receptions, 100 yards, 1 TD |
| Team Receptions | 17 | 27 |
| Team Receiving Yards | 167 | 298 |
| Team Receiving TDs | 3 | 1 |
| Sacks | 1 | 1 |
| Tackles | 77 | 53 |
| Tackles for Loss | 7 | 2 |
| Passes Defensed | 6 | 7 |
| QB Hits | 4 | 3 |
| Interceptions | 0 | 0 |
The table immediately highlights the central statistical tension. Atlanta controlled much of the passing production, but Tampa Bay produced more scoring efficiency.
That difference matters because football is not decided by total yardage alone. Red-zone execution, explosive plays, turnovers, field position and finishing drives can matter more than raw volume.
Baker Mayfield’s three-touchdown performance
Baker Mayfield did not lead the game in passing yards, but his three touchdown passes were arguably the most important offensive statistic for Tampa Bay.
He completed 17 of 32 attempts for 167 yards. That works out to 5.2 yards per attempt based on the supplied game figures. He threw three touchdowns and no interceptions while taking one sack.
His official statistics also show an 88.3 QBR and a 99.3 passer rating.
The most important part of the performance was not simply the number of completions. Mayfield protected the football while converting a limited passing total into three touchdown passes.
That is an important distinction when evaluating quarterback performances.
A quarterback can throw for nearly 300 yards and still lose a game. Another quarterback can throw for considerably fewer yards while producing more touchdowns and winning. This matchup is a clear example.
Mayfield’s rushing contribution
Mayfield also led Tampa Bay in rushing.
He carried the ball five times for 39 yards, averaging 7.8 yards per attempt. That was a significant contribution considering Tampa Bay’s total rushing output was 101 yards.
His rushing production added 39 yards without requiring another offensive player to handle the ball. It also gave Tampa Bay another way to gain positive yardage when passing opportunities were limited.
The Buccaneers finished with 23 team rushing attempts for 101 yards, averaging 4.4 yards per carry.
That was a much stronger rushing result than Atlanta produced.
Michael Penix Jr. produced more passing volume
Michael Penix Jr. had the bigger statistical workload through the air.
The Atlanta quarterback completed 27 of 42 passes for 298 yards and one touchdown. He did not throw an interception and was sacked once.
His completion percentage was approximately 64.3 percent, while his average gain per attempt was approximately 7.1 yards.
Penix also posted an 83.1 QBR and a 93.2 passer rating according to the supplied game data.
Those numbers show that his performance was not simply a high-volume passing effort. He moved the football effectively for much of the game.
The issue for Atlanta was converting that production into enough points.
The Falcons finished with 298 passing yards but only 20 points. Tampa Bay, meanwhile, produced 167 passing yards and scored 23 points.
That contrast is one of the biggest lessons from the game.
Why the passing-yard difference matters
Atlanta had 131 more passing yards than Tampa Bay.
That sounds like a major advantage, but the scoreboard shows why yardage needs context.
The Buccaneers generated three passing touchdowns. Atlanta generated one.
The teams also had identical interception totals at zero. Therefore, the difference cannot be explained by interceptions alone.
Tampa Bay’s advantage came from what it did with its offensive opportunities.
For anyone analyzing quarterback statistics, this is an important reminder: passing yards measure volume and movement, but touchdowns measure one of the most valuable outcomes of an offensive drive.
Emeka Egbuka emerges as Tampa Bay’s receiving leader
Emeka Egbuka led Tampa Bay’s receiving production with four receptions for 67 yards and two touchdowns.
His average was 16.8 yards per reception, with a longest reception of 30 yards.
The two touchdown catches were particularly important because they accounted for two-thirds of Tampa Bay’s passing touchdowns.
Egbuka therefore had a direct connection to the most valuable part of Tampa Bay’s passing production.
His four catches represented a smaller reception total than Atlanta’s leading receiver, but the scoring impact was greater.
This is another example of why a simple reception count does not always identify the most influential receiver.
Tampa Bay’s receiving distribution
The Buccaneers finished with 17 receptions for 167 yards and three receiving touchdowns.
That means their entire passing production was concentrated into a relatively modest number of completed passes.
The offense did not need a huge number of completions to score 23 points.
This efficiency helped Tampa Bay overcome Atlanta’s much larger passing total.
Bijan Robinson leads Atlanta’s receiving production
Bijan Robinson was one of Atlanta’s most productive players.
He caught six passes for 100 yards and one touchdown. His 16.7 yards per reception and 50-yard longest reception show that he was capable of creating explosive plays as a receiver.
The 50-yard reception was particularly important because it represented a major chunk of Atlanta’s passing production.
Robinson’s six receptions also tied his role to the passing game rather than limiting his impact to rushing attempts.
His receiving output was one of the clearest positives for Atlanta in the matchup.
Atlanta’s passing game through the numbers
Atlanta finished with 27 team receptions for 298 yards and one touchdown.
That exactly matches Penix’s passing total, which makes the relationship between the quarterback and receiving statistics straightforward.
The Falcons averaged 11.0 yards per completed pass.
The problem was not a lack of receiving production.
The larger issue was that the passing success did not result in enough points to overcome Tampa Bay’s three touchdown passes.
This is why offensive analysis should consider the relationship between yards, explosive plays and scoring efficiency rather than focusing on a single category.
Rushing statistics reveal Tampa Bay’s advantage
The rushing comparison is one of the strongest statistical advantages for Tampa Bay.
The Buccaneers rushed 23 times for 101 yards, averaging 4.4 yards per carry.
Atlanta had 28 rushing attempts for only 69 yards, averaging 2.5 yards per carry.
That means Atlanta actually had five more rushing attempts but gained 32 fewer yards.
The difference was substantial.
Tampa Bay gained an average of 1.9 more yards per rushing attempt. Over the course of 23 Tampa Bay carries, that efficiency helped the offense maintain balance.
Tyler Allgeier’s rushing numbers
Tyler Allgeier led Atlanta in rushing with 10 carries for 24 yards.
His average was only 2.4 yards per carry.
That made it difficult for Atlanta to establish a consistently effective ground game.
The Falcons did record one rushing touchdown as a team, but the overall rushing output remained limited.
Atlanta’s 69 rushing yards meant the offense depended heavily on Penix and the passing game.
When a team becomes more one-dimensional, defensive pressure can become easier to manage because the defense can devote more attention to the passing attack.
The defensive statistics tell another story
Tampa Bay recorded 77 total tackles, including 43 solo tackles.
The Buccaneers also produced one sack, seven tackles for loss, six passes defensed and four quarterback hits.
Atlanta recorded 53 total tackles and 28 solo tackles. The Falcons also had one sack, two tackles for loss, seven passes defensed and three quarterback hits.
Both defenses finished with one sack.
However, Tampa Bay had a major advantage in tackles for loss, recording seven compared with Atlanta’s two.
That difference indicates that Tampa Bay was more disruptive behind or near the line of scrimmage.
Tykee Smith leads Tampa Bay’s defense
Tykee Smith was Tampa Bay’s defensive leader with 11 tackles, including seven solo tackles.
That workload shows how frequently he was involved in stopping Atlanta’s offensive plays.
His seven solo tackles represented a significant portion of Tampa Bay’s 43 solo tackles.
For a close game decided by three points, individual defensive involvement becomes especially important.
Jessie Bates III leads Atlanta’s defense
Jessie Bates III led Atlanta with seven tackles, including two solo tackles.
Although Atlanta’s defense recorded seven passes defensed, it generated only two tackles for loss.
The Falcons also had one sack and three quarterback hits.
The numbers suggest Atlanta was able to contest passing plays but did not create the same level of backfield disruption as Tampa Bay.
Turnovers and ball security
Neither team recorded an interception.
That is important because turnovers often provide an immediate explanation for a close result.
Here, there were no defensive interceptions to separate the teams.
Tampa Bay also recorded no fumbles.
Atlanta’s Michael Penix Jr. recorded one fumble, while Bijan Robinson had no fumbles and recorded one recovery.
The lack of interceptions kept the game relatively clean from a passing turnover perspective.
That makes the scoring and efficiency differences even more significant.
Tampa Bay did not need multiple takeaways to win. Its offensive execution and defensive disruption were enough to produce the three-point victory.
Special teams played an important supporting role
Special teams statistics can be overlooked when analyzing a box score, but close games often contain several hidden field-position advantages.
Tampa Bay’s Sean Tucker returned three kickoffs for 81 yards, averaging 27.0 yards per return. His longest return was 35 yards.
Kameron Johnson handled one punt return for 54 yards.
That 54-yard punt return stands out as one of the biggest special teams plays in the supplied statistics.
Atlanta used Natrone Brooks and Jamal Agnew on kick returns. Brooks had three returns for 68 yards, while Agnew recorded two returns for 57 yards.
Agnew also returned two punts for 29 yards.
These returns helped both teams create field-position opportunities.
Kicking comparison
Chase McLaughlin scored five points for Tampa Bay.
He went 1-for-2 on field-goal attempts, with a long of 48 yards, and converted two of three extra-point attempts.
Younghoe Koo scored eight points for Atlanta.
He made two of three field-goal attempts, with a long of 41 yards, and converted both extra-point attempts.
Koo therefore produced more points as a kicker.
Yet Tampa Bay still won the game.
That reinforces the larger theme of the matchup: individual statistical advantages were spread across both teams, but Tampa Bay’s most valuable plays came in areas that translated directly into the final score.
Comparing offensive efficiency
A useful way to understand the game is to compare how each team converted its statistical production.
Tampa Bay
The Buccaneers produced:
- 167 passing yards
- 101 rushing yards
- 268 combined passing and rushing yards based on the supplied totals
- Three passing touchdowns
- No interceptions
- 17 receptions
- 23 rushing attempts
Atlanta
The Falcons produced:
- 298 passing yards
- 69 rushing yards
- 367 combined passing and rushing yards based on the supplied totals
- One passing touchdown
- One rushing touchdown
- No interceptions
- 27 receptions
- 28 rushing attempts
Atlanta therefore generated more total offensive yardage.
Yet Tampa Bay scored three more points.
This is perhaps the most interesting statistical feature of the matchup.
The Buccaneers did not win because they accumulated more yards. They won because their scoring production was more efficient.
What the receiving totals reveal
Atlanta recorded 27 receptions compared with Tampa Bay’s 17.
That is a difference of 10 catches.
Atlanta also had 131 more receiving yards.
Despite that, the Falcons had only one receiving touchdown, while Tampa Bay had three.
This creates an important distinction between volume and impact.
A player who catches several short passes can accumulate a large reception total. Another player can have fewer catches but score multiple touchdowns.
Both types of production have value, but touchdowns have a direct effect on the scoreboard.
Egbuka’s four receptions and two touchdowns therefore carried enormous weight.
Robinson’s six receptions and 100 yards were highly productive, but Atlanta needed more scoring efficiency from the rest of its offense.
Explosive plays changed the statistical picture
Explosive plays can distort the relationship between total yardage and overall consistency.
Robinson’s 50-yard reception was Atlanta’s biggest listed receiving play.
Egbuka’s longest reception was 30 yards.
Atlanta therefore demonstrated the ability to create a major chunk play through its passing game.
However, the Falcons did not consistently pair those explosive gains with enough scoring.
Tampa Bay’s offense produced less yardage overall but generated three passing touchdowns.
The game illustrates why analysts should examine both explosive plays and finishing ability.
What the quarterback ratings tell us
Mayfield finished with a 99.3 passer rating, while Penix posted a 93.2 rating.
The difference was only 6.1 rating points.
That indicates the quarterback comparison was closer than the final touchdown totals might suggest.
Both quarterbacks avoided interceptions.
Both were sacked once.
Penix produced substantially more yardage and completions.
Mayfield produced more touchdown passes and ultimately led the winning offense.
The rating comparison therefore provides a more balanced view than simply saying one quarterback played well and the other struggled.
Both produced useful numbers.
The difference was how their production translated into points.
Why Atlanta lost despite leading in several categories
The Falcons had multiple statistical advantages.
They had:
- 298 passing yards versus 167
- 27 receptions versus 17
- 367 combined passing and rushing yards versus 268
- Seven passes defensed versus six
- Two fewer solo tackles than Tampa Bay but strong defensive involvement
- The game’s longest listed reception at 50 yards
Yet Atlanta lost 23-20.
The primary explanation is scoring efficiency.
Tampa Bay threw three touchdown passes.
Atlanta threw one touchdown pass and added one rushing touchdown.
The Buccaneers also gained 101 rushing yards compared with Atlanta’s 69.
So although Atlanta generated more offensive yardage, Tampa Bay produced a better balance between rushing efficiency and touchdown production.
Why Tampa Bay’s victory was statistically unusual
Close NFL games often produce complicated box scores.
This was a particularly good example because the losing team had a substantial yardage advantage.
Atlanta’s 367 combined passing and rushing yards were 99 more than Tampa Bay’s 268 based on the supplied figures.
Normally, that kind of yardage gap would suggest an offensive advantage.
But football outcomes depend on more than yardage accumulation.
A team can move the ball successfully and still leave points on the field.
Tampa Bay avoided interceptions, generated three touchdown passes and averaged 4.4 yards per rushing attempt.
Those factors helped compensate for its lower passing total.
Key player takeaways
Several players stand out when the complete statistical picture is considered.
Baker Mayfield
Mayfield completed 17 of 32 passes for 167 yards and three touchdowns.
His 39 rushing yards also gave Tampa Bay useful production on the ground.
The three touchdown passes were the defining feature of his performance.
Michael Penix Jr.
Penix completed 27 of 42 passes for 298 yards and one touchdown.
He did not throw an interception.
His passing volume and yardage were impressive, but Atlanta needed more points from those opportunities.
Emeka Egbuka
Egbuka caught four passes for 67 yards and two touchdowns.
His two scoring receptions made him one of the most influential players in the game.
Bijan Robinson
Robinson caught six passes for 100 yards and one touchdown.
His 50-yard reception demonstrated his ability to create an explosive gain.
He also recovered an Atlanta fumble without recording a fumble himself.
Tykee Smith
Smith led Tampa Bay with 11 tackles, including seven solo stops.
His defensive involvement was important in a game where the Buccaneers had to withstand Atlanta’s larger passing output.
Jessie Bates III
Bates led Atlanta with seven tackles and two solo tackles.
His production reflected a significant defensive workload despite Atlanta’s defeat.
A practical framework for reading NFL player stats
The best way to analyze a box score is to avoid looking at individual numbers in isolation.
A useful process is:
- Start with the final score.
- Compare quarterback efficiency.
- Check passing and rushing balance.
- Examine touchdowns and turnovers.
- Identify explosive plays.
- Compare defensive disruption.
- Review special teams.
- Look for contradictions between yardage and scoring.
Applying that framework to this game explains the result much more clearly than simply repeating the final score.
The Falcons dominated several volume categories.
The Buccaneers dominated the most important scoring category.
That is the central statistical lesson.
How fans can use player statistics more effectively
Player statistics are most useful when they answer a specific question.
For example, if the question is whether a quarterback played efficiently, look at completion rate, yards per attempt, touchdowns, interceptions, sacks and passer rating together.
If the question concerns a running game, compare attempts, yards and yards per carry.
If the question concerns a receiver, review receptions, yards, average, touchdowns and longest reception.
For defensive players, tackles are useful, but they should be combined with sacks, tackles for loss, quarterback hits and passes defensed.
This approach prevents one impressive number from creating a misleading conclusion.
What this game teaches about box-score analysis
The matchup is a useful case study in why football statistics require context.
Atlanta’s 298 passing yards look excellent.
Penix’s 27 completions also stand out.
Robinson’s 100 receiving yards were impressive.
But Tampa Bay’s three passing touchdowns were more valuable to the final result.
The Buccaneers also gained 101 rushing yards at 4.4 yards per attempt.
That balance helped them score enough points despite producing fewer total yards.
The defensive numbers support the same conclusion.
Tampa Bay registered seven tackles for loss compared with Atlanta’s two. That type of backfield disruption can create negative plays and prevent an offense from maintaining steady drive momentum.
Frequently Asked Questions
Who won the Tampa Bay Buccaneers vs Atlanta Falcons game?
The Tampa Bay Buccaneers defeated the Atlanta Falcons 23-20 on September 7, 2025, in NFL Week 1.
How many yards did Baker Mayfield pass for?
Baker Mayfield passed for 167 yards on 17 completions from 32 attempts. He threw three touchdowns and no interceptions.
How many passing yards did Michael Penix Jr. have?
Michael Penix Jr. passed for 298 yards on 27 completions from 42 attempts. He threw one touchdown and no interceptions.
Who was Tampa Bay’s leading receiver?
Emeka Egbuka led Tampa Bay with four receptions for 67 yards and two touchdowns.
How many receiving yards did Bijan Robinson have?
Bijan Robinson recorded 100 receiving yards on six receptions. He also scored one receiving touchdown.
Which team had more rushing yards?
Tampa Bay had more rushing yards. The Buccaneers recorded 101 yards on 23 carries, while Atlanta had 69 yards on 28 carries.
Conclusion
The atlanta falcons vs tampa bay buccaneers match player stats provide a clear example of why NFL games cannot be judged by yardage totals alone.
Atlanta produced 298 passing yards and 367 combined passing and rushing yards based on the supplied statistics. Michael Penix Jr. completed 27 passes for 298 yards, while Bijan Robinson added 100 receiving yards and a touchdown.
Tampa Bay generated only 167 passing yards but received three touchdown passes from Baker Mayfield. The Buccaneers also rushed for 101 yards at 4.4 yards per carry. Emeka Egbuka contributed two receiving touchdowns, while Tykee Smith led the defense with 11 tackles.
The defensive comparison also favored Tampa Bay in several disruptive categories. The Buccaneers recorded seven tackles for loss, four quarterback hits and one sack. Atlanta had two tackles for loss, three quarterback hits and one sack.
Neither team intercepted a pass, making offensive execution even more important.
Ultimately, Tampa Bay’s 23-20 victory came from converting its opportunities into points more effectively. Atlanta moved the football well, but the Buccaneers produced the more decisive scoring plays.
For anyone studying NFL player statistics, this matchup offers a useful lesson: volume shows how much a player or team produced, while efficiency and scoring often explain why the scoreboard looks different.