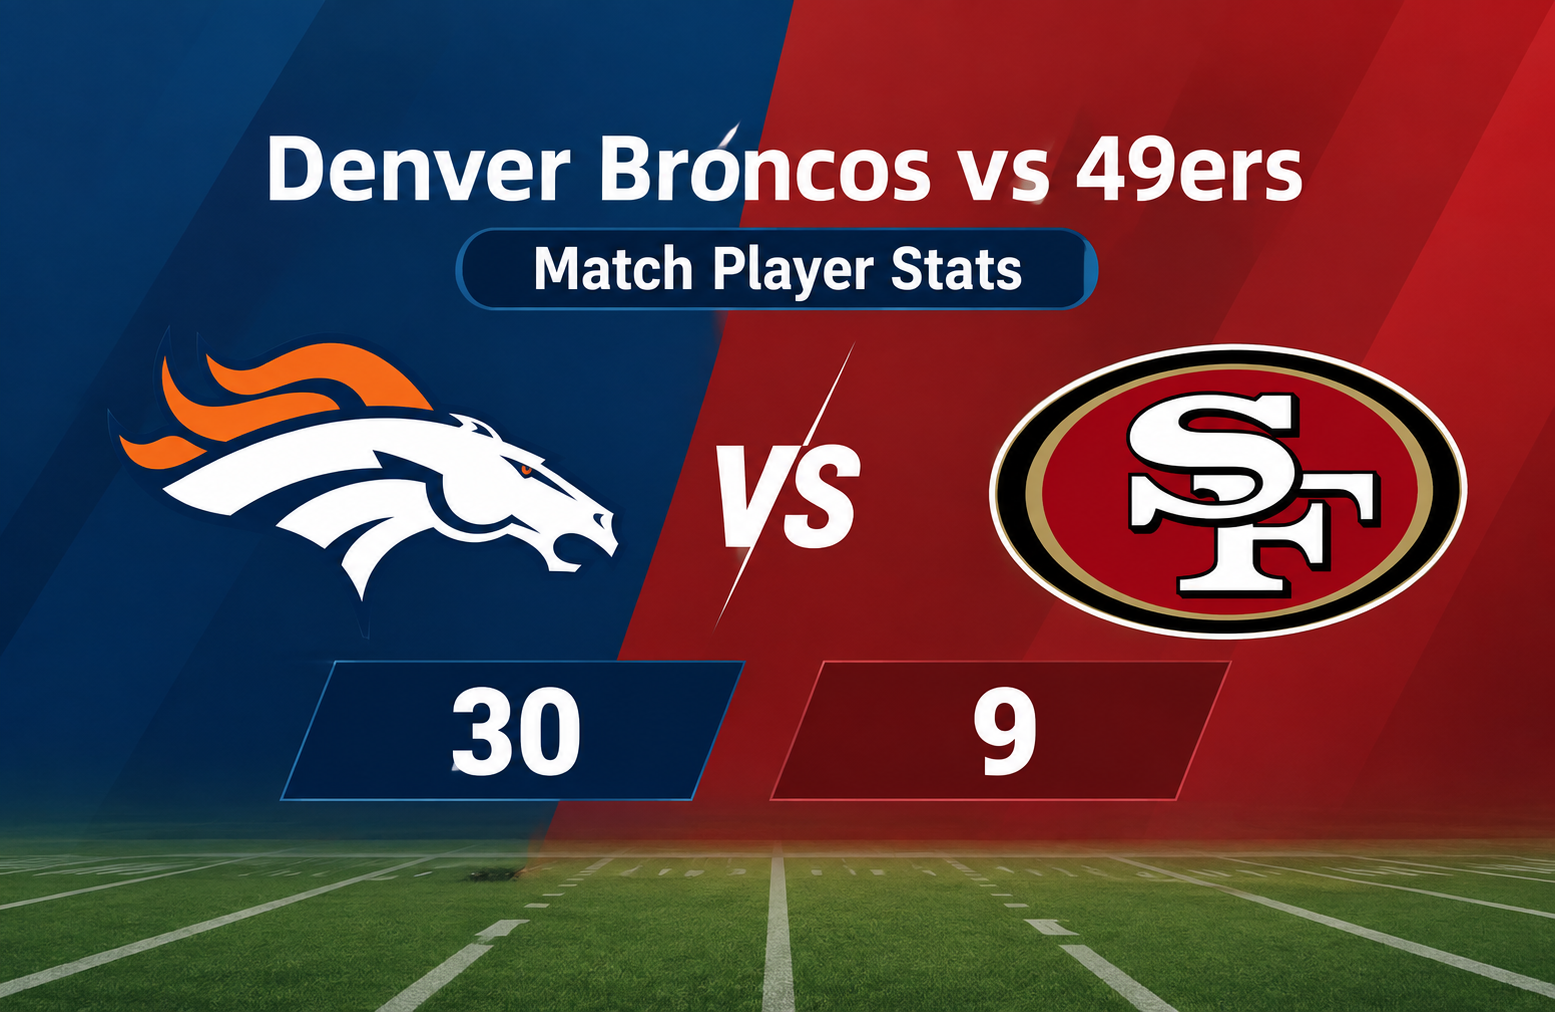
Denver Broncos vs 49ers Match Player Stats
Denver Broncos vs 49ers Match Player Stats from the August 9, 2025 NFL preseason opener tell a much clearer story than the final score alone. Denver defeated San Francisco 30-9, but the most useful part of the game is found in the passing efficiency, turnover margin, quarterback performances, receiving production, defensive pressure, and the way both teams handled their opportunities. Denver finished with 215 passing yards, 153 rushing yards, three passing touchdowns, and three interceptions created on defense, while San Francisco managed only 107 passing yards and threw three interceptions.
For anyone studying the Denver Broncos vs 49ers Match Player Stats, the game provides an interesting preseason snapshot rather than a simple prediction of regular-season performance. Preseason games often involve backups, developing players, and roster competition, so individual performances need to be viewed in context. Even so, several numbers from this matchup stand out because they show how Denver controlled the game and why San Francisco struggled to sustain offensive drives.
Denver Broncos vs 49ers Match Player Stats at a Glance
The matchup took place on August 9, 2025, in NFL Preseason Week 1. Denver finished with a 30-9 victory, moving to 1-0 in the preseason, while San Francisco opened 0-1.
| Category | Denver Broncos | San Francisco 49ers |
| Final Score | 30 | 9 |
| Passing | 26/36, 215 yards | 13/27, 107 yards |
| Passing Average | 6.2 yards | 4.7 yards |
| Passing TDs | 3 | 0 |
| Interceptions Thrown | 0 | 3 |
| Passing Rating | 115.7 | 22.2 |
| Rushing | 34 carries, 153 yards | 23 carries, 96 yards |
| Rushing Average | 4.5 | 4.2 |
| Rushing TDs | 0 | 1 |
| Receiving | 26 receptions, 222 yards | 13 receptions, 127 yards |
| Receiving TDs | 3 | 0 |
| Total Fumbles | 2 | 2 |
| Fumbles Lost | 0 | 1 |
| Defensive Tackles | 56 | 75 |
| Sacks | 3 | 2 |
| Defensive Interceptions | 3 | 0 |
| Field Goals | 3/3 | 0/0 |
| Extra Points | 3/3 | 1/1 |
The statistical difference is striking. Denver was more efficient through the air, more productive on the ground, cleaner with the football, and substantially more effective at creating turnovers.
San Francisco actually recorded more total defensive tackles, 75 compared with Denver’s 56. That number, however, should not be interpreted as evidence that the 49ers defense played better. More tackles can sometimes reflect an offense that is repeatedly allowed to move the ball and therefore creates more defensive opportunities.
How Denver Controlled the Game
The 30-9 scoreline was supported by several statistical advantages.
Denver completed 26 of 36 passes, giving the team a completion rate of roughly 72.2 percent. San Francisco completed only 13 of 27 passes, or about 48.1 percent. That difference alone helps explain why Denver consistently produced more useful offensive possessions.
The Broncos also finished with 215 passing yards compared with 107 for the 49ers. Denver averaged 6.2 yards per pass in the supplied statistics, while San Francisco averaged 4.7.
The biggest difference came in touchdowns and turnovers.
Denver threw three touchdown passes and no interceptions. San Francisco threw no touchdown passes and three interceptions. That is a seven-touchdown-equivalent swing in the basic scoring impact of those passing plays, although actual scoring depends on field position and what happens after turnovers.
Denver also converted all three field-goal attempts. San Francisco did not attempt a field goal and made its only extra-point attempt.
This combination meant Denver was able to turn offensive production into points while San Francisco repeatedly ended possessions without generating comparable scoring opportunities.
Jarrett Stidham Was Denver’s Standout Quarterback
Jarrett Stidham delivered the strongest individual passing performance for Denver.
Stidham completed 14 of 15 passes for 136 yards, threw two touchdowns, and did not throw an interception. His reported passer rating was 144.0.
His completion rate was approximately 93.3 percent, which was easily one of the most efficient individual performances in the supplied statistics.
The important detail is not simply the number of completions. Stidham was productive while protecting the football. A quarterback completing 14 of 15 passes while adding two touchdown passes and zero interceptions gives an offense a strong foundation, especially in a preseason setting where players are competing for roster positions and playing time.
Stidham also led Denver in rushing with three carries for 36 yards. His 12.0 yards per carry average was the highest rushing average among the Denver players identified in the supplied data.
That rushing contribution adds another layer to his performance. His passing numbers were already excellent, but his ability to gain 36 yards on limited rushing opportunities also contributed to Denver’s overall offensive output.
Denver’s Passing Game Was Efficient
The Broncos’ overall passing numbers deserve attention beyond Stidham.
Denver completed 26 of 36 attempts for 215 yards and three touchdowns. The team did not throw an interception.
A 72.2 percent completion rate combined with 215 yards and three touchdowns represents a highly efficient passing performance. The offense also produced 222 receiving yards on 26 receptions, with 35 total targets.
The average reception figure was 8.5 yards according to the supplied data. Denver also recorded a longest reception of 36 yards.
That balance matters because the Broncos did not rely entirely on one explosive play. They produced 26 completed passes and spread the ball effectively enough to create three receiving touchdowns.
The absence of interceptions was equally important. Denver’s offense gave its defense opportunities without giving San Francisco the same kind of short-field chances.
Trent Sherfield Produced Denver’s Biggest Receiving Play
Trent Sherfield was Denver’s leading receiver in the supplied statistics.
He recorded three receptions for 73 yards, averaging 24.3 yards per reception. He also scored one touchdown and produced the longest Denver reception of the game at 36 yards.
His 73 receiving yards represented approximately one-third of Denver’s 222 team receiving yards.
The efficiency is particularly notable. Three catches producing 73 yards means Sherfield was not simply collecting short passes and adding small gains. His average of 24.3 yards per reception shows that his opportunities produced significant chunks of field position.
The 36-yard long reception also shows the type of explosive play that can change a preseason game. One big completion can move an offense from midfield into scoring territory, and those plays become even more valuable when the defense is struggling to create turnovers.
Denver’s Rushing Attack Added Balance
Denver ran the ball 34 times for 153 yards.
That worked out to 4.5 yards per carry, with a longest run of 18 yards. Although Denver did not score a rushing touchdown, the ground game still played an important role.
A 153-yard rushing total gave Denver another way to maintain possession and move the football. It also prevented the offense from becoming completely dependent on passing production.
The most unusual detail is that Stidham was listed as Denver’s leading rusher despite having only three carries. His 36 yards came at an impressive 12.0-yard average.
The team-wide rushing numbers show that Denver’s production was not limited to one quarterback’s performance. The Broncos combined 34 rushing attempts with 36 passing attempts, giving them a relatively balanced offensive workload.
San Francisco’s Passing Game Faced Major Problems
The San Francisco passing statistics were the clearest weakness in the matchup.
The 49ers completed 13 of 27 passes for only 107 yards. Their completion rate was approximately 48.1 percent, and the team averaged 4.7 yards per passing attempt according to the supplied statistics.
Most importantly, San Francisco threw three interceptions and zero touchdown passes.
The reported passer rating for the team was only 22.2.
This combination made it difficult for San Francisco to sustain scoring drives. Even when the offense gained some field position, incomplete passes and turnovers limited the number of possessions that could develop into meaningful scoring opportunities.
The 49ers also took three sacks for 20 yards. Sacks are not recorded as passing attempts in the same way as completions and incompletions, but they still represent lost yardage and can put an offense behind schedule.
Mac Jones Led San Francisco in Passing
Mac Jones was San Francisco’s leading passer based on the supplied statistics.
He completed four of seven passes for 74 yards. He did not throw a touchdown and was intercepted once. His reported passer rating was 54.2.
The 74 passing yards represented the majority of San Francisco’s 107 team passing yards.
Jones averaged 10.6 yards per completion attempt in the supplied figures, helped by the team’s explosive 50-yard longest completion. However, the interception and lack of touchdown production prevented that yardage from translating into a strong overall passing performance.
This is a useful example of why raw yardage should not be evaluated alone. A quarterback can produce a large gain and still finish with modest efficiency if the offense fails to convert those opportunities into points or turns the ball over.
Jordan Watkins Provided San Francisco’s Biggest Receiving Threat
Jordan Watkins led the 49ers in receiving.
He finished with three receptions for 56 yards, averaging 18.7 yards per reception. His longest reception was 50 yards.
The 50-yard reception was the longest receiving play listed for either team.
That is important because San Francisco did demonstrate explosive potential despite its overall offensive struggles. A 50-yard reception shows that the 49ers could generate a major play when the opportunity was there.
The problem was consistency.
San Francisco finished with only 13 receptions for 127 yards and zero receiving touchdowns. Watkins’ 56 yards accounted for a substantial share of that total, meaning the offense needed more consistent production from the rest of the passing game.
Corey Kiner Led the 49ers on the Ground
Corey Kiner was San Francisco’s leading rusher.
He carried the ball 10 times for 45 yards, averaging 4.5 yards per carry.
His production was close to the overall San Francisco rushing average of 4.2 yards per carry.
The 49ers ran 23 times for 96 yards and scored one rushing touchdown. Compared with Denver’s 34 carries for 153 yards, San Francisco had fewer rushing attempts and fewer total rushing yards.
The rushing attack was not completely ineffective. A 4.2-yard team average is respectable on a per-carry basis. The bigger issue was the overall offensive balance and the inability to combine rushing production with efficient passing.
Turnovers Were One of the Biggest Differences
The turnover battle strongly favored Denver.
The Broncos intercepted San Francisco three times. San Francisco recorded no interceptions.
Denver had two fumbles but lost none. San Francisco also had two fumbles, but one was lost.
That means Denver finished with no lost fumbles and no interceptions, while San Francisco lost one fumble and threw three interceptions.
In practical terms, San Francisco gave the Broncos four turnovers through interceptions and a lost fumble.
Those extra possessions can be decisive because turnovers often change field position while also ending an opponent’s offensive possession.
Denver’s defense therefore contributed directly to the 30-point result rather than simply stopping drives through punts.
Denver’s Defense Created Pressure and Turnovers
Denver recorded 56 tackles, including 37 solo tackles.
The defense also produced three sacks, four tackles for loss, six passes defended, and four quarterback hits.
The three interceptions stand out most clearly.
The Broncos did not need to dominate the tackle count to control the game. Their ability to generate disruptive plays was more important. Interceptions ended San Francisco possessions immediately, while sacks and quarterback hits created additional pressure.
The four quarterback hits show that Denver’s defenders were able to affect the quarterback even on plays that did not finish as sacks.
Six passes defended also indicate active coverage.
Taken together, the numbers suggest a defense that was effective at creating negative or possession-changing outcomes.
San Francisco Recorded More Tackles, But That Number Needs Context
San Francisco’s defense recorded 75 tackles, including 51 solo tackles.
It also produced two sacks, five tackles for loss, four passes defended, and three quarterback hits.
At first glance, 75 tackles compared with Denver’s 56 may look like a significant defensive advantage for San Francisco. But tackle totals are highly dependent on how many plays an opposing offense runs and how much time the defense spends on the field.
Denver’s offense completed 26 passes and ran 34 rushing attempts. Those 60 recorded pass and rush attempts created many opportunities for San Francisco defenders to make tackles.
More importantly, San Francisco did not record an interception.
The defense also allowed three passing touchdowns and Denver’s offense finished with 222 receiving yards.
This is why defensive statistics should be evaluated as a group rather than by one category.
The Passing Efficiency Gap Explains Much of the Score
One of the strongest ways to understand this matchup is to compare the efficiency of the two passing attacks.
Denver:
- 26 completions on 36 attempts
- 215 passing yards
- 3 passing touchdowns
- 0 interceptions
- 115.7 team passer rating
San Francisco:
- 13 completions on 27 attempts
- 107 passing yards
- 0 passing touchdowns
- 3 interceptions
- 22.2 team passer rating
Denver completed 13 more passes while throwing three fewer interceptions and three more touchdown passes.
That is a massive statistical gap.
Even though preseason statistics should not automatically be used to forecast the regular season, this particular difference explains why Denver was able to establish control.
The Broncos were efficient without being careless. The 49ers were unable to match that combination.
The Receiving Numbers Tell a Similar Story
Denver recorded 26 receptions for 222 yards and three touchdowns on 35 targets.
San Francisco recorded 13 receptions for 127 yards and zero touchdowns on 23 targets.
Denver therefore doubled San Francisco’s number of receptions.
The Broncos also gained 95 more receiving yards.
San Francisco did have the more explosive individual longest reception, with a 50-yard catch compared with Denver’s 36-yard long play. But Denver generated more overall receiving production.
This distinction is important.
Explosive plays can change a game, but consistent completion volume can keep an offense moving. Denver combined both reliable completion volume and enough big plays to create touchdowns.
Rushing Comparison Shows Denver’s Overall Offensive Balance
Denver’s 153 rushing yards came on 34 attempts, compared with 96 yards on 23 attempts for San Francisco.
The Broncos averaged 4.5 yards per carry.
The 49ers averaged 4.2.
The per-carry difference was small, but Denver had 11 more rushing attempts and 57 more rushing yards.
This indicates that Denver’s advantage was not based on dramatically superior rushing efficiency. Instead, the Broncos generated more total rushing volume while maintaining a slightly higher average.
San Francisco did score the only rushing touchdown between the two teams, but Denver’s overall offensive production was still substantially higher.
Special Teams Also Favored Denver
Denver made all three of its field-goal attempts.
The Broncos went 3-for-3 on field goals, with a longest successful kick of 45 yards. They also made all three extra-point attempts.
That produced 12 points from the kicking unit.
San Francisco did not attempt a field goal and converted its only extra-point attempt.
The difference in kicking production added another layer to Denver’s scoring advantage.
Denver’s punting numbers were three punts for 111 yards, averaging 37.0 yards per punt. San Francisco punted five times for 202 yards, averaging 40.4 yards per punt, with two punts placed inside the 20-yard line.
San Francisco therefore had the better raw punting average and two inside-20 punts, but the overall special-teams scoring advantage belonged to Denver because of the three successful field goals.
Return Game Comparison
Denver recorded one kick return for 28 yards.
San Francisco had seven kick returns for 152 yards, averaging 21.7 yards per return. The longest 49ers kick return was 26 yards.
On punt returns, Denver recorded three returns for 37 yards, averaging 12.3 yards per return. The longest Denver punt return was 25 yards.
San Francisco had one punt return for 28 yards, averaging 28.0 yards, with a 28-yard long return.
These numbers show that San Francisco had more kick-return opportunities, while Denver generated more punt-return attempts.
Return statistics are heavily influenced by kicking strategy and the number of opportunities, so they should not be treated as a simple measure of overall special-teams superiority.
Why the Turnover Margin Matters So Much
Turnovers are often the quickest way to explain a large scoring difference.
Denver committed no lost fumbles and threw no interceptions.
San Francisco threw three interceptions and lost one fumble.
That four-turnover disadvantage put the 49ers in a difficult position.
Every interception ended an offensive drive. The lost fumble also removed another possession.
Meanwhile, Denver protected its possessions well enough to avoid giving San Francisco equivalent opportunities.
The result was not simply that Denver gained more yards. The Broncos also did a better job converting possessions into scoring chances while avoiding the kind of mistakes that can reverse momentum.
What the Quarterback Numbers Really Show
The quarterback statistics deserve more careful interpretation than simply naming the winning team’s passer.
Stidham’s 14-for-15 performance was extremely efficient. His 136 yards, two touchdowns, and zero interceptions produced a 144.0 rating.
Jones completed four of seven passes for 74 yards with one interception and a 54.2 rating.
The difference in efficiency is clear.
However, preseason quarterback statistics have limitations. Players can operate with different supporting casts, different amounts of playing time, and different levels of defensive competition. Therefore, the numbers are best used to describe what happened in this game rather than as a standalone forecast of future regular-season performance.
That distinction is especially important when evaluating a Week 1 preseason game.
What the Player Stats Say About Offensive Execution
The Broncos’ offensive performance can be summarized through four main areas:
- Accuracy: Denver completed 26 of 36 passes.
- Scoring efficiency: The offense produced three passing touchdowns.
- Ball security: Denver threw zero interceptions and lost no fumbles.
- Balance: Denver produced 153 rushing yards alongside 215 passing yards.
San Francisco had only 107 passing yards and 96 rushing yards.
The 49ers were not completely ineffective on the ground, but their passing game failed to provide enough consistent support.
The most damaging factor was the three interceptions.
What the Player Stats Say About Defensive Execution
Denver’s defensive numbers show why the Broncos were able to create such a large margin.
Three interceptions were the most important statistic.
The defense also produced:
- 3 sacks
- 4 tackles for loss
- 6 passes defended
- 4 quarterback hits
- 56 total tackles
- 37 solo tackles
The 49ers defense recorded more total tackles but fewer game-changing plays.
San Francisco produced two sacks, five tackles for loss, four passes defended, and three quarterback hits.
The comparison suggests that Denver was better at converting defensive pressure into possession-changing results.
Biggest Individual Performers
Based on the supplied game statistics, several players stand out.
Denver Broncos
Jarrett Stidham: 14/15 passing, 136 yards, two touchdowns, zero interceptions, 144.0 rating.
Trent Sherfield: Three receptions, 73 yards, 24.3 yards per reception, one touchdown, 36-yard long reception.
Jarrett Stidham rushing: Three carries, 36 yards, 12.0 yards per carry.
San Francisco 49ers
Mac Jones: 4/7 passing, 74 yards, zero touchdowns, one interception, 54.2 rating.
Corey Kiner: 10 carries, 45 yards, 4.5 yards per carry.
Jordan Watkins: Three receptions, 56 yards, 18.7 yards per reception, 50-yard long reception.
These performances provide a useful starting point for anyone reviewing individual contributions rather than focusing only on the 30-9 final score.
A Deeper Look at Denver’s 30 Points
Denver scored 30 points through a combination of passing touchdowns, field goals, and extra points.
The supplied statistics show three passing touchdowns and three successful field goals. The Broncos also converted all three extra-point attempts.
This is important because Denver did not rely on one scoring method.
The passing game generated touchdowns, while the kicking game converted three field-goal opportunities. That combination reduced the pressure on the offense to finish every drive with a touchdown.
San Francisco, meanwhile, scored only nine points despite producing one rushing touchdown and one successful extra point.
The limited passing touchdown production was a major reason the 49ers could not keep pace.
A Deeper Look at San Francisco’s 9 Points
San Francisco’s nine points illustrate the problem created by inconsistent offensive execution.
The team scored one rushing touchdown, which provided six points, and converted one extra point.
The supplied data show no passing touchdowns and no field goals.
That means the 49ers did not create enough scoring variety.
Even when San Francisco produced a major play, such as the 50-yard reception by Watkins, the offense needed more sustained drives and more reliable finishing ability.
The result was nine points against a Denver team that reached 30.
Why Yardage Alone Does Not Explain This Game
A common mistake when reading football statistics is to focus only on total yards.
The more useful approach is to combine yardage with efficiency and turnovers.
Denver had:
- 215 passing yards
- 153 rushing yards
- 368 combined passing and rushing yards
San Francisco had:
- 107 passing yards
- 96 rushing yards
- 203 combined passing and rushing yards
Denver therefore produced 165 more combined passing and rushing yards.
That is significant, but the turnover margin makes the difference even clearer.
Denver combined greater yardage with zero interceptions and zero lost fumbles. San Francisco combined lower yardage with three interceptions and one lost fumble.
The final score reflected both advantages.
What Can Be Learned From the Game
The most useful lesson from these Denver Broncos vs 49ers Match Player Stats is that efficiency often matters more than individual highlight plays.
San Francisco produced a 50-yard reception, and its punt return average was 28.0 yards on one return. Corey Kiner also averaged 4.5 yards per carry.
Yet Denver still won comfortably.
Why?
Because Denver consistently produced successful plays across multiple phases.
The Broncos completed passes at a much higher rate, generated three passing touchdowns, protected the football, ran for more yards, and created three interceptions.
This is a good example of why complete statistical analysis should examine the entire game rather than one impressive individual number.
Preseason Context Matters
It is important not to treat the August 9 matchup as a direct prediction of the regular season.
NFL preseason games are designed partly to evaluate players, combinations, depth, and roster competition. Starters and backups may receive different workloads, and coaching staffs may limit the playbook.
For that reason, the most responsible interpretation is that these numbers describe performance in this particular preseason game.
Stidham’s 144.0 rating was outstanding in the game. Sherfield’s 73 receiving yards were significant. Watkins’ 50-yard reception showed explosive ability.
But none of those statistics alone guarantees what will happen in later games.
The value of preseason statistics is often found in identifying which players took advantage of their opportunities.
How to Read These Stats More Effectively
When reviewing a preseason box score, use a simple process.
Start With Team Efficiency
Look at completion percentage, yards per attempt, rushing average, and scoring.
Check Turnovers
Determine which team protected the football and which defense created takeaways.
Separate Volume From Efficiency
A player with many carries or targets may accumulate statistics through opportunity. Compare those numbers with yards per carry, yards per reception, completion percentage, or passer rating.
Identify Explosive Plays
Long receptions, long runs, and return plays can reveal players capable of changing field position quickly.
Consider Playing Time
Preseason statistics are strongly affected by workload. A player with limited opportunities may still produce a very efficient performance.
This approach creates a much more useful picture than simply sorting players by total yards.
Most Important Statistical Takeaways
The core numbers from the matchup can be summarized as follows:
- Denver won 30-9.
- Denver completed 26 of 36 passes.
- San Francisco completed 13 of 27 passes.
- Denver threw three touchdown passes.
- San Francisco threw zero touchdown passes.
- Denver threw zero interceptions.
- San Francisco threw three interceptions.
- Denver rushed for 153 yards.
- San Francisco rushed for 96 yards.
- Denver recorded 222 receiving yards.
- San Francisco recorded 127 receiving yards.
- Denver made all three field-goal attempts.
- San Francisco did not attempt a field goal.
- Jarrett Stidham led Denver’s passing performance.
- Trent Sherfield led Denver in receiving.
- Corey Kiner led San Francisco in rushing.
- Jordan Watkins led San Francisco in receiving.
- Denver’s defense recorded three interceptions.
- San Francisco’s defense recorded none.
Together, these statistics explain the outcome far better than the final score by itself.
Denver Broncos vs 49ers Match Player Stats: Overall Assessment
The Denver Broncos vs 49ers Match Player Stats show a clear statistical advantage for Denver in the areas that most directly influenced scoring.
Denver’s offense was accurate and productive. The Broncos completed more than 72 percent of their passes, generated 215 passing yards, added 153 rushing yards, and scored three passing touchdowns.
Stidham was the most efficient individual quarterback in the supplied statistics, completing 14 of 15 attempts and throwing two touchdowns without an interception. Sherfield provided an explosive receiving contribution with 73 yards and a touchdown.
San Francisco had a few bright spots. Watkins produced a 50-yard reception and 56 total receiving yards. Kiner ran effectively at 4.5 yards per carry. The 49ers defense also recorded 75 tackles and five tackles for loss.
However, those positives were overshadowed by the offensive turnover problem.
Three interceptions and a lost fumble created too many extra opportunities for Denver. The 49ers also finished with only 107 passing yards and no passing touchdowns.
Denver’s 30-9 win was therefore supported by a combination of passing efficiency, offensive balance, ball security, defensive takeaways, and reliable kicking.
The most important takeaway is not that every Denver player had better individual numbers. Instead, the game shows how several moderate advantages can combine into a decisive result. Denver was more efficient through the air, generated more total offensive yardage, avoided costly turnovers, and created turnovers on defense.
For readers studying the box score, those connections provide the clearest explanation of what happened on August 9, 2025.
Frequently Asked Questions
Who won the Denver Broncos vs 49ers preseason game?
The Denver Broncos defeated the San Francisco 49ers 30-9 on August 9, 2025, in NFL Preseason Week 1.
Who was Denver’s leading passer?
Jarrett Stidham was Denver’s leading passer. He completed 14 of 15 passes for 136 yards, two touchdowns, zero interceptions, and a 144.0 passer rating.
Who was the 49ers’ leading passer?
Mac Jones led San Francisco in passing with four completions on seven attempts for 74 yards, zero touchdowns, one interception, and a 54.2 passer rating.
Who led Denver in receiving?
Trent Sherfield led Denver in receiving with three catches for 73 yards, averaging 24.3 yards per reception. He also scored one touchdown.
Who led San Francisco in rushing?
Corey Kiner led the 49ers in rushing with 10 carries for 45 yards, averaging 4.5 yards per carry.
How many interceptions did Denver record?
Denver’s defense recorded three interceptions, while San Francisco recorded none.
Conclusion
The August 9, 2025 preseason meeting between Denver and San Francisco produced a convincing 30-9 result, and the underlying statistics make the outcome easy to understand.
Denver’s passing attack was the biggest difference. The Broncos completed 26 of 36 attempts for 215 yards, produced three touchdown passes, and avoided interceptions. Jarrett Stidham led the passing effort with an exceptional 14-for-15 performance, while Trent Sherfield delivered Denver’s leading receiving performance.
The rushing game added another 153 yards, giving Denver a balanced offensive profile. The defense then strengthened that advantage by producing three interceptions, three sacks, and six passes defended.
San Francisco had individual highlights, including Jordan Watkins’ 50-yard reception and Corey Kiner’s 45 rushing yards. The 49ers also recorded more defensive tackles than Denver. However, the offense struggled to maintain efficiency and lost the turnover battle decisively.
Ultimately, the most revealing part of the box score is the combination of efficiency and ball security. Denver moved the ball more effectively, scored more touchdowns, converted its field-goal opportunities, and avoided giving San Francisco the extra possessions that turnovers create.
For anyone analyzing the game beyond the final score, those are the numbers that best explain Denver’s 30-9 victory.