Miami Dolphins vs Chicago Bears Match Player Stats
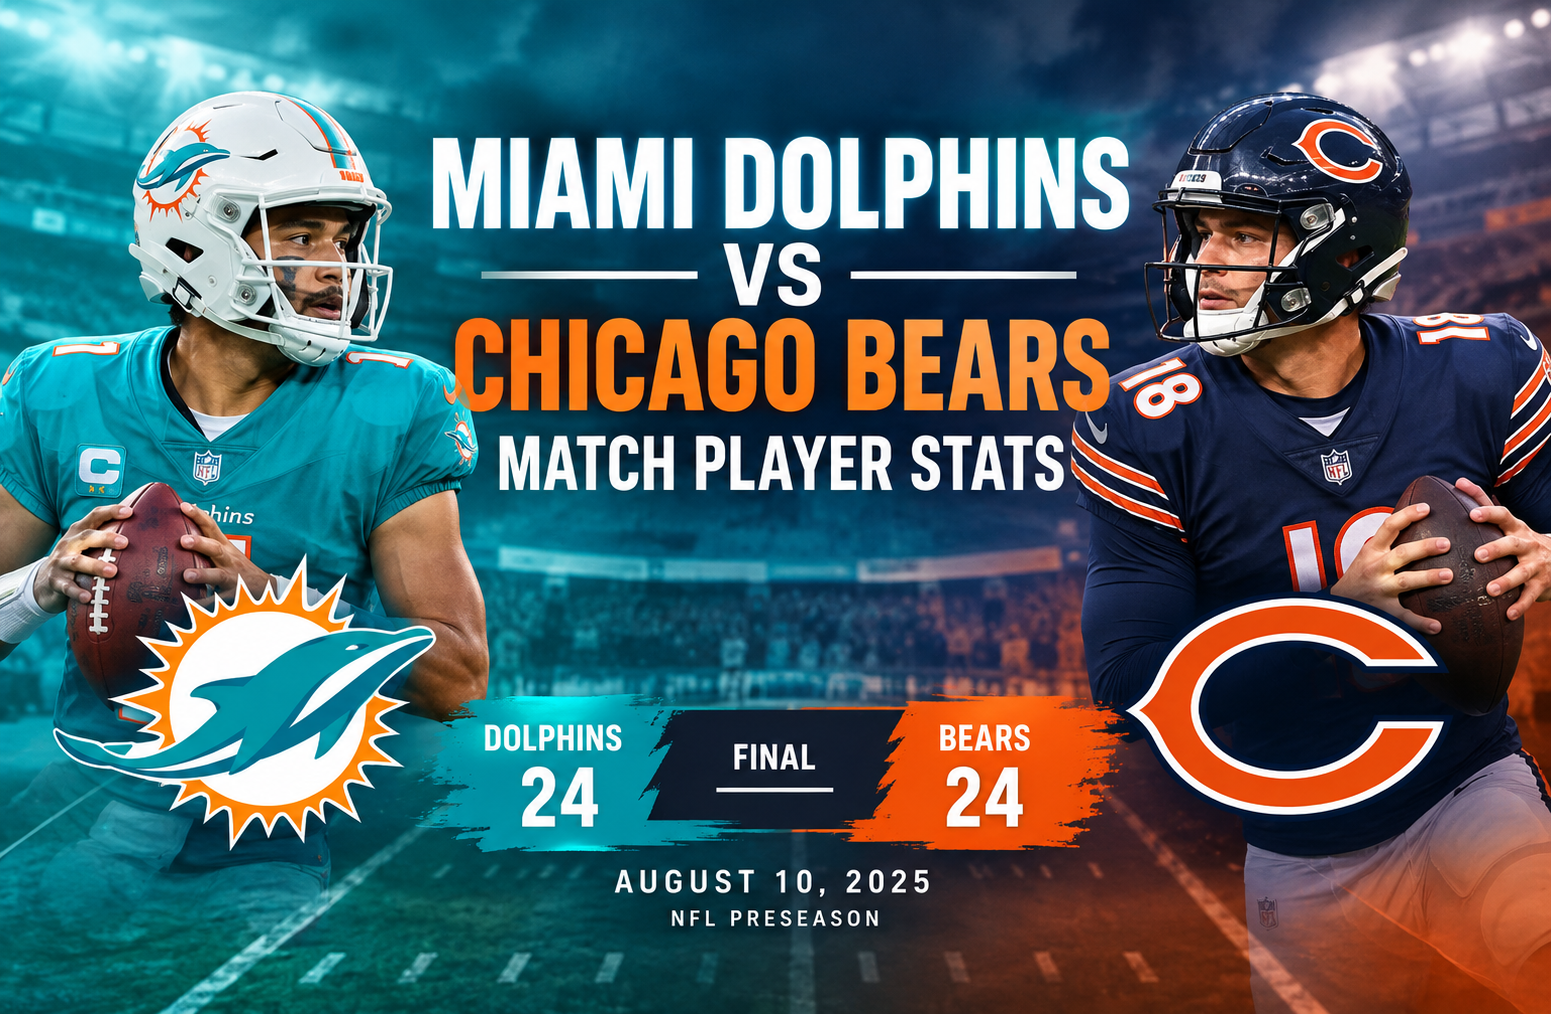
The miami dolphins vs chicago bears match player stats from the August 10, 2025 NFL preseason opener tell a more interesting story than the 24-24 final score alone. Miami and Chicago finished level, but the underlying numbers reveal different offensive profiles. Chicago produced more passing yards, first downs, total yards, and passing touchdowns, while Miami generated three rushing touchdowns and made several explosive plays through the air. The game also gave quarterbacks, running backs, receivers, defenders, and special teams players meaningful opportunities to show where they stood during preseason evaluation. (ESPN)
The game was played at Chicago, with the Bears entering a new coaching era under Ben Johnson. Miami used Tua Tagovailoa for one series before moving to Zach Wilson and Quinn Ewers, while Chicago rotated Tyson Bagent, Case Keenum, and Austin Reed. The result was a 24-24 tie, with Miami scoring 14 points in the second quarter and 10 in the fourth, while Chicago scored 10 in the second, seven in the third, and seven in the fourth. (ESPN)
Miami Dolphins vs Chicago Bears Match Player Stats
Here is the core statistical picture from the game:
| Category | Miami Dolphins | Chicago Bears |
| Final score | 24 | 24 |
| Total yards | 272 | 295 |
| Passing yards | 171 | 205 |
| Rushing yards | 101 | 90 |
| Passing touchdowns | 0 | 3 |
| Interceptions thrown | 0 | 1 |
| Sacks allowed | 6 | 3 |
| First downs | 16 | 22 |
| Third down | 7/16 | 6/14 |
| Fourth down | 2/5 | 1/4 |
| Total plays | 65 | 66 |
| Yards per play | 4.2 | 4.5 |
| Red zone | 3/4 | 3/4 |
| Turnovers | 2 | 1 |
| Time of possession | 26:50 | 33:10 |
The numbers show why a simple look at the final score does not fully explain the game. Chicago gained 23 more total yards and six more first downs, while Miami gained 11 more rushing yards. Chicago also had the advantage in time of possession, holding the ball for 33:10 compared with Miami’s 26:50. (ESPN)
At the same time, Miami’s offense created three rushing touchdowns and avoided an interception through the air. Chicago scored all three of its touchdowns through the passing game, but the Bears also threw one interception and lost no fumbles.
That contrast is one of the most useful themes when studying the box score.
How the 24-24 Game Developed
The opening quarter ended scoreless, but Miami’s first long offensive possession showed the type of control the Dolphins wanted from their starters.
Tagovailoa led a 15-play drive that covered 54 yards. Miami eventually failed to score after Chicago stopped the Dolphins near the goal line. Tagovailoa completed five of six passes for 27 yards during his appearance. (ESPN)
Miami broke through in the second quarter when Alexander Mattison scored on a one-yard rushing touchdown. Jaylen Wright then added another seven-yard rushing touchdown later in the quarter.
Chicago answered with a touchdown pass from Tyson Bagent to Maurice Alexander. The Bears entered halftime trailing 14-10.
The third quarter shifted toward Chicago. Case Keenum connected with Deion Hankins for a four-yard touchdown, putting Chicago ahead 17-14.
Miami regained control in the fourth quarter when Ollie Gordon II scored on a one-yard rushing touchdown. Chicago responded with another Keenum touchdown pass, this time a 14-yard completion to Jahdae Walker.
With 6:22 remaining, Jason Sanders converted a 56-yard field goal to tie the game at 24-24. Neither side produced another scoring drive. (ESPN)
That sequence is important because the game did not simply progress as a back-and-forth exchange of field goals. Both teams produced touchdown drives at different stages, and several players competing for roster opportunities contributed directly to the scoring.
Miami Passing Performance
Miami finished with 15 completions on 33 attempts for 171 yards. The Dolphins averaged 6.5 yards per completed pass attempt in the supplied player statistics and finished with a 67.0 passer rating.
The quarterback breakdown was:
| Quarterback | Comp/Att | Yards | TD | INT | Sacks | Rating |
| Zach Wilson | 5/9 | 96 | 0 | 0 | 4-24 | 92.8 |
| Quinn Ewers | 5/18 | 91 | 0 | 0 | 2-19 | 48.1 |
| Tua Tagovailoa | 5/6 | 27 | 0 | 0 | 0-0 | 85.4 |
| Team | 15/33 | 171 | 0 | 0 | 6-43 | 67.0 |
Tua Tagovailoa’s Short Appearance
Tagovailoa’s numbers were limited because he played only one series.
He completed five of six passes for 27 yards and did not throw an interception. More important than the raw yardage was the fact that Miami moved the offense consistently enough to sustain a 15-play possession.
The Dolphins did not finish that drive with points, however. Chicago’s goal-line stand prevented the opening possession from becoming a touchdown drive. (ESPN)
For preseason analysis, this is a useful reminder that quarterback statistics must be read alongside playing time and game situation. A quarterback completing five of six passes over one series cannot be compared directly with another quarterback who plays several quarters without considering opportunity.
Zach Wilson’s Explosive Passing
Wilson produced Miami’s largest passing yardage total.
He completed five of nine attempts for 96 yards, averaging 10.7 yards per completion in the supplied statistics. His 92.8 passer rating was also higher than Ewers’ 48.1.
However, Wilson was sacked four times for 24 yards. That means his passing production came with significant negative plays.
The most interesting part of his line is therefore the combination of efficiency and pressure. He generated 96 passing yards on only nine attempts, but the offense also surrendered four sacks during his time.
For anyone studying the quarterback competition, that creates a more useful question than simply asking who had more yards. The better question is how much of each quarterback’s production came from efficient decisions, explosive throws, protection, and opportunities created by the supporting cast.
Quinn Ewers’ Difficult Statistical Line
Ewers completed five of 18 passes for 91 yards.
The 91 yards are respectable in isolation, but the completion percentage and 48.1 rating make the performance much harder to interpret positively from a pure passing-efficiency perspective.
Ewers did avoid an interception, which matters. He also absorbed two sacks for 19 yards.
His statistical line illustrates why preseason quarterback evaluation cannot rely on a single number. A quarterback can avoid turnovers while still struggling to sustain drives, and a quarterback can generate yardage while taking too many sacks.
Chicago Passing Performance
Chicago’s passing game produced 205 yards, three touchdowns, and one interception on 26 completions from 39 attempts.
| Quarterback | Comp/Att | Yards | TD | INT | Sacks | Rating |
| Tyson Bagent | 13/19 | 103 | 1 | 1 | 2-10 | 77.3 |
| Case Keenum | 8/10 | 80 | 2 | 0 | 1-9 | 139.6 |
| Austin Reed | 5/10 | 41 | 0 | 0 | 0-0 | 60.8 |
| Team | 26/39 | 205 | 3 | 1 | 3-19 | 96.5 |
Tyson Bagent’s Work
Bagent led Chicago in passing attempts and completions.
He completed 13 of 19 passes for 103 yards, one touchdown, and one interception. He was also sacked twice for 10 yards.
His 77.3 rating was below Keenum’s mark, but Bagent handled a larger passing workload.
His rushing contribution was also notable. He carried once for nine yards, averaging 9.0 yards per carry.
Case Keenum’s Efficient Production
Keenum had one of the strongest statistical lines of the game.
He completed eight of 10 attempts for 80 yards and two touchdowns without an interception. His listed passer rating was 139.6.
Both of Chicago’s late touchdowns came from Keenum. He threw the four-yard touchdown pass to Deion Hankins in the third quarter and the 14-yard touchdown to Jahdae Walker in the fourth. (ESPN)
His production demonstrates how quarterback efficiency can influence a preseason game even with a relatively small number of attempts.
Austin Reed’s Appearance
Reed completed five of 10 passes for 41 yards.
He did not throw a touchdown or interception and was not sacked. His 60.8 passer rating reflected the limited offensive output during his snaps.
Again, preseason numbers need context. Reed’s ten attempts provide a much smaller sample than a full regular-season game.
Miami’s Rushing Attack
Miami ran the ball 26 times for 101 yards and three touchdowns.
The Dolphins averaged 3.9 yards per rushing attempt and had a longest run of 21 yards.
| Player | Carries | Yards | Average | TD | Long |
| Ollie Gordon II | 8 | 33 | 4.1 | 1 | 21 |
| De’Von Achane | 3 | 22 | 7.3 | 0 | 11 |
| Jaylen Wright | 9 | 16 | 1.8 | 1 | 7 |
| Zach Wilson | 2 | 16 | 8.0 | 0 | 8 |
| Alexander Mattison | 3 | 8 | 2.7 | 1 | 7 |
| Malik Washington | 1 | 6 | 6.0 | 0 | 6 |
Ollie Gordon II
Gordon was Miami’s leading rusher by yardage, carrying eight times for 33 yards and a touchdown.
His 21-yard run was Miami’s longest rushing play of the night.
He also contributed in the passing game with one reception for 39 yards. That gave him 72 yards from scrimmage on the supplied statistics.
That receiving contribution is particularly useful when evaluating his overall offensive involvement rather than looking only at rushing attempts.
De’Von Achane’s Limited but Efficient Work
Achane carried three times for 22 yards.
His 7.3 yards per carry was Miami’s best mark among players with multiple rushing attempts. His longest run covered 11 yards.
Because his workload was small, the number should not be treated as evidence of a full-game rushing performance. It does, however, show that Miami produced explosive rushing yardage from limited opportunities.
Jaylen Wright’s Touchdown
Wright led Miami in rushing attempts with nine.
He gained 16 yards and scored once, producing a 1.8-yard average. His seven-yard touchdown was one of Miami’s two second-quarter rushing scores.
The contrast between Wright’s touchdown and his low average is a good example of why touchdowns should be separated from down-to-down efficiency when reading player statistics.
Alexander Mattison’s Scoring Contribution
Mattison carried three times for eight yards and scored the first Miami touchdown of the game.
He also caught one pass for 21 yards.
His total offensive contribution therefore went beyond his eight rushing yards, with 29 yards from rushing and receiving combined.
Chicago’s Rushing Production
Chicago finished with 24 rushing attempts for 90 yards.
The Bears averaged 3.8 yards per carry and did not score a rushing touchdown.
| Player | Carries | Yards | Average | TD | Long |
| Kyle Monangai | 6 | 30 | 5.0 | 0 | 13 |
| Deion Hankins | 7 | 23 | 3.3 | 0 | 12 |
| Ian Wheeler | 7 | 20 | 2.9 | 0 | 10 |
| Tyson Bagent | 1 | 9 | 9.0 | 0 | 9 |
| Travis Homer | 2 | 6 | 3.0 | 0 | 3 |
| Case Keenum | 1 | 2 | 2.0 | 0 | 2 |
Kyle Monangai led the Bears with 30 rushing yards and averaged 5.0 yards per carry.
Hankins and Wheeler each received seven carries, making them central parts of Chicago’s rushing rotation.
The overall numbers were close between the teams, with Miami gaining 101 yards and Chicago gaining 90. The bigger difference was that Miami converted its rushing production into three touchdowns while Chicago did not score on the ground. (ESPN)
Miami Receiving Statistics
Miami’s receivers combined for 15 receptions and 214 receiving yards, with no receiving touchdowns.
The Dolphins averaged 14.3 yards per reception and recorded a 35-yard longest reception.
| Receiver | Receptions | Yards | Average | TD | Long | Targets |
| Tahj Washington | 3 | 53 | 17.7 | 0 | 34 | 4 |
| Ollie Gordon II | 1 | 39 | 39.0 | 0 | 20 | 3 |
| Nick Westbrook-Ikhine | 1 | 35 | 35.0 | 0 | 35 | 3 |
| Alexander Mattison | 1 | 21 | 21.0 | 0 | 21 | 2 |
| AJ Henning | 1 | 18 | 18.0 | 0 | 18 | 3 |
| Malik Washington | 4 | 18 | 4.5 | 0 | 6 | 4 |
| Erik Ezukanma | 2 | 17 | 8.5 | 0 | 12 | 4 |
| Chris Myarick | 1 | 8 | 8.0 | 0 | 8 | 1 |
| Theo Wease Jr. | 1 | 5 | 5.0 | 0 | 5 | 3 |
Tahj Washington’s 53-Yard Contribution
Tahj Washington led Miami in receiving yards with 53.
He caught three passes on four targets and averaged 17.7 yards per reception. His longest catch covered 34 yards.
That makes him one of the clearest explosive-play contributors in Miami’s receiving group based on this game.
Gordon’s 39-Yard Reception
Gordon’s one reception went for 39 yards.
Although his rushing total was only 33 yards, the receiving play dramatically increased his total offensive yardage. This is exactly why running back evaluation should include receiving production.
Nick Westbrook-Ikhine’s Efficient Target Usage
Westbrook-Ikhine caught one pass for 35 yards on three targets.
His 35-yard reception was Miami’s longest completion in the supplied receiving data.
The small target sample means the number should be treated as a single-game snapshot, but it was still one of Miami’s most significant explosive passing plays.
Chicago Receiving Statistics
Chicago recorded 26 receptions for 224 yards and three touchdowns.
The Bears averaged 8.6 yards per reception and had a longest reception of 26 yards.
| Receiver | Receptions | Yards | Average | TD | Long | Targets |
| Jahdae Walker | 3 | 41 | 13.7 | 1 | 14 | 5 |
| Luther Burden III | 2 | 29 | 14.5 | 0 | 16 | 2 |
| Devin Duvernay | 3 | 27 | 9.0 | 0 | 17 | 3 |
| Samori Toure | 1 | 26 | 26.0 | 0 | 26 | 3 |
| Maurice Alexander | 4 | 19 | 4.8 | 1 | 7 | 3 |
| Travis Homer | 2 | 15 | 7.5 | 0 | 9 | 4 |
| Joel Wilson | 3 | 15 | 5.0 | 0 | 7 | 3 |
| Ian Wheeler | 1 | 14 | 14.0 | 0 | 14 | 2 |
| Tyler Scott | 1 | 8 | 8.0 | 0 | 8 | 2 |
| Colston Loveland | 1 | 8 | 8.0 | 0 | 8 | 1 |
| John Jackson | 1 | 7 | 7.0 | 0 | 7 | 2 |
| JP Richardson | 2 | 7 | 3.5 | 0 | 6 | 2 |
| Deion Hankins | 1 | 4 | 4.0 | 1 | 4 | 2 |
| Stephen Carlson | 1 | 4 | 4.0 | 0 | 4 | 1 |
Jahdae Walker’s Touchdown
Walker finished with three catches for 41 yards and a touchdown.
His fourth-quarter touchdown from Keenum covered 14 yards and gave Chicago a 24-21 lead with 8:38 remaining. (ESPN)
He also led Chicago in receiving yards.
Maurice Alexander’s Scoring Reception
Alexander caught four passes for 19 yards and scored a touchdown.
His touchdown came from Bagent on a four-yard play in the second quarter.
The reception total was the highest on the Chicago roster, even though his yardage was modest.
Luther Burden III
Burden caught two passes for 29 yards on two targets.
His 14.5 yards per reception stood out compared with Chicago’s overall receiving average of 8.6.
The two-target sample is small, but it shows that Burden’s opportunities were productive when they came his way.
Defensive Numbers and Pressure
Defense is another major part of the player-stat picture.
Miami recorded 74 total tackles, 43 solo tackles, three sacks, five tackles for loss, nine passes defended, and six quarterback hits.
Chicago recorded 64 total tackles, 42 solo tackles, six sacks, eight tackles for loss, seven passes defended, and eight quarterback hits.
The most obvious difference was quarterback pressure.
Chicago recorded six sacks compared with Miami’s three. That directly affected Miami’s passing efficiency because the Dolphins lost 43 yards on sacks.
Miami’s six sacks accounted for 43 lost yards, while Chicago’s three sacks accounted for 19 lost yards. (ESPN)
This is one of the clearest statistical advantages Chicago had despite the tie.
Turnovers and Ball Security
Miami recorded four team fumbles, losing two.
Chicago recorded no fumbles and recovered two fumbles.
Miami also had one interception on defense, returning it 20 yards without scoring.
Chicago threw one interception.
The turnover totals therefore favored Chicago by one, with Miami committing two turnovers and Chicago committing one. (ESPN)
For a preseason game, turnover evaluation has to be handled carefully because players are competing for roster positions and offensive combinations may not be fully settled. Still, two lost fumbles are meaningful because they represent possessions that disappeared without a scoring opportunity.
Special Teams Performance
Special teams played a direct role in the final score.
Jason Sanders made his only field-goal attempt from 56 yards and converted all three extra points. He finished with six points.
Chicago’s kicking unit also made its only field-goal attempt, with Cairo Santos connecting from 57 yards. Jonathan Kim converted two extra points.
The teams therefore produced matching six-point field-goal contributions from their primary kicking statistics.
Miami Return Game
Miami recorded three kick returns for 116 yards, averaging 38.7 yards per return, with a 41-yard long.
The Dolphins also returned two punts for 35 yards, averaging 17.5 yards per return.
Chicago had three kick returns for 65 yards and two punt returns for 18 yards.
That gave Miami the larger return-yardage totals in both categories. (ESPN)
Punting
Miami punted twice for 109 yards, averaging 54.5 yards.
Chicago punted three times for 157 yards, averaging 52.3 yards.
Jake Bailey recorded a 59-yard punt for Miami, while Ryan Stonehouse had a 50-yard punt.
Tory Taylor handled all three Chicago punts, averaging 52.3 yards with a 57-yard long.
What the Total Yardage Says
One of the most interesting parts of the miami dolphins vs chicago bears match player stats is that the team with more total yardage did not win.
Chicago produced 295 total yards compared with Miami’s 272.
The Bears had 205 passing yards and 90 rushing yards.
Miami had 171 passing yards and 101 rushing yards.
The 23-yard difference in total offense was therefore created primarily through the passing game.
Chicago also had 22 first downs compared with Miami’s 16.
Yet the final score was 24-24.
That tells us something important about how the game was constructed. Efficiency inside scoring situations mattered more than raw yardage totals. Both teams went 3-for-4 in the red zone, meaning each converted three of four red-zone opportunities into touchdowns. (ESPN)
Miami also generated three rushing touchdowns without producing a passing touchdown.
Chicago generated three passing touchdowns without a rushing touchdown.
The scoring methods were almost mirror images.
Third Down and Fourth Down Efficiency
Miami converted seven of 16 third downs.
Chicago converted six of 14.
That works out to roughly 43.8 percent for Miami and 42.9 percent for Chicago.
The difference was small.
Fourth down was less efficient for both teams. Miami converted two of five fourth downs, while Chicago converted one of four.
These numbers help explain why neither offense completely controlled the game despite producing several long possessions.
Miami had fewer first downs but slightly better third-down conversion efficiency.
Chicago had more first downs and more total plays, but also faced situations where the offense had to rely on fourth-down attempts.
Time of Possession
Chicago controlled the ball for 33:10.
Miami held possession for 26:50.
That is a 6:20 difference.
The Bears ran 66 total plays compared with Miami’s 65, so the possession advantage did not translate into a dramatically higher number of offensive snaps.
Instead, Chicago’s longer possession time came alongside a larger number of first downs and a slightly higher total-yardage output. (ESPN)
This is a useful distinction. Time of possession is most informative when considered alongside plays, first downs, and efficiency rather than treated as a standalone indicator.
A Closer Look at Explosive Plays
Explosive plays were spread across both teams.
Miami’s biggest receiving play was 35 yards from Westbrook-Ikhine, while Tahj Washington had a 34-yard catch.
Gordon added a 39-yard reception.
On the ground, Gordon produced Miami’s longest rushing play at 21 yards.
Chicago’s longest reception was 26 yards from Samori Toure.
Walker had a 14-yard touchdown, while Duvernay recorded a 17-yard reception.
Monangai produced Chicago’s longest rushing play at 13 yards.
The distribution shows that Miami had several high-yardage individual plays even though Chicago finished with more total passing yardage.
What the Player Statistics Reveal About the Quarterbacks
The quarterback data is best understood through three different lenses: efficiency, volume, and pressure.
Miami:
- Tagovailoa: 5/6, 27 yards, no turnovers
- Wilson: 5/9, 96 yards, no turnovers, four sacks
- Ewers: 5/18, 91 yards, no turnovers, two sacks
Chicago:
- Bagent: 13/19, 103 yards, one touchdown, one interception
- Keenum: 8/10, 80 yards, two touchdowns, no interceptions
- Reed: 5/10, 41 yards, no touchdowns or interceptions
The numbers show that each quarterback’s statistical environment was different.
Tagovailoa received the smallest workload.
Wilson produced strong yardage per attempt but experienced heavy pressure.
Ewers attempted the most passes among Miami quarterbacks but completed only five.
Keenum had the most efficient statistical performance among Chicago’s quarterbacks, while Bagent handled the largest workload.
Reed had a smaller sample and no touchdowns.
The safest interpretation is to treat these statistics as one preseason data point rather than a definitive evaluation of any quarterback’s overall ability.
Why the Running Back Numbers Matter
The running back statistics are particularly useful because Miami’s rushing touchdowns were central to its scoring.
Gordon scored once.
Wright scored once.
Mattison scored once.
Chicago had no rushing touchdowns.
At the same time, Chicago’s rushing efficiency was competitive. Monangai averaged 5.0 yards per carry, while Bagent averaged 9.0 yards on his lone rushing attempt.
Miami’s team rushing average was only slightly higher than Chicago’s, 3.9 compared with 3.8.
The difference was therefore not simply that Miami ran the ball much more effectively. Instead, Miami converted its rushing opportunities into touchdowns.
That is an important distinction when interpreting the game.
Why Receiving Yardage Needs Context
Miami’s receiving group produced 214 yards on 15 catches.
Chicago produced 224 yards on 26 catches.
The teams therefore had very different receiving profiles.
Miami averaged 14.3 yards per reception.
Chicago averaged 8.6.
That means Miami generated more yards per completed reception, while Chicago completed substantially more passes.
In simple terms, Miami’s receiving production was more concentrated in bigger plays, while Chicago accumulated more of its yardage through a larger number of completions.
Neither statistic alone explains offensive quality. Together, however, they provide a clearer picture of how each passing game generated its yardage.
The Importance of Sacks in the Box Score
Sacks are sometimes listed as a defensive statistic, but they also reveal something about offensive performance.
Miami allowed six sacks.
Chicago allowed three.
The Dolphins therefore lost 24 more sack yards than the Bears.
That matters because Miami’s 171 passing yards were not produced in isolation. The offense also absorbed 43 yards in sacks.
Chicago’s passing attack lost only 19 yards on sacks.
When analyzing quarterback statistics, it is therefore useful to look at both passing production and the cost of pressure.
The box score does not explain every sack’s cause. Protection breakdowns, quarterback decisions, coverage, and defensive execution can all contribute. The statistics establish the result, but film would be needed to determine the exact responsibility for individual plays.
How to Read These Numbers for Preseason Analysis
Preseason statistics are useful, but they should not be treated like a regular-season box score.
There are several reasons.
First, playing time is uneven.
Second, teams frequently rotate players across multiple units.
Third, coaches may use conservative or experimental play designs.
Fourth, individual players are often competing for roster spots or roles.
Fifth, starters and backups may face different levels of competition.
The August 10 game illustrates all five issues.
Tagovailoa played only one series for Miami, while other quarterbacks handled much larger workloads. Chicago also distributed snaps between three quarterbacks.
Therefore, comparing raw passing totals without considering playing time can create a misleading picture.
The Most Useful Statistical Takeaways
Several numbers stand out from the full box score.
1. Chicago had more total offense
The Bears gained 295 yards compared with Miami’s 272.
2. Miami had more rushing yards
The Dolphins gained 101 rushing yards against Chicago’s 90.
3. Chicago had more passing yards
Chicago produced 205 passing yards, compared with Miami’s 171.
4. Miami scored three rushing touchdowns
Gordon, Wright, and Mattison each scored on the ground.
5. Chicago scored three passing touchdowns
Bagent and Keenum combined for three passing touchdowns.
6. Chicago generated more sacks
The Bears recorded six sacks, twice Miami’s total of three.
7. Miami produced stronger return numbers
The Dolphins recorded 116 kick-return yards and 35 punt-return yards.
8. Both teams were effective in the red zone
Each team scored touchdowns on three of four red-zone trips.
9. Chicago had more first downs
The Bears recorded 22 compared with Miami’s 16.
10. The game finished level
Despite several statistical differences, the final score was 24-24. (ESPN)
What Fans Should Avoid Overinterpreting
A single preseason game can answer some questions, but it cannot answer everything.
For example, Miami’s three rushing touchdowns do not automatically establish that its rushing attack was dominant. The team averaged 3.9 yards per carry.
Likewise, Chicago’s 205 passing yards do not automatically mean its passing game was consistently efficient. The Bears also threw an interception.
Wilson’s 96 yards do not automatically make his performance superior to every other quarterback performance in the game because he also absorbed four sacks.
Ewers’ 91 yards cannot be evaluated properly without considering his 18 attempts and five completions.
The same principle applies to receivers. One 35-yard catch can have a large effect on a player’s average when the target count is low.
This is why the strongest statistical analysis combines volume, efficiency, scoring, turnovers, and playing opportunity.
Official Game Reference
For readers who want to inspect the complete box score and play-by-play details, the ESPN game box score and statistics provides the full August 10, 2025 record. The NFL’s schedule also records the preseason meeting as a 24-24 final. (NFL)
FAQs
Who led Miami in passing against Chicago?
Zach Wilson led Miami in passing yardage with 96 yards on five completions from nine attempts. He did not throw a touchdown or interception.
Who led Chicago in passing?
Tyson Bagent led Chicago in passing attempts, completions, and yards with 13 completions on 19 attempts for 103 yards. He threw one touchdown and one interception.
Who was Miami’s leading rusher?
Ollie Gordon II led Miami with 33 rushing yards on eight carries and scored one touchdown. He also caught one pass for 39 yards.
Who led the Dolphins in receiving?
Tahj Washington led Miami with 53 receiving yards on three catches. His longest reception covered 34 yards.
Who led Chicago in receiving?
Jahdae Walker led Chicago with 41 receiving yards on three catches and scored one touchdown.
What was the final score?
The Miami Dolphins and Chicago Bears finished the August 10, 2025 preseason game tied 24-24. (ESPN)
Conclusion
The miami dolphins vs chicago bears match player stats provide a detailed picture of a preseason game in which both teams found different ways to produce offense.
Miami finished with 272 total yards, including 101 rushing yards and 171 passing yards. The Dolphins scored all three of their touchdowns on the ground. Gordon, Wright, and Mattison supplied those rushing scores, while Tahj Washington and other receivers produced several explosive gains through the air.
Chicago generated 295 total yards, including 205 passing yards and 90 rushing yards. Its three touchdowns came through the passing game, with Bagent throwing one and Keenum throwing two. Walker, Maurice Alexander, and Deion Hankins were the recipients of Chicago’s touchdown passes.
The quarterback statistics also showed contrasting workloads. Tagovailoa completed five of six passes during his short appearance. Wilson generated 96 yards on nine attempts but was sacked four times. Ewers completed five of 18 attempts for 91 yards. On the Chicago side, Bagent handled 19 attempts, Keenum completed eight of 10 passes with two touchdowns, and Reed completed five of 10 attempts.
Defensively, Chicago’s six sacks were one of the clearest statistical differences. Miami recorded three sacks, while both teams created pressure and defended several passes.
Special teams also contributed to the final result. Sanders converted a 56-yard field goal, while Santos made a 57-yard field goal. Miami additionally produced stronger kick and punt return yardage.
Most importantly, the statistics show why a 24-24 preseason tie cannot be understood through the final score alone. Chicago produced more total yards and first downs, Miami produced more rushing yards and rushing touchdowns, and both teams converted three of four red-zone opportunities.
The result was an evenly scored game with enough individual performances to make the box score useful for evaluating workload, efficiency, explosive plays, pressure, turnovers, and scoring production.