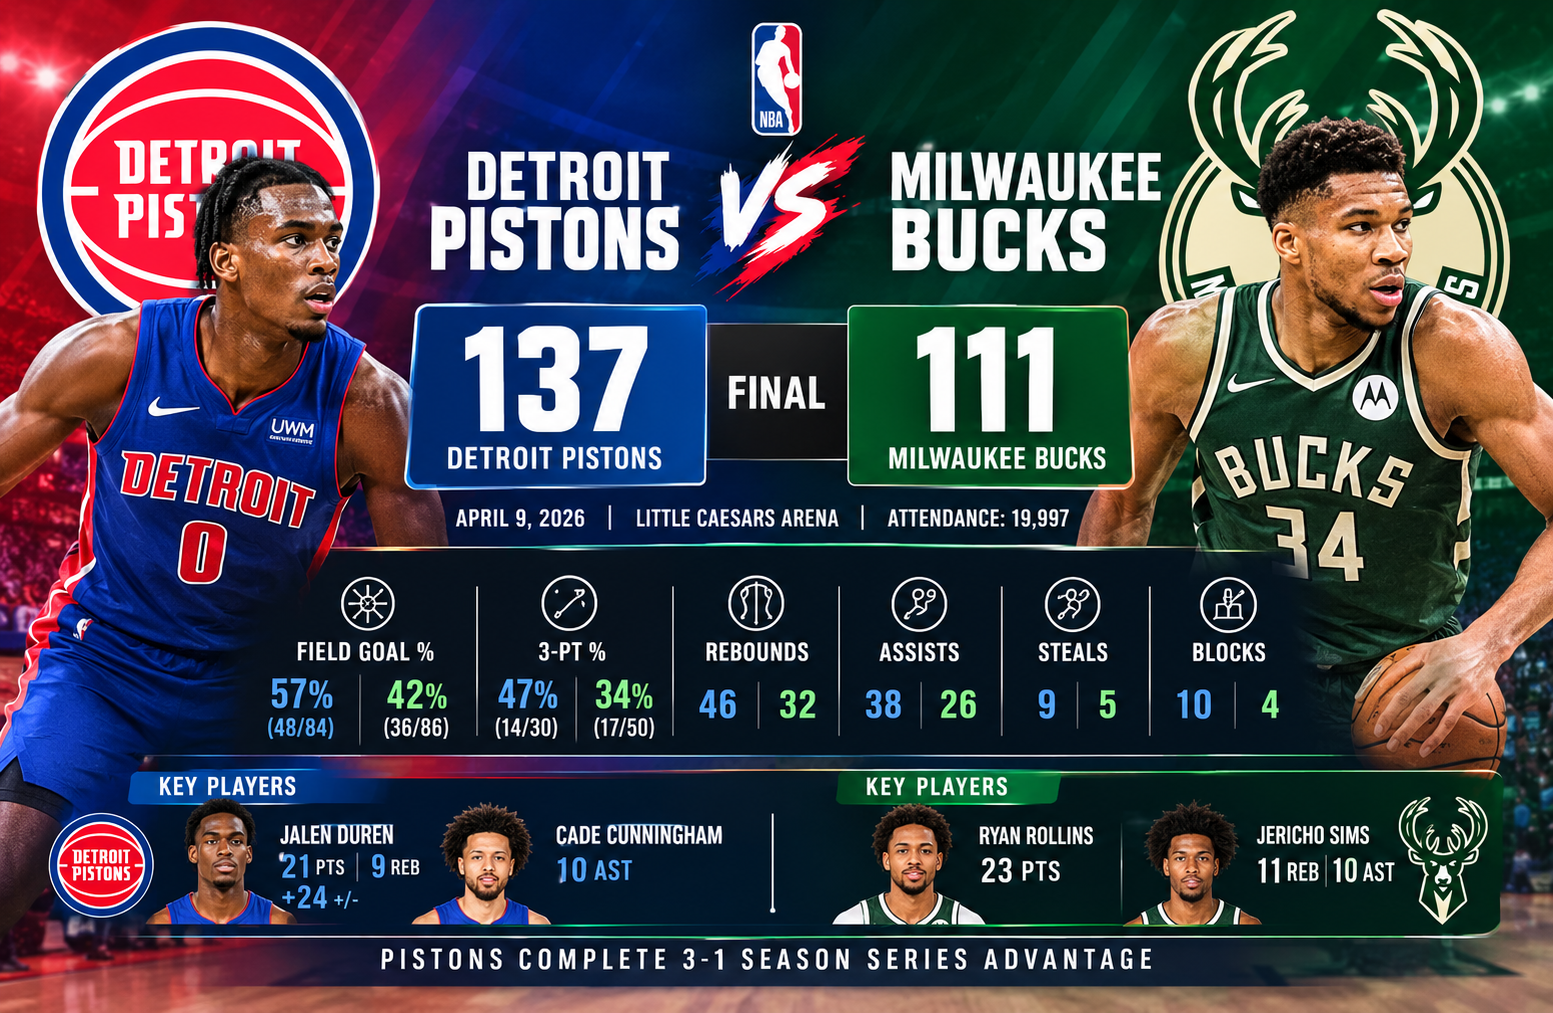
Detroit Pistons vs Milwaukee Bucks Match Player Stats
The detroit pistons vs milwaukee bucks match player stats from April 9, 2026, tell a clear story about how Detroit controlled the game from the opening quarter and turned a competitive matchup into a 137-111 home victory. Played at Little Caesars Arena in front of 19,997 fans, the game featured major differences in shooting efficiency, rebounding, ball movement, and defensive production.
Detroit entered the matchup with a 58-22 record and a remarkable 32-9 home mark, while Milwaukee came in at 31-49 overall and 13-27 on the road. The final 26-point margin reflected those contrasting records, but the box score provides much more detail about how the result developed.
For readers researching Detroit Pistons vs Milwaukee Bucks match player stats, the most useful approach is not simply identifying the highest scorer. The important details include shooting efficiency, playmaking, rebounding, turnovers, plus/minus, and how individual performances connected to the team’s overall strategy.
Detroit Pistons vs Milwaukee Bucks Match Player Stats: Game Overview
The April 9 meeting was the fourth and final regular-season matchup between the two teams.
Detroit won three of the four games in the season series, while Milwaukee claimed one victory. The results were:
| Game | Result |
| Game 1 | Detroit Pistons 129, Milwaukee Bucks 116 |
| Game 2 | Milwaukee Bucks 113, Detroit Pistons 109 |
| Game 3 | Detroit Pistons 124, Milwaukee Bucks 112 |
| Game 4 | Detroit Pistons 137, Milwaukee Bucks 111 |
The final game was also the most decisive of the four.
Detroit scored at least 34 points in each of the first three quarters:
- First quarter: Detroit 34, Milwaukee 28
- Second quarter: Detroit 41, Milwaukee 29
- Third quarter: Detroit 37, Milwaukee 29
- Fourth quarter: Detroit 25, Milwaukee 25
The most important stretch came in the second quarter. Detroit scored 41 points while holding Milwaukee to 29, creating a substantial halftime advantage and putting the Bucks under pressure for the rest of the game.
Final Score
Detroit Pistons 137, Milwaukee Bucks 111
The 137 points were supported by excellent shooting. Detroit finished 48-of-84 from the field, compared with Milwaukee’s 36-of-86.
That difference alone explains a significant portion of the final margin.
Detroit also converted 14 of 30 three-point attempts and 27 of 30 free throws. Milwaukee made 17 of 50 three-point attempts and 22 of 28 free throws.
Team Shooting Comparison
Shooting efficiency was one of the clearest differences in the game.
| Statistic | Milwaukee Bucks | Detroit Pistons |
| Field Goals | 36-86 | 48-84 |
| Field Goal Percentage | 42% | 57% |
| Three-Pointers | 17-50 | 14-30 |
| Three-Point Percentage | 34% | 47% |
| Free Throws | 22-28 | 27-30 |
| Free Throw Percentage | 79% | 90% |
Detroit attempted two fewer field goals than Milwaukee but made 12 more.
That is a substantial efficiency advantage.
The Pistons converted 57% of their overall field-goal attempts. Milwaukee finished at 42%. Detroit therefore produced much more scoring value from its two-point and three-point opportunities without needing a larger volume of shots.
Why the Field-Goal Difference Matters
A box score can sometimes make a high-scoring game look like a simple matter of shot volume. This was not the case.
Milwaukee actually attempted 86 field goals, two more than Detroit. Yet Detroit made 48 compared with Milwaukee’s 36.
That means Detroit’s offensive advantage was primarily about conversion rather than simply generating more attempts.
The Pistons also shot 47% from three-point range while Milwaukee finished at 34%. Detroit made 14 threes, only three fewer than Milwaukee, despite taking 20 fewer attempts from beyond the arc.
This is an important analytical point. Milwaukee relied heavily on three-point volume, but Detroit generated considerably better efficiency from that area.
Jalen Duren’s Impact for Detroit
Jalen Duren was one of the most important individual performers in the game.
He led Detroit with 21 points and also grabbed 9 rebounds. His recorded plus/minus was +24, showing that Detroit was substantially ahead during his minutes on the floor.
Duren’s contribution was not limited to scoring.
A 21-point performance from the team’s leading scorer becomes even more meaningful when combined with nine rebounds and a +24 plus/minus. It suggests that his presence affected multiple areas of the game.
Duren’s 21-Point Performance
Duren’s scoring helped Detroit maintain pressure around the basket while the team’s perimeter players created additional opportunities.
The Pistons finished with:
- 48 field goals
- 46 rebounds
- 38 assists
- 14 made three-pointers
- 27 made free throws
- 10 steals
- 10 blocks
Duren’s interior contribution fit into a broader team performance rather than functioning as an isolated scoring display.
His nine rebounds also helped Detroit establish a 46-32 advantage on the glass.
That 14-rebound difference matters because every additional defensive rebound can prevent a second scoring opportunity, while offensive rebounds can extend possessions.
Cade Cunningham’s Playmaking
Cade Cunningham led Detroit with 10 assists.
Ten assists are especially significant in a game where Detroit scored 137 points and made 48 field goals.
Detroit finished with 38 team assists, compared with Milwaukee’s 26. That 12-assist difference provides another explanation for the Pistons’ offensive efficiency.
Rather than relying exclusively on individual shot creation, Detroit consistently converted possessions into shared offensive opportunities.
Detroit’s Ball Movement
The relationship between assists and field goals is particularly interesting.
Detroit made 48 field goals and recorded 38 assists. Milwaukee made 36 field goals and recorded 26 assists.
This means a large share of Detroit’s successful field goals came through assisted offensive actions.
That does not prove that every possession was perfectly executed, but it does show that the Pistons moved the ball effectively enough to create a large number of assisted baskets.
Cunningham’s 10 assists were therefore part of a broader playmaking structure.
Ryan Rollins Leads Milwaukee in Scoring
For Milwaukee, Ryan Rollins was the top scorer with 23 points.
His scoring output made him the Bucks’ leading individual offensive contributor in the matchup.
However, Milwaukee’s overall offensive production remained below Detroit’s level. The Bucks scored 111 points, which would normally represent a substantial offensive total, but Detroit reached 137.
The difference was therefore not that Milwaukee failed to score altogether. Instead, Detroit scored at a much higher rate and maintained that advantage for three quarters.
Rollins’ 23 points were an important individual contribution, but they were not enough to close the overall efficiency gap.
Jericho Sims Provides a Complete Statistical Contribution
Jericho Sims produced one of Milwaukee’s most notable all-around statistical performances.
He recorded:
- 11 rebounds
- 10 assists
That combination stands out because double-digit assists from a player also leading the team in rebounding is a rare type of box-score contribution.
Sims’ 10 assists matched Cunningham’s team-leading total for Detroit.
His 11 rebounds also gave him the highest rebounding total among the players highlighted in the game data.
Yet Milwaukee still lost the overall rebounding battle 46-32.
This illustrates an important lesson when analyzing individual statistics: one player’s strong performance does not necessarily translate into a team advantage if the opposing team produces greater depth across the same category.
Rebounding Was a Major Factor
Detroit won the rebounding battle decisively.
| Rebounding Category | Milwaukee | Detroit |
| Total Rebounds | 32 | 46 |
| Difference | Detroit +14 |
A 14-rebound advantage can influence both ends of the floor.
Defensively, rebounds end possessions.
Offensively, additional rebounds can create second chances.
Detroit’s 46 total rebounds therefore supported both its defensive resistance and offensive continuity.
The Pistons did not need to rely solely on exceptional shooting. Their control of the glass gave them another structural advantage.
Assists Show Detroit’s Offensive Organization
Detroit recorded 38 assists compared with Milwaukee’s 26.
That 12-assist gap is one of the clearest indicators of the difference in offensive organization.
Detroit’s 38 assists were paired with 12 turnovers. Milwaukee recorded 26 assists and 13 turnovers.
This creates an interesting contrast.
| Category | Milwaukee | Detroit |
| Assists | 26 | 38 |
| Turnovers | 13 | 12 |
| Assist-to-Turnover Ratio | 2.00 | 3.17 |
Using the recorded totals, Detroit’s assist-to-turnover ratio was approximately 3.17, compared with Milwaukee’s 2.00.
That does not capture every aspect of offensive quality, but it provides useful context.
Detroit generated significantly more assists without committing more turnovers.
Detroit’s Defensive Production
The Pistons also produced strong defensive numbers.
They recorded:
- 9 steals
- 10 blocks
- 46 rebounds
Milwaukee recorded:
- 5 steals
- 4 blocks
- 32 rebounds
Detroit therefore had the advantage in all three categories.
The block difference was especially large.
Detroit’s 10 blocks were more than double Milwaukee’s four. Combined with the rebounding advantage, that suggests the Pistons were able to disrupt Milwaukee’s attempts to finish possessions.
Steals also favored Detroit by four.
When a team wins rebounds, steals, and blocks while also shooting 57% from the field, it becomes difficult for the opponent to maintain a competitive margin.
Free-Throw Efficiency
Free throws were another area where Detroit performed efficiently.
| Team | Free Throws Made | Attempts | Percentage |
| Milwaukee | 22 | 28 | 79% |
| Detroit | 27 | 30 | 90% |
Detroit made 27 of its 30 free throws.
That 90% conversion rate meant the Pistons capitalized on most of their opportunities at the line.
Milwaukee’s 79% was respectable, but Detroit had both more makes and a higher percentage.
The five-point difference in made free throws was not the primary reason for the result, but it added to Detroit’s overall efficiency advantage.
Three-Point Shooting Tells an Interesting Story
At first glance, Milwaukee’s 17 made three-pointers might appear to be an advantage.
Detroit made 14.
However, the number of attempts changes the interpretation.
Milwaukee attempted 50 threes and made 17, producing a 34% success rate.
Detroit attempted 30 and made 14, producing a 47% success rate.
This means Milwaukee made three more threes while taking 20 additional attempts.
Detroit’s approach was much more efficient.
Three-Point Comparison
Milwaukee
- 17 made
- 50 attempts
- 34%
Detroit
- 14 made
- 30 attempts
- 47%
The 13-percentage-point difference in three-point accuracy is significant.
For analysts studying detroit pistons vs milwaukee bucks match player stats, this is one of the most useful details because raw made-three totals alone could create a misleading impression.
Quarter-by-Quarter Breakdown
The game remained relatively balanced only in the opening minutes before Detroit began creating separation.
First Quarter: Detroit 34, Milwaukee 28
Detroit opened with a six-point advantage.
Milwaukee’s 28 points kept the opening period competitive, but Detroit’s 34-point offensive output established the pattern for the rest of the night.
Second Quarter: Detroit 41, Milwaukee 29
The second quarter was arguably the biggest turning point.
Detroit scored 41 points, its highest single-quarter total of the game.
Milwaukee managed 29.
That created a 12-point differential in the period and expanded Detroit’s overall lead substantially.
Third Quarter: Detroit 37, Milwaukee 29
Detroit continued to control the game after halftime.
The Pistons scored 37 points while allowing 29, adding another eight points to their advantage.
At that stage, the game had moved beyond a one-possession or short-run contest.
Fourth Quarter: Detroit 25, Milwaukee 25
The fourth quarter was the only period in which the teams scored exactly the same number of points.
Detroit and Milwaukee each scored 25.
That balance meant Detroit did not need another scoring surge. The work had already been done during the first three quarters.
Season Series Results
Detroit finished the four-game season series with a 3-1 advantage.
| Date | Winner | Score |
| Nov. 23 | Detroit | 129-116 |
| Dec. 4 | Milwaukee | 113-109 |
| Dec. 7 | Detroit | 124-112 |
| Apr. 9 | Detroit | 137-111 |
The results show that Detroit’s three victories came by increasingly convincing margins in the listed matchups, while Milwaukee’s lone victory was a four-point game.
The season series therefore provides useful context for the April 9 result without relying on the final game alone.
Home and Away Context
The game was played in Detroit, where the Pistons entered with a 32-9 home record.
Milwaukee entered with a 13-27 road record.
Those records provide important context, although they should not be treated as the sole explanation for the result.
The actual game statistics show that Detroit backed up its strong home record with superior shooting, rebounding, assists, steals, blocks, and free-throw efficiency.
The venue was Little Caesars Arena in Detroit, Michigan, with an announced attendance of 19,997.
What the Box Score Says About Detroit’s Offense
Detroit’s offense can be summarized through five connected numbers:
57% field-goal shooting
47% three-point shooting
38 assists
46 rebounds
137 points
The combination is more informative than any individual number.
Detroit was not simply making difficult shots. The Pistons also created more efficient opportunities, moved the ball effectively, controlled the glass, and converted free throws at a high rate.
The 38 assists are particularly useful when evaluating how the scoring was generated.
What the Box Score Says About Milwaukee
Milwaukee’s numbers reveal a team that generated plenty of offensive volume but struggled to match Detroit’s efficiency.
The Bucks attempted:
- 86 field goals
- 50 three-pointers
- 28 free throws
They scored 111 points.
The biggest issue visible from the supplied statistics is conversion efficiency.
Milwaukee’s 42% field-goal percentage was 15 percentage points below Detroit’s 57%.
Its 34% three-point percentage was also 13 percentage points below Detroit’s 47%.
Milwaukee did make 17 threes, but the volume required to reach that total was considerably higher.
The Most Important Statistical Gaps
When evaluating the complete box score, several differences stand out.
1. Field-Goal Percentage
Detroit: 57%
Milwaukee: 42%
Difference: 15 percentage points
2. Three-Point Percentage
Detroit: 47%
Milwaukee: 34%
Difference: 13 percentage points
3. Rebounds
Detroit: 46
Milwaukee: 32
Difference: 14 rebounds
4. Assists
Detroit: 38
Milwaukee: 26
Difference: 12 assists
5. Blocks
Detroit: 10
Milwaukee: 4
Difference: 6 blocks
6. Steals
Detroit: 9
Milwaukee: 5
Difference: 4 steals
These categories explain why the final score was so wide.
Detroit was not dominant in only one area. The Pistons had advantages across multiple parts of the box score.
Player Stats Need Team Context
One of the easiest mistakes in sports-stat analysis is focusing only on the highest scorer.
Ryan Rollins scored 23 for Milwaukee, while Jalen Duren scored 21 for Detroit.
If scoring were the only consideration, Milwaukee would appear to have the higher individual scoring performance.
But the game was not decided by scoring totals alone.
Duren also had nine rebounds and a +24 plus/minus.
Cunningham contributed 10 assists.
Sims recorded 11 rebounds and 10 assists for Milwaukee.
The broader statistical picture shows how different player roles influenced the game.
A center’s rebounding can be as important to a team’s performance as a guard’s scoring. A primary ball handler’s assists can explain why several teammates produce efficient shooting numbers.
Advanced Reading of the Box Score
Even without possession-by-possession tracking, the supplied statistics allow several useful calculations.
Detroit’s Effective Shooting Profile
Detroit’s 57% field-goal percentage already indicates strong shooting.
Its 47% three-point percentage makes the performance even more efficient because three-point baskets carry greater scoring value.
Detroit also made 27 of 30 free throws.
That means the Pistons were efficient from all three major scoring areas.
Milwaukee’s Volume Versus Efficiency
Milwaukee’s 50 three-point attempts were a major part of its offensive approach.
The Bucks made 17.
That is enough to produce a significant number of points, but the 34% conversion rate was much lower than Detroit’s 47%.
The resulting offensive profile was high-volume but less efficient.
Turnovers Were Not the Main Difference
An interesting detail is that turnovers were relatively close.
Milwaukee had 13.
Detroit had 12.
Therefore, the 26-point final margin cannot be explained primarily by turnover avoidance.
Detroit’s advantage came from several other categories.
This distinction matters because turnovers often receive disproportionate attention when analyzing large-margin games.
Here, the numbers point more strongly toward shooting, rebounding, playmaking, and defensive disruption.
Why the 137-111 Score Matters
A 26-point victory is large enough that the final score should be interpreted alongside the quarter-by-quarter progression.
Detroit outscored Milwaukee by:
- 6 points in Q1
- 12 points in Q2
- 8 points in Q3
- 0 points in Q4
The cumulative pattern is important.
Detroit built the lead before halftime, expanded it again in the third quarter, and then played an even fourth quarter.
That is different from a game where a team wins because of one extraordinary final-period comeback.
The statistical profile indicates sustained control.
How to Use These Player Statistics
Readers often search for match statistics for different reasons.
Fantasy Basketball Research
Individual totals such as points, rebounds, assists, and plus/minus can help provide context when reviewing player performances.
However, fantasy evaluation usually requires additional information such as minutes, usage, shooting attempts, steals, blocks, and league-specific scoring rules.
The available game data should therefore be treated as a snapshot rather than a complete fantasy evaluation.
Basketball Analysis
For basketball analysis, the team totals are especially useful.
The biggest areas to examine are:
- Shooting efficiency
- Three-point efficiency
- Rebounding
- Assists
- Turnovers
- Defensive events
- Quarter-by-quarter scoring
Looking at all seven provides a more complete understanding than focusing on points alone.
Historical Matchup Research
The four-game season series is useful for readers studying how the teams performed against each other during the season.
Detroit won three meetings, while Milwaukee won one.
The four scores also show that the matchups produced different levels of competitiveness.
A Practical Method for Reading NBA Box Scores
If you frequently research NBA player statistics, use this sequence:
Step 1: Check the Final Score
Start with the result, but do not stop there.
Step 2: Compare Shooting Percentages
Field-goal and three-point percentages often explain large scoring differences.
Step 3: Check Rebounding
A major rebounding advantage can reveal control of possessions.
Step 4: Compare Assists and Turnovers
This provides a useful picture of offensive organization and ball security.
Step 5: Review Individual Leaders
Identify the leading scorers, rebounders, and assist providers.
Step 6: Check Plus/Minus Carefully
Plus/minus provides game-specific context, but it should not be interpreted as a complete measure of individual player quality.
Step 7: Compare Quarters
Quarter-by-quarter scoring shows when the game actually changed.
This method prevents the common mistake of judging a game based on one headline statistic.
Where to Verify Official NBA Information
For readers who want to cross-check schedules, standings, game information, and league statistics, the official NBA website is an appropriate primary reference.
For this article, the supplied game data is the basis for the player and team statistics presented above.
Frequently Asked Questions
Who was Detroit’s leading scorer against Milwaukee?
Jalen Duren led Detroit with 21 points.
Who led Milwaukee in scoring?
Ryan Rollins was Milwaukee’s leading scorer with 23 points.
How many assists did Cade Cunningham have?
Cade Cunningham recorded 10 assists.
Who had the most rebounds in the game?
Jericho Sims recorded 11 rebounds for Milwaukee, while Jalen Duren led Detroit with 9 rebounds.
What was the final score?
Detroit defeated Milwaukee 137-111 on April 9, 2026, at Little Caesars Arena.
Who won the season series?
Detroit won three of the four regular-season meetings against Milwaukee.
Conclusion
The detroit pistons vs milwaukee bucks match player stats from April 9, 2026, reveal a game decided by broad statistical control rather than one isolated performance.
Detroit finished with 57% field-goal shooting, 47% three-point shooting, 46 rebounds, 38 assists, nine steals, and 10 blocks. Milwaukee finished with 42% field-goal shooting, 34% three-point shooting, 32 rebounds, 26 assists, five steals, and four blocks.
Jalen Duren led Detroit with 21 points and nine rebounds, while Cade Cunningham supplied 10 assists. Ryan Rollins paced Milwaukee with 23 points, and Jericho Sims contributed 11 rebounds and 10 assists.
The Pistons’ 137-111 victory completed a 3-1 season-series advantage and demonstrated why a complete box-score analysis is more informative than looking at scoring totals alone.
The strongest statistical themes were Detroit’s shooting efficiency, ball movement, rebounding advantage, and defensive activity. Milwaukee produced 17 made three-pointers and several notable individual contributions, but Detroit’s broader team efficiency created the decisive separation.