Jacksonville Jaguars vs Colts Match Player Stats
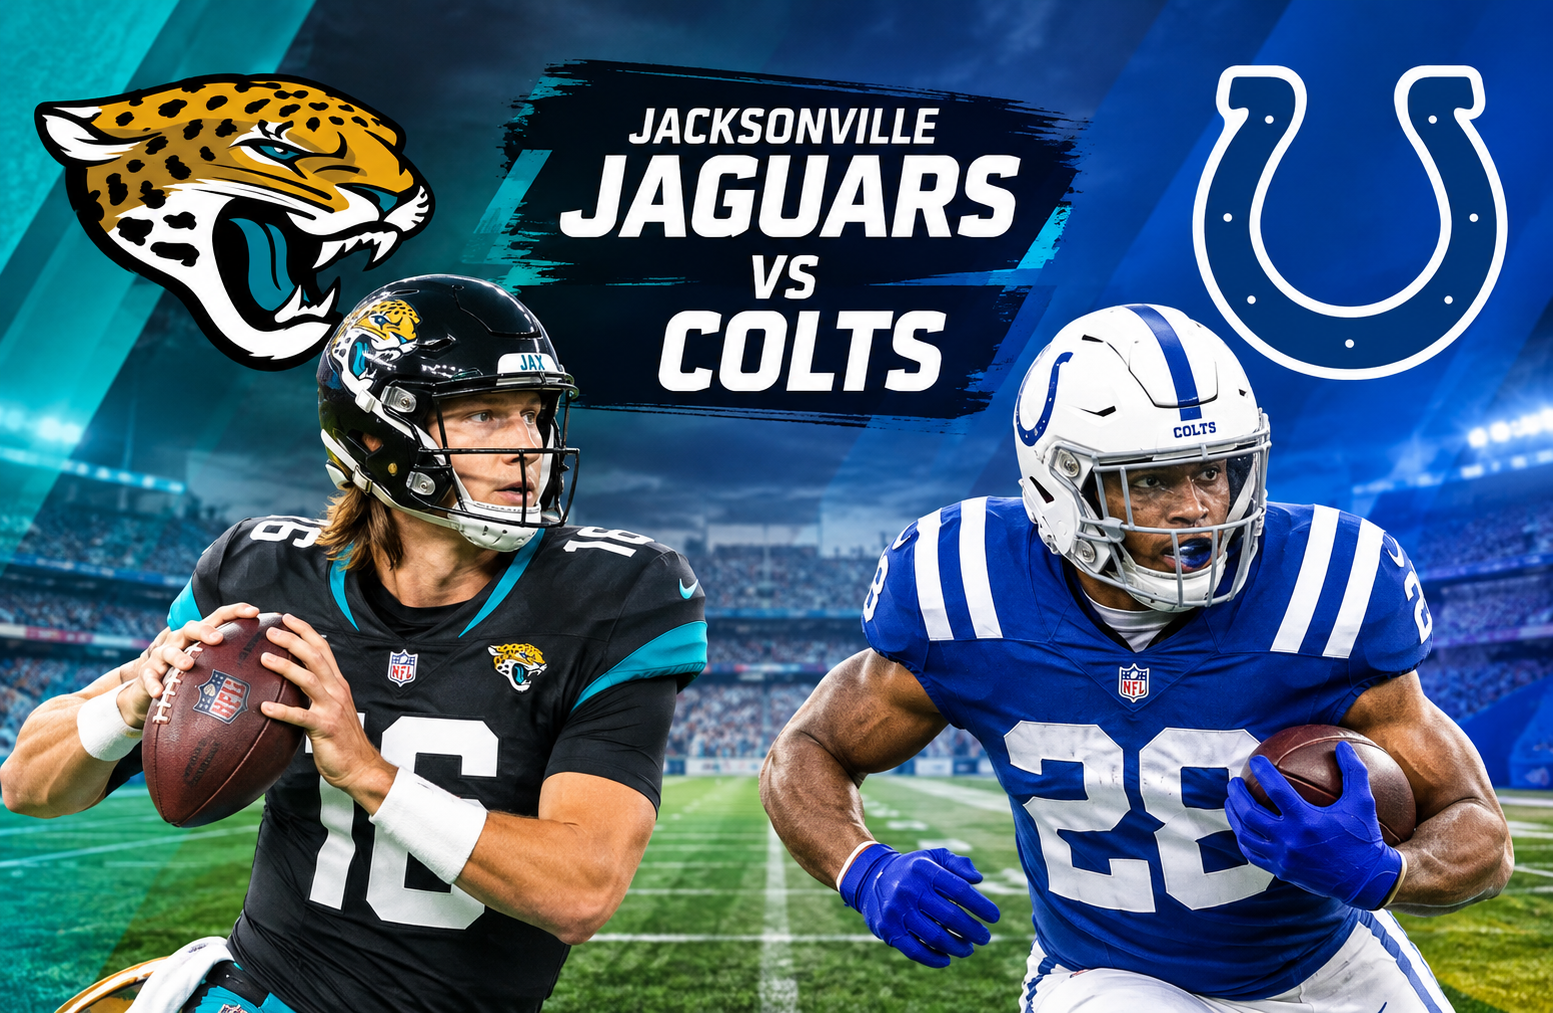
The Jacksonville Jaguars vs Colts match player stats from January 5, 2025, tell the story of a closely contested AFC South game that Indianapolis eventually won 26-23 in overtime. The Colts finished with 429 total yards compared with Jacksonville’s 319, while Jonathan Taylor’s 177 rushing yards became one of the defining statistical performances of the afternoon.
For readers looking beyond the final score, this game offers several useful points of analysis. Mac Jones produced 225 passing yards and a touchdown for Jacksonville, while Joe Flacco threw for 264 yards without an interception. Taylor dominated the ground game, Brian Thomas Jr. topped Jacksonville’s receiving chart, and Josh Downs led Indianapolis with 10 receptions.
This article breaks down the most important Jacksonville Jaguars vs Colts match player stats, including passing, rushing, receiving, defense, kicking, punting, team efficiency, and the overtime sequence that decided the result.
Jacksonville Jaguars vs Colts Match Player Stats at a Glance
The game was played on January 5, 2025, at Indianapolis and carried Game ID 401671837. Indianapolis entered the game at 8-8 while Jacksonville was 4-12, with both teams playing their final game of the regular season.
The final result was:
| Team | Final Score | Total Yards | Rushing | Passing |
| Jacksonville Jaguars | 23 | 319 | 113 | 206 |
| Indianapolis Colts | 26 | 429 | 177 | 252 |
Indianapolis won in overtime after Matt Gay converted a 38-yard field goal on the Colts’ opening overtime possession.
The biggest statistical difference was on the ground. Both teams ran the ball 34 times, but Indianapolis gained 177 yards compared with Jacksonville’s 113.
That produced a substantial efficiency gap:
- Jaguars rushing average: 3.3 yards per carry
- Colts rushing average: 5.2 yards per carry
- Jaguars total offense: 319 yards
- Colts total offense: 429 yards
- Jaguars turnovers: 1
- Colts turnovers: 0
- Jaguars time of possession: 30:51
- Colts time of possession: 35:58
The Colts also generated 24 first downs compared with 19 for Jacksonville.
Quarter-by-Quarter Score Breakdown
The final margin was only three points, but the scoring pattern shows how Indianapolis built an early advantage before Jacksonville forced the game into overtime.
| Quarter | Jaguars | Colts |
| 1st | 7 | 7 |
| 2nd | 6 | 13 |
| 3rd | 0 | 0 |
| 4th | 10 | 3 |
| Overtime | 0 | 3 |
| Final | 23 | 26 |
Indianapolis scored 20 points in the first half, while Jacksonville had 13.
The third quarter produced no points from either team. Jacksonville then rallied in the fourth quarter, scoring 10 points and eventually tying the game at 23-23 with a 53-yard field goal from Cam Little with 1:44 remaining.
In overtime, Indianapolis drove 50 yards over 11 plays before Gay converted the winning 38-yard field goal.
Mac Jones Passing Performance
Mac Jones started at quarterback for Jacksonville and completed 20 of 32 attempts for 225 passing yards.
His official passing line was:
- Completions: 20
- Attempts: 32
- Completion rate: 62.5%
- Passing yards: 225
- Average: 7.0 yards per attempt
- Touchdowns: 1
- Interceptions: 1
- Sacks: 2 for 19 yards
- QBR: 40.4
- Passer rating: 80.9
The raw completion percentage was respectable, but the interception and limited overall offensive production mattered in a game decided by one possession.
Jones did connect effectively with Brian Thomas Jr., who became Jacksonville’s leading receiver. The Jaguars also found Brenton Strange several times underneath and in intermediate areas.
However, Jacksonville finished with only 206 net passing yards according to the team statistics, compared with 252 for Indianapolis.
Joe Flacco Passing Performance
Joe Flacco delivered the more productive passing performance in terms of volume.
He completed 23 of 40 attempts for 264 yards, one touchdown, and no interceptions.
His statistical line:
- Completions: 23
- Attempts: 40
- Completion rate: 57.5%
- Passing yards: 264
- Average: 6.6 yards per attempt
- Touchdowns: 1
- Interceptions: 0
- Sacks: 3 for 12 yards
- QBR: 41.5
- Passer rating: 85.8
Flacco’s biggest early contribution came immediately. He connected with Alec Pierce for a 40-yard touchdown on Indianapolis’ third play of the game.
That explosive completion established a pattern that Jacksonville had to account for throughout the contest. Pierce finished with only two catches, but one of those receptions went for 40 yards and a touchdown.
The zero-interception performance was also important. Jacksonville recorded one interception through the game, while Indianapolis did not throw one.
Jonathan Taylor Dominated the Ground Game
Among all Jacksonville Jaguars vs Colts match player stats, Jonathan Taylor’s rushing production stands out most clearly.
Taylor carried the ball 34 times for 177 yards and one touchdown.
His line:
- Carries: 34
- Rushing yards: 177
- Average: 5.2 yards per carry
- Touchdowns: 1
- Longest run: 17 yards
Taylor accounted for all of Indianapolis’ rushing attempts listed in the official box score.
The importance of that workload becomes clearer when compared with Jacksonville’s entire rushing attack.
The Jaguars also had 34 rushing attempts, but those attempts produced only 113 yards. Taylor therefore gained 64 more yards than Jacksonville’s entire rushing unit despite receiving the same number of carries.
That is a major efficiency difference.
Taylor was particularly important in overtime. He carried the ball six consecutive times for 33 yards during the deciding possession, helping Indianapolis move into field-goal range.
Jacksonville Rushing Leaders
Jacksonville used several players on the ground.
Tank Bigsby
Tank Bigsby:
- 14 carries
- 39 yards
- 2.8 yards per carry
- 1 touchdown
- 11-yard long
Bigsby supplied Jacksonville’s first touchdown of the game on a one-yard rushing play.
Travis Etienne Jr.
Etienne recorded:
- 13 carries
- 31 yards
- 2.4 yards per carry
- 0 touchdowns
- 11-yard long
His rushing efficiency was limited, although he contributed as a receiver as well.
D’Ernest Johnson
Johnson had fewer opportunities but produced Jacksonville’s best rushing average:
- 2 carries
- 26 yards
- 13.0 yards per carry
- 22-yard long
His 22-yard run was the longest Jacksonville rushing play in the game.
The contrast between Johnson’s efficiency and the overall rushing output is worth noting. Jacksonville found an occasional explosive run but could not consistently create the same level of rushing production Indianapolis generated.
Brian Thomas Jr. Leads Jacksonville Receivers
Brian Thomas Jr. was Jacksonville’s leading receiver.
His numbers:
- 7 receptions
- 103 yards
- 14.7 yards per reception
- 0 touchdowns
- 41-yard long
- 11 targets
Thomas was the only Jacksonville receiver to exceed 100 yards.
His 41-yard reception was also the longest Jaguars reception in the game.
The 11 targets show that Jones consistently looked toward Thomas, and the receiver responded with a productive afternoon despite not finding the end zone.
Brenton Strange Provides a Useful Secondary Option
Brenton Strange finished with:
- 4 receptions
- 60 yards
- 15.0 yards per reception
- 0 touchdowns
- 26-yard long
- 4 targets
His 15.0-yard average was actually higher than Jacksonville’s overall receiving average of 11.3 yards per reception.
That gave Jacksonville another productive receiving option beyond Thomas.
Other Jacksonville Receiving Numbers
Travis Etienne Jr. added:
- 3 receptions
- 29 yards
- 9.7-yard average
- 14-yard long
- 5 targets
Parker Washington finished with:
- 2 receptions
- 15 yards
- 1 touchdown
- 9-yard long
- 4 targets
Washington’s touchdown became particularly important because it helped Jacksonville erase Indianapolis’ lead during the fourth-quarter comeback.
Jacksonville finished with 20 receptions for 225 yards on 31 targets.
Josh Downs Leads Indianapolis Receivers
Josh Downs was Indianapolis’ leading receiver by receptions.
His final line:
- 10 receptions
- 94 yards
- 9.4 yards per reception
- 0 touchdowns
- 18-yard long
- 13 targets
Downs was targeted 13 times, the highest target total for either team.
His production provided Flacco with a reliable short and intermediate option throughout the contest.
Michael Pittman Jr. Adds 72 Receiving Yards
Michael Pittman Jr. recorded:
- 6 receptions
- 72 yards
- 12.0 yards per reception
- 0 touchdowns
- 26-yard long
- 10 targets
Pittman’s 72 yards ranked second among Colts receivers.
Together, Downs and Pittman accounted for 16 of Indianapolis’ 23 receptions and 166 receiving yards.
Alec Pierce Creates the Biggest Passing Play
Alec Pierce finished with only two receptions, but his impact was much larger than the reception total suggests.
His final line:
- 2 receptions
- 57 yards
- 28.5 yards per reception
- 1 touchdown
- 40-yard long
- 2 targets
His 40-yard touchdown came early in the first quarter and immediately gave Indianapolis a lead.
This is an important reminder when interpreting player statistics: reception totals alone do not always show a receiver’s game impact.
Pierce had only two catches, but one produced a touchdown and the other was also a substantial gain.
Defensive Player Statistics
Defense played a significant role in the close finish.
Jacksonville recorded:
- 82 total tackles
- 46 solo tackles
- 3 sacks
- 3 tackles for loss
- 6 passes defended
- 5 quarterback hits
Indianapolis recorded:
- 74 total tackles
- 42 solo tackles
- 2 sacks
- 4 tackles for loss
- 4 passes defended
- 5 quarterback hits
The Jaguars generated more total tackles and one additional sack, but Indianapolis produced the game’s only interception.
Jacksonville Defensive Leaders
Andrew Wingard and Foyesade Oluokun each recorded 10 total tackles.
Wingard:
- 10 total tackles
- 5 solo
Oluokun:
- 10 total tackles
- 3 solo
Darnell Savage added:
- 9 total tackles
- 7 solo
These numbers indicate how heavily involved Jacksonville’s defense was, especially against an Indianapolis offense that controlled possession for almost 36 minutes.
Indianapolis Defensive Leaders
Jaylon Jones led the Colts with:
- 9 total tackles
- 5 solo
E.J. Speed recorded:
- 8 total tackles
- 6 solo
Kenny Moore II also recorded:
- 8 total tackles
- 5 solo
Julian Blackmon made the game’s only interception, returning it 10 yards without scoring.
That turnover was significant because the Colts finished the game without giving the Jaguars an interception opportunity in return.
Third-Down Efficiency and Offensive Control
The Jacksonville Jaguars vs Colts match player stats become more meaningful when the individual performances are placed alongside team efficiency.
Jacksonville converted 5 of 14 third downs.
Indianapolis converted 5 of 15.
The third-down conversion rates were therefore fairly close. The larger distinction came from the total number of offensive plays and yards.
Jacksonville:
- 68 plays
- 319 yards
- 4.7 yards per play
Indianapolis:
- 77 plays
- 429 yards
- 5.6 yards per play
Indianapolis ran nine more plays and gained 110 more yards.
That is a meaningful difference in a game that ultimately required overtime.
Rushing Efficiency Was the Defining Statistical Gap
The clearest numerical advantage belonged to Indianapolis’ rushing attack.
Both teams:
- 34 rushing attempts
But the results were very different:
| Category | Jaguars | Colts |
| Rush Attempts | 34 | 34 |
| Rush Yards | 113 | 177 |
| Yards per Carry | 3.3 | 5.2 |
| Rushing TDs | 1 | 1 |
| Long | 22 | 17 |
The Colts gained 64 more rushing yards with exactly the same number of attempts.
That difference helped Indianapolis sustain drives and maintain possession. It also became decisive in overtime when Taylor repeatedly moved the chains.
Passing Efficiency Comparison
The passing numbers were much closer.
| Passing Category | Mac Jones | Joe Flacco |
| Completions | 20 | 23 |
| Attempts | 32 | 40 |
| Completion % | 62.5% | 57.5% |
| Yards | 225 | 264 |
| Yards/Attempt | 7.0 | 6.6 |
| TD | 1 | 1 |
| INT | 1 | 0 |
| Sacks | 2 | 3 |
| QBR | 40.4 | 41.5 |
| Rating | 80.9 | 85.8 |
Jones had the higher completion percentage and yards per attempt, but Flacco produced more total passing yards and avoided an interception.
The difference was not overwhelming, but Indianapolis’ combination of passing production and rushing efficiency gave the Colts a larger overall offensive output.
Kicking Statistics
Special teams also played a major role in the final score.
Cam Little
Jacksonville’s kicker was perfect:
- Field goals: 3 of 3
- Field-goal percentage: 100%
- Long: 53 yards
- Extra points: 2 of 2
- Total points: 11
Little’s 53-yard field goal with 1:44 remaining in regulation tied the game at 23-23.
Matt Gay
Indianapolis’ Matt Gay finished:
- Field goals: 4 of 5
- Field-goal percentage: 80%
- Long: 49 yards
- Extra points: 2 of 2
- Total points: 14
Gay’s most important kick came in overtime when he converted from 38 yards to give Indianapolis the win.
Punting Comparison
The punters produced remarkably similar raw numbers.
Logan Cooke of Jacksonville:
- 4 punts
- 200 yards
- 50.0-yard average
- 62-yard long
- 2 inside the 20
- 0 touchbacks
Rigoberto Sanchez of Indianapolis:
- 4 punts
- 200 yards
- 50.0-yard average
- 61-yard long
- 3 inside the 20
- 0 touchbacks
Sanchez had the slight advantage in punts inside the 20, while Cooke produced the longer single punt.
How the Game Was Decided
The game can be understood through four major statistical themes.
1. Indianapolis controlled the rushing battle
Taylor’s 177 yards were the foundation of Indianapolis’ offensive performance.
Jacksonville had 113 rushing yards as a team.
2. The Colts generated more total offense
Indianapolis produced 429 total yards compared with 319 for Jacksonville.
That 110-yard difference was the largest team-level statistical separation in the contest.
3. Turnovers favored Indianapolis
Jacksonville threw one interception.
Indianapolis threw none.
Both teams finished without losing a fumble, but the interception gave Indianapolis the overall turnover advantage.
4. Overtime belonged to Taylor and Gay
The Colts opened overtime with an 11-play, 50-yard drive.
Taylor was central to the possession, carrying the ball repeatedly and generating 33 yards across six consecutive rushing attempts.
The Colts moved 50 yards in 4:37 before Gay converted the 38-yard field goal.
That final possession is arguably the best single example of how the game’s statistical story translated into the result.
Jacksonville’s Fourth-Quarter Comeback
Despite Indianapolis’ statistical advantages, Jacksonville did not go quietly.
The Jaguars entered the fourth quarter trailing 20-13.
At 7:50 remaining, Parker Washington caught a nine-yard touchdown from Jones to tie the game at 20-20.
Indianapolis answered with a 45-yard Matt Gay field goal with 3:52 remaining.
Jacksonville then responded again.
Little hit a 53-yard field goal with 1:44 left to make it 23-23.
The comeback demonstrated that the Jaguars were still capable of creating scoring opportunities despite their lower overall yardage total.
The Overtime Possession
Overtime provided the clearest snapshot of the teams’ contrasting offensive strengths.
Indianapolis received the ball and sustained an 11-play drive.
Taylor was central to the possession, carrying the ball repeatedly and generating 33 yards across six consecutive rushing attempts.
The Colts moved 50 yards in 4:37 before Gay converted the 38-yard field goal.
Jacksonville then received the ball.
The Jaguars struggled to sustain the possession. On third down, Zaire Franklin sacked Jones, creating a fourth-and-22 situation. Jones’ deep attempt fell incomplete, ending the game.
What the Player Stats Tell Us
A box score can tell you what happened. The deeper value comes from identifying why the numbers mattered.
In this game, the answer was balance.
Indianapolis did not rely exclusively on Flacco’s arm. The Colts paired 264 passing yards with 177 rushing yards.
Jacksonville had 225 passing yards and 113 rushing yards.
The Jaguars’ passing efficiency was competitive, but their ground game did not generate enough consistent production to match Indianapolis’ offense.
At the same time, Jacksonville’s defense created pressure and recorded three sacks, yet the Colts still produced 429 total yards.
That combination explains why a game that finished 26-23 was statistically more favorable to Indianapolis than the final margin alone suggests.
Jacksonville Jaguars vs Colts Match Player Stats: Key Takeaways
The most important numbers from the game are:
- Jonathan Taylor: 34 carries, 177 yards, 1 touchdown
- Joe Flacco: 23 of 40, 264 yards, 1 touchdown, 0 interceptions
- Mac Jones: 20 of 32, 225 yards, 1 touchdown, 1 interception
- Brian Thomas Jr.: 7 catches, 103 yards
- Josh Downs: 10 catches, 94 yards
- Alec Pierce: 2 catches, 57 yards, 1 touchdown
- Michael Pittman Jr.: 6 catches, 72 yards
- Tank Bigsby: 14 carries, 39 yards, 1 touchdown
- Andrew Wingard: 10 tackles
- Foyesade Oluokun: 10 tackles
- Jaylon Jones: 9 tackles
- Julian Blackmon: 1 interception
- Cam Little: 3 of 3 field goals
- Matt Gay: 4 of 5 field goals
- Indianapolis total offense: 429 yards
- Jacksonville total offense: 319 yards
- Final score: Colts 26, Jaguars 23 in overtime
Frequently Asked Questions
What was the final score between the Jaguars and Colts?
The Indianapolis Colts defeated the Jacksonville Jaguars 26-23 in overtime on January 5, 2025.
Who led the Jaguars in passing?
Mac Jones led Jacksonville with 20 completions on 32 attempts for 225 yards, one touchdown, and one interception.
Who had the most rushing yards in the game?
Jonathan Taylor led all players with 177 rushing yards on 34 carries and scored one touchdown.
Who was Jacksonville’s leading receiver?
Brian Thomas Jr. led the Jaguars with seven receptions for 103 yards on 11 targets.
Who led the Colts in receiving?
Josh Downs led Indianapolis with 10 receptions for 94 yards on 13 targets.
How did the Colts win in overtime?
Indianapolis opened overtime with an 11-play, 50-yard drive. Jonathan Taylor produced 33 rushing yards on six consecutive carries during the drive before Matt Gay kicked the winning 38-yard field goal.
Conclusion
The Jacksonville Jaguars vs Colts match player stats show a game that was much closer on the scoreboard than it was in overall offensive production.
Jacksonville produced 319 total yards, while Indianapolis reached 429. Both teams attempted 34 rushing plays, but the Colts gained 177 yards on those attempts compared with 113 for Jacksonville. Jonathan Taylor’s 177-yard performance was therefore central to the Colts’ offensive advantage.
The passing matchup was more competitive. Mac Jones completed 20 of 32 passes for 225 yards, while Joe Flacco completed 23 of 40 for 264 yards. Both quarterbacks threw one touchdown, but Flacco avoided an interception.
Jacksonville’s receiving group was led by Brian Thomas Jr., who surpassed 100 yards, while Josh Downs provided Indianapolis with 10 receptions. Alec Pierce’s 40-yard touchdown was the game’s biggest early passing play.
The defensive numbers were also active, with Jacksonville recording three sacks and Indianapolis recording two. Julian Blackmon supplied the only interception.
Ultimately, the game came down to execution in overtime. Taylor’s repeated runs created the field position Indianapolis needed, and Gay converted the decisive 38-yard field goal. The result gave the Colts a 26-23 overtime victory.