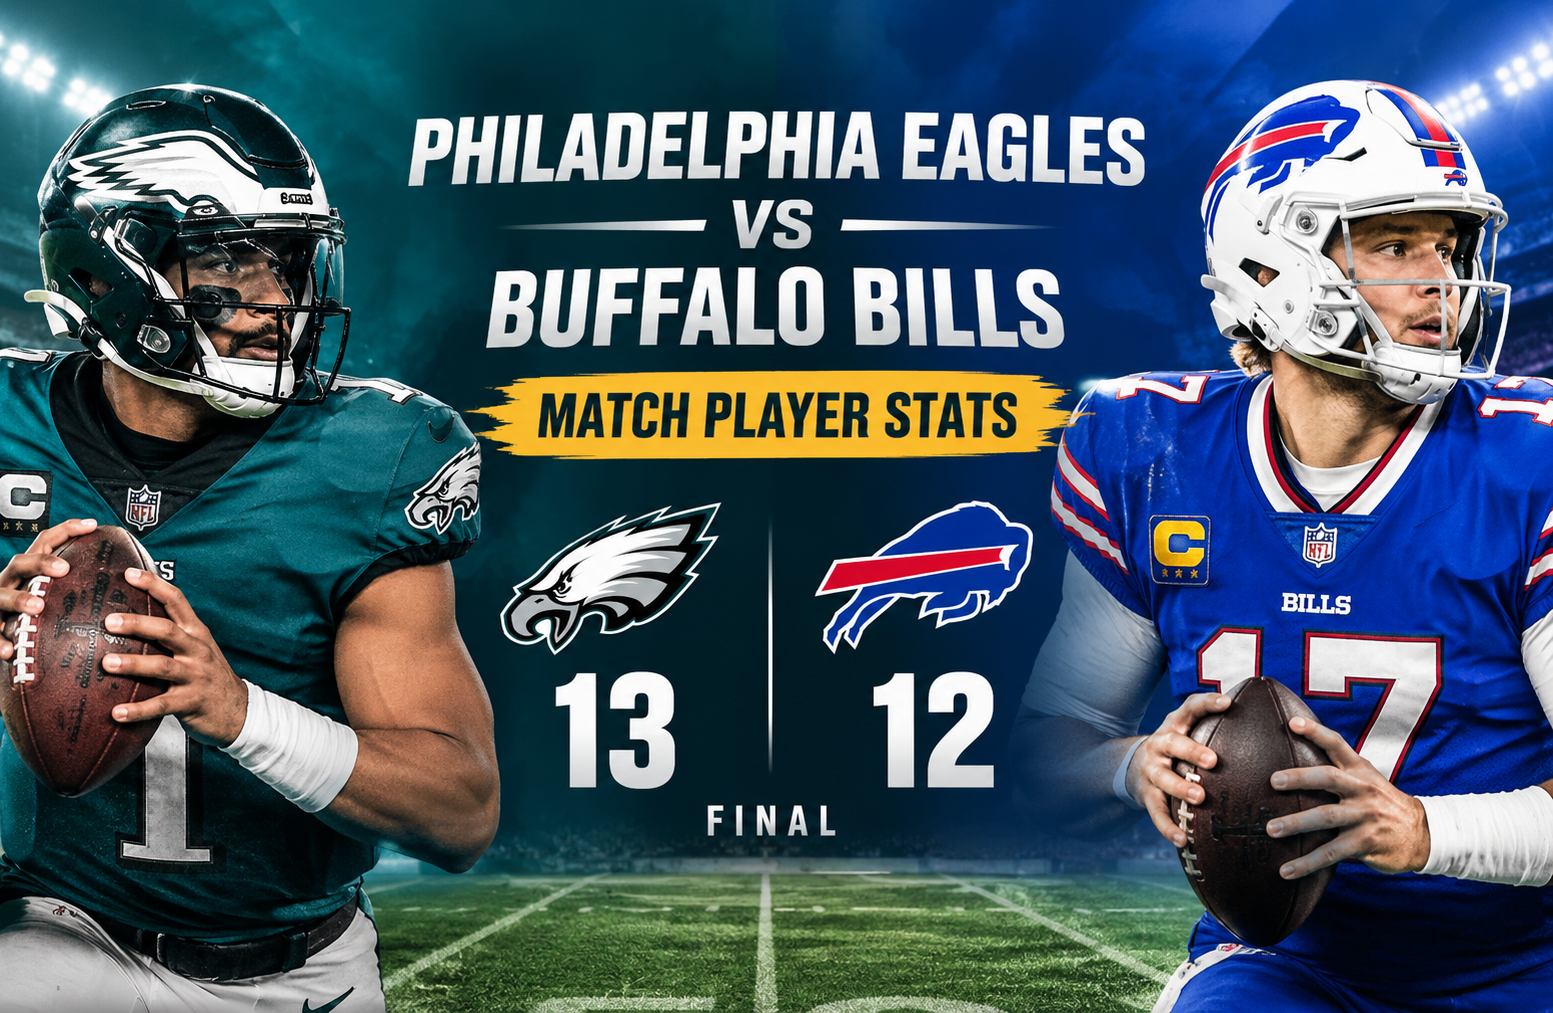
Philadelphia Eagles vs Buffalo Bills Match Player Stats
Philadelphia Eagles vs Buffalo Bills Match Player Stats from the 2025 Week 17 meeting tell a story that the 13-12 final score only partly explains. Philadelphia entered Highmark Stadium with an 11-5 record and left with another road victory, while Buffalo also stood at 11-5 but could not complete a fourth-quarter comeback. The Eagles built their entire 13-point advantage before halftime, then relied on defense, field position, and late-game execution to survive Buffalo’s two fourth-quarter touchdowns.
The final score was Philadelphia 13, Buffalo 12. The game was played on December 28, 2025, at Highmark Stadium in Orchard Park, New York. The official NFL game record confirms the score and Week 17 designation.
What makes this matchup particularly interesting is the contrast between the overall statistical production and the scoreboard. Buffalo produced 331 total yards compared with Philadelphia’s 190. Josh Allen threw for 262 yards, while Jalen Hurts finished with 110 passing yards. Buffalo also controlled time of possession and generated more first downs.
Yet Philadelphia won.
That difference is the real value of studying the player statistics. A box score is not simply a list of numbers. It shows how a team converted its opportunities, protected its advantages, handled pressure, and responded when the game became a one-score contest.
Philadelphia Eagles vs Buffalo Bills Match Player Stats at a Glance
The headline numbers immediately show how unusual this game was.
| Category | Philadelphia Eagles | Buffalo Bills |
| Final Score | 13 | 12 |
| Record | 11-5 | 11-5 |
| Passing | 110 yards | 262 yards |
| Rushing | 82 yards | 120 yards |
| Total Offense | 190 yards | 331 yards |
| First Downs | 11 | 20 |
| Turnovers | 0 | 1 lost |
| Sacks | 1 | 5 |
| Field Goals | 2/2 | 0/0 |
| Passing TDs | 1 | 0 |
| Rushing TDs | 0 | 2 |
| Time of Possession | 24:45 | 35:15 |
Buffalo won several conventional statistical categories. The Bills ran 73 offensive plays to Philadelphia’s 54, recorded 20 first downs to Philadelphia’s 11, and gained 331 total yards to the Eagles’ 190.
However, Philadelphia avoided an interception, recovered a Buffalo fumble, converted its early scoring opportunities, and allowed only 12 points despite spending more than 35 minutes on defense.
That combination is why the game should not be judged simply by total yardage.
Jalen Hurts Passing Performance
Jalen Hurts completed 13 of 27 passes for 110 yards, one touchdown, and no interceptions. He averaged 4.1 yards per pass attempt and recorded a 71.5 passer rating. His QBR was listed at 39.5.
On paper, this was not one of Hurts’ most productive passing performances. His completion percentage was 48.1 percent, and Philadelphia’s passing game averaged only 4.1 yards per attempt.
Yet Hurts delivered the most important passing play of the game.
His touchdown pass to Dallas Goedert gave Philadelphia an early 7-0 lead. That score came during the first quarter and helped establish the game’s initial direction.
The important point is that Hurts did not need to produce a high-volume passing performance because Philadelphia’s defense and kicking game created a situation where every scoring possession carried greater weight.
Hurts and Efficiency Under Pressure
Hurts was sacked once for two yards. Compared with Josh Allen’s five sacks for 51 yards, Philadelphia’s offensive line did a better job of preventing major losses through the passing game.
Hurts also avoided turnovers.
That matters enormously in a game decided by one point.
A quarterback can throw for 300 yards and still lose if those yards come with turnovers or empty possessions. Hurts produced only 110 passing yards, but he contributed to a clean offensive performance in the turnover column.
The distinction between production and efficiency is important here.
Philadelphia did not ask Hurts to win the game through volume. Instead, the Eagles needed him to avoid catastrophic mistakes while making enough plays to establish an early lead.
Josh Allen Passing Performance
Josh Allen had the stronger statistical passing game.
He completed 23 of 35 attempts for 262 yards, averaging 7.5 yards per attempt. He threw no touchdowns and no interceptions, finished with an 88.0 passer rating, and recorded a 55.3 QBR.
The raw yardage advantage was significant.
Allen produced 152 more passing yards than Hurts. Buffalo also completed 10 more passes and attempted eight more throws.
But the five sacks were a major factor.
Allen lost 51 yards on those sacks, which reduced Buffalo’s net passing production substantially. The Bills finished with 211 net passing yards despite generating 262 gross passing yards.
Philadelphia’s pass rush therefore influenced the game without recording an interception.
Allen’s Late Fourth-Quarter Push
The fourth quarter showed why Allen’s statistics deserve more context than simply saying he lost despite throwing for 262 yards.
Buffalo scored two rushing touchdowns through Allen during the final quarter.
The first was a two-yard rushing touchdown that cut the Eagles’ lead to 13-6. Buffalo then mounted another long drive and scored again on a one-yard Allen run with only seconds remaining.
The Bills had an opportunity to take the lead with a two-point conversion.
They did not convert it.
That final sequence turned an otherwise impressive Buffalo fourth-quarter comeback into a one-point loss.
Saquon Barkley’s Rushing Numbers
Saquon Barkley led Philadelphia’s rushing attack with 19 carries for 68 yards.
His 3.6 yards per carry average was not spectacular, but the workload was significant. Barkley handled the majority of Philadelphia’s rushing attempts and provided the foundation for an offense that finished with 82 rushing yards.
His longest run was 16 yards.
That long gain matters because Philadelphia’s running game was otherwise relatively contained. Buffalo limited the Eagles to an average of 3.2 yards per rushing attempt as a team.
Barkley’s value in this particular game was therefore less about explosive production and more about workload, clock management, and maintaining offensive balance.
Philadelphia’s Supporting Rushers
The Eagles received additional rushing production from several players:
- Tank Bigsby: 2 carries, 7 yards
- Jalen Hurts: 3 carries, 5 yards
- Will Shipley: 2 carries, 2 yards
- Team total: 26 carries, 82 yards
No Philadelphia runner scored a rushing touchdown.
That is an important contrast with Buffalo, where Allen accounted for both rushing touchdowns.
James Cook’s Rushing Performance
James Cook III led Buffalo with 20 carries for 74 yards.
He averaged 3.7 yards per carry and produced a 10-yard long run. Although he did not score, Cook was the central component of Buffalo’s traditional rushing attack.
Buffalo finished with 33 rushing attempts for 120 yards, averaging 3.6 yards per attempt.
That was considerably better than Philadelphia’s rushing output in terms of volume and total yardage.
However, Buffalo’s rushing advantage did not translate into enough points.
Josh Allen as a Runner
Allen added seven carries for 27 yards and two touchdowns.
Those touchdowns were critical because they accounted for all of Buffalo’s points.
His rushing line therefore deserves special attention. While Allen’s passing game moved the Bills between the 20-yard lines, his rushing ability supplied the actual touchdowns.
This is one of the clearest examples of why touchdown production can tell a different story from overall offensive yardage.
Philadelphia Receiving Leaders
A.J. Brown was Philadelphia’s leading receiver with five catches for 68 yards on seven targets.
His 27-yard reception was the longest catch by an Eagles receiver and accounted for a substantial portion of Philadelphia’s limited passing production.
DeVonta Smith added two receptions for 25 yards on five targets.
Dallas Goedert caught three passes for only eight yards, but his contribution cannot be judged by yardage alone.
Goedert caught the game’s only Philadelphia touchdown.
His one-yard touchdown reception gave the Eagles the early lead and ultimately became one of the most important plays in the game.
Why Goedert’s Eight Yards Matter
Goedert’s statistics are a useful reminder that receiving yardage does not always measure a player’s impact accurately.
Three receptions for eight yards looks modest.
But one of those receptions resulted in a touchdown.
When a game finishes 13-12, a short touchdown reception can be more valuable than several catches that add yards without producing points.
That is particularly true when the defense holds the opposing offense to one point fewer than your own team’s total.
Buffalo Receiving Leaders
Brandin Cooks led Buffalo’s receiving corps with four receptions for 101 yards.
His 50-yard reception was the longest catch of the game and helped give Buffalo an explosive element in the passing attack.
Cooks averaged 25.3 yards per reception, which was easily the best average among Buffalo’s primary receivers.
Khalil Shakir led the Bills in receptions with six, but those catches produced 35 yards.
Tyrell Shavers added two catches for 36 yards, while Ty Johnson contributed three receptions for 33 yards.
Dawson Knox finished with five receptions for 30 yards.
The distribution tells us something important about Buffalo’s passing game. Allen had several available targets and generated substantial yardage, but Buffalo did not turn those passing opportunities into passing touchdowns.
The Difference Between Yardage and Scoring
This game is an excellent example of why advanced football analysis should not stop at total yards.
Buffalo gained 331 total yards.
Philadelphia gained only 190.
Buffalo recorded 20 first downs.
Philadelphia recorded 11.
Buffalo possessed the ball for 35:15.
Philadelphia possessed it for only 24:45.
And Buffalo still lost.
Why?
Because the Eagles were more efficient with the opportunities that produced points.
Philadelphia scored a touchdown and two field goals in the first half.
Buffalo did not score at all before halftime.
That created a 13-0 advantage that ultimately proved just large enough to survive the Bills’ late comeback.
The Philadelphia Defensive Performance
Philadelphia’s defense produced one of the most important statistical performances of the afternoon.
The Eagles recorded:
- 77 total tackles
- 48 solo tackles
- 5 sacks
- 7 tackles for loss
- 3 passes defended
- 6 quarterback hits
- 0 interceptions
Five sacks against Allen were especially important.
Buffalo’s offense produced 331 total yards, but the Eagles consistently created negative plays and pressure situations.
The five sacks also contributed to the Bills’ 51 lost passing yards.
Pressure Without Interceptions
It is easy to focus on interceptions when evaluating a defense against a quarterback like Allen.
But Philadelphia did not need an interception to make an impact.
The Eagles pressured Allen enough to record five sacks and six quarterback hits.
That type of pressure can change a drive without appearing as a turnover.
A third-down sack can force a punt. A tackle for loss can eliminate a running opportunity. A quarterback hit can affect the next throw.
The Philadelphia defense repeatedly created those types of disruptions.
Buffalo’s Defensive Performance
Buffalo’s defense recorded:
- 49 total tackles
- 31 solo tackles
- 1 sack
- 4 tackles for loss
- 3 passes defended
- 4 quarterback hits
- 0 interceptions
The Bills held Philadelphia to 190 total yards and just 13 points.
From a yardage perspective, that was a strong defensive performance.
The problem was that Philadelphia’s offense converted enough of its scoring opportunities to stay ahead.
Buffalo’s defense also struggled to generate the same level of quarterback pressure as Philadelphia. The Eagles were sacked once, while the Bills recorded five sacks.
That five-to-one sack difference became one of the game’s most meaningful defensive statistics.
Turnovers and the Hidden Value of Possessions
The turnover numbers were simple but important.
Philadelphia committed no turnovers.
Buffalo had two fumbles and lost one.
That gave Philadelphia an advantage in turnover margin even though neither team recorded an interception.
One Buffalo fumble was particularly costly because Philadelphia was able to turn the takeaway into points.
This is a classic example of how a single possession can have greater value than a large amount of statistical production spread across several drives.
Buffalo had more plays and more yards.
Philadelphia protected the football better.
In a one-point game, that distinction matters.
Special Teams and the Kicking Difference
Special teams played a decisive role.
Jake Elliott converted both of his field-goal attempts for Philadelphia.
He made a 47-yard field goal and a 28-yard field goal, giving the Eagles seven total points when the extra point is included.
Philadelphia therefore received reliable scoring from its kicker.
Buffalo did not receive the same return from its kicking unit.
Michael Badgley did not attempt a field goal and went 0-for-1 on extra-point attempts.
That missed extra point became particularly significant because Buffalo finished with 12 points.
Had the extra point been converted, the final score would have been 13-13 before the failed two-point opportunity on the later touchdown.
The kicking sequence therefore had a direct effect on the final margin.
Punting and Field Position
Philadelphia punted seven times for 388 yards, averaging 55.4 yards per punt.
Braden Mann recorded a long punt of 65 yards.
Buffalo punted six times for 262 yards, averaging 43.7 yards per punt.
Mitch Wishnowsky had a 49-yard long.
Philadelphia’s punting average was substantially higher, although raw punt distance does not automatically equal better field position because return yardage and touchbacks also matter.
Still, the difference illustrates how often Philadelphia was forced to give the ball back while also maintaining enough field position to keep Buffalo from turning its yardage advantage into a larger scoring margin.
Return Game Comparison
Will Shipley handled two Philadelphia kick returns for 49 yards, averaging 24.5 yards per return.
Ray Davis was more productive for Buffalo, returning three kicks for 84 yards and averaging 28.0 yards per return.
On punt returns, Britain Covey returned one punt for eight yards for Philadelphia.
Khalil Shakir returned three punts for Buffalo for 50 yards, averaging 16.7 yards per return.
Buffalo therefore had the stronger return production overall.
Again, the game shows how one statistical advantage does not automatically determine the winner.
Third-Down and Fourth-Down Efficiency
Philadelphia converted only 3 of 13 third downs, a 23.1 percent rate.
Buffalo converted 6 of 15, or 40.0 percent.
Those numbers strongly favored Buffalo.
The Bills also converted 2 of 3 fourth-down attempts, while Philadelphia did not attempt a fourth down.
This makes the final result even more interesting.
Buffalo was better at sustaining drives.
Philadelphia was better at making its limited scoring chances count.
The Eagles did not win because they controlled every down. They won because the scoreboard remained in their favor after the most important scoring opportunities had been settled.
Red-Zone Efficiency
Red-zone performance provides another important layer.
Philadelphia went 1-for-2 in the red zone, a 50 percent touchdown rate.
Buffalo went 2-for-3, converting two red-zone opportunities into rushing touchdowns.
At first glance, Buffalo’s red-zone efficiency was better.
But Philadelphia’s two successful field goals outside those touchdown possessions helped compensate.
This is an important lesson when evaluating low-scoring games. Red-zone touchdown rate matters, but so does the ability to take points when a touchdown is not available.
Philadelphia did exactly that.
First-Half Control Defined the Game
The Eagles scored all 13 of their points before halftime.
The Bills scored all 12 of their points in the fourth quarter.
That split tells almost the entire story.
Philadelphia’s offense was not explosive, but it was productive enough early to build a cushion.
Buffalo’s offense was much more productive statistically, but it waited too long to convert that production into points.
The game essentially became two separate contests.
The first half belonged to Philadelphia.
The fourth quarter belonged to Buffalo.
Philadelphia’s defense had to make sure the second half did not erase the first.
What the Player Statistics Really Tell Us
The most useful way to interpret these numbers is to separate them into three categories: volume, efficiency, and leverage.
Volume
Buffalo clearly won the volume battle.
The Bills had:
- More offensive plays
- More total yards
- More passing yards
- More rushing yards
- More first downs
- More time of possession
- More completed passes
Efficiency
The picture becomes more balanced when efficiency is considered.
Philadelphia:
- Avoided interceptions
- Allowed only one sack
- Converted two field goals
- Scored a passing touchdown
- Forced a turnover
- Produced five sacks defensively
Buffalo:
- Averaged 7.5 yards per passing attempt
- Averaged 3.6 yards per rush
- Converted 40 percent of third downs
- Converted two of three fourth downs
- Produced two rushing touchdowns
Leverage
This is where Philadelphia gained the decisive advantage.
The Eagles scored first.
- They built a 13-0 lead.
- They entered halftime with all 13 points already on the board.
- They then prevented Buffalo from completing the comeback.
The final two-point attempt failed, leaving Buffalo one point short.
That is why the game cannot be accurately summarized by saying that Buffalo had better offensive statistics.
Key Player Takeaways
Several individual performances stand out when the complete statistical picture is considered.
Jalen Hurts
Hurts had modest passing numbers but produced the game’s Philadelphia touchdown and avoided turnovers.
His value came from protecting the football and contributing to an early lead.
Josh Allen
Allen produced 262 passing yards and two rushing touchdowns.
He was the engine of Buffalo’s fourth-quarter comeback, but five sacks and the late failed conversion prevented the comeback from becoming a victory.
Saquon Barkley
Barkley handled 19 carries and produced 68 rushing yards.
He did not have a huge average, but his workload helped Philadelphia maintain a functional ground attack.
A.J. Brown
Brown led Philadelphia in receiving yardage with 68 yards and produced the team’s longest reception of 27 yards.
Brandin Cooks
Cooks was Buffalo’s explosive receiving threat, finishing with 101 yards and a 50-yard reception.
Dallas Goedert
Goedert had only 8 receiving yards, but his one-yard touchdown was one of the most important plays of the game.
Philadelphia’s Pass Rush
The Eagles’ five sacks against Allen were arguably the most influential defensive statistic.
Why the 13-12 Score Matters
A 13-12 game forces us to think differently about offensive performance.
In a high-scoring game, a quarterback can throw for 300 yards and three touchdowns and still have room for mistakes.
In a game where the winning team scores only 13 points, every successful scoring drive carries enormous weight.
Philadelphia scored 13 points.
Buffalo scored 12.
That means the difference between victory and defeat was not a massive offensive gap. It was a handful of individual moments.
A touchdown here.
A field goal there.
A sack.
A fumble.
A missed extra point.
A failed two-point conversion.
Those moments collectively decided the game.
What Fans Should Take Away From the Box Score
The biggest lesson from these Philadelphia Eagles vs Buffalo Bills Match Player Stats is that statistical dominance and winning football are not always identical.
Buffalo’s offense generated 331 yards.
Philadelphia generated 190.
Buffalo ran 73 plays.
Philadelphia ran 54.
Buffalo possessed the ball for more than 35 minutes.
Philadelphia still won.
The Eagles succeeded because they were more effective at turning important opportunities into points and because their defense prevented Buffalo’s late offensive surge from producing the final two points it needed.
- For analysts, this is a useful reminder that box-score statistics should be interpreted in context.
- For fans, it explains why the final score looked so strange compared with the yardage totals.
- For fantasy football players, it shows why yardage and fantasy production do not always correspond directly to game-winning impact.
- For coaches and analysts, it highlights the importance of sacks, turnovers, field goals, red-zone decisions, and late-game execution.
Frequently Asked Questions
Who won the Eagles vs Bills game in Week 17 of 2025?
The Philadelphia Eagles defeated the Buffalo Bills 13-12 in Week 17 of the 2025 NFL season.
How many passing yards did Jalen Hurts have?
Jalen Hurts completed 13 of 27 passes for 110 yards, one touchdown, and no interceptions.
How many passing yards did Josh Allen have?
Josh Allen completed 23 of 35 passes for 262 yards, with no passing touchdowns and no interceptions.
Who led the Eagles in rushing?
Saquon Barkley led Philadelphia with 19 carries for 68 yards.
Who was Buffalo’s leading receiver?
Brandin Cooks led Buffalo with four receptions for 101 yards, including a 50-yard reception.
Why did Buffalo lose despite having more total yards?
Buffalo generated more offense but failed to turn enough of that production into points. Philadelphia built a 13-0 halftime lead, forced a turnover, recorded five sacks, converted two field goals, and survived Buffalo’s fourth-quarter comeback attempt.
Conclusion
The Philadelphia Eagles vs Buffalo Bills Match Player Stats from this Week 17 matchup demonstrate how misleading a simple yardage comparison can be.
Buffalo produced 331 total yards compared with Philadelphia’s 190. Josh Allen threw for 262 yards, James Cook added 74 rushing yards, and Brandin Cooks exceeded 100 receiving yards. The Bills also controlled time of possession, first downs, offensive plays, and third-down efficiency.
Philadelphia’s advantage came in the areas that mattered most to the final score.
Jalen Hurts threw the game’s only Philadelphia passing touchdown. Dallas Goedert converted that opportunity into points. Jake Elliott made both field-goal attempts. The Eagles recorded five sacks and created a Buffalo turnover. Most importantly, Philadelphia protected its football and built a 13-0 lead before halftime.
Buffalo’s fourth-quarter response was impressive. Allen rushed for two touchdowns and helped bring the Bills within one point. But the missed extra point and failed two-point conversion left Buffalo short of the comeback it needed.
The result was a 13-12 Philadelphia victory that serves as a strong example of situational football. Buffalo won much of the statistical battle, but Philadelphia won the scoring battle by the smallest possible margin.
For readers analyzing this matchup, the most meaningful numbers are therefore not simply the passing yards or total offense. The five Philadelphia sacks, Buffalo’s lost fumble, Elliott’s two field goals, Goedert’s touchdown, and the Bills’ unsuccessful late conversion explain much more about why the Eagles walked away with the win.
The official NFL game center provides the complete game record and statistical reference for the matchup. NFL official game center: Eagles at Bills, Week 17



2 Comments