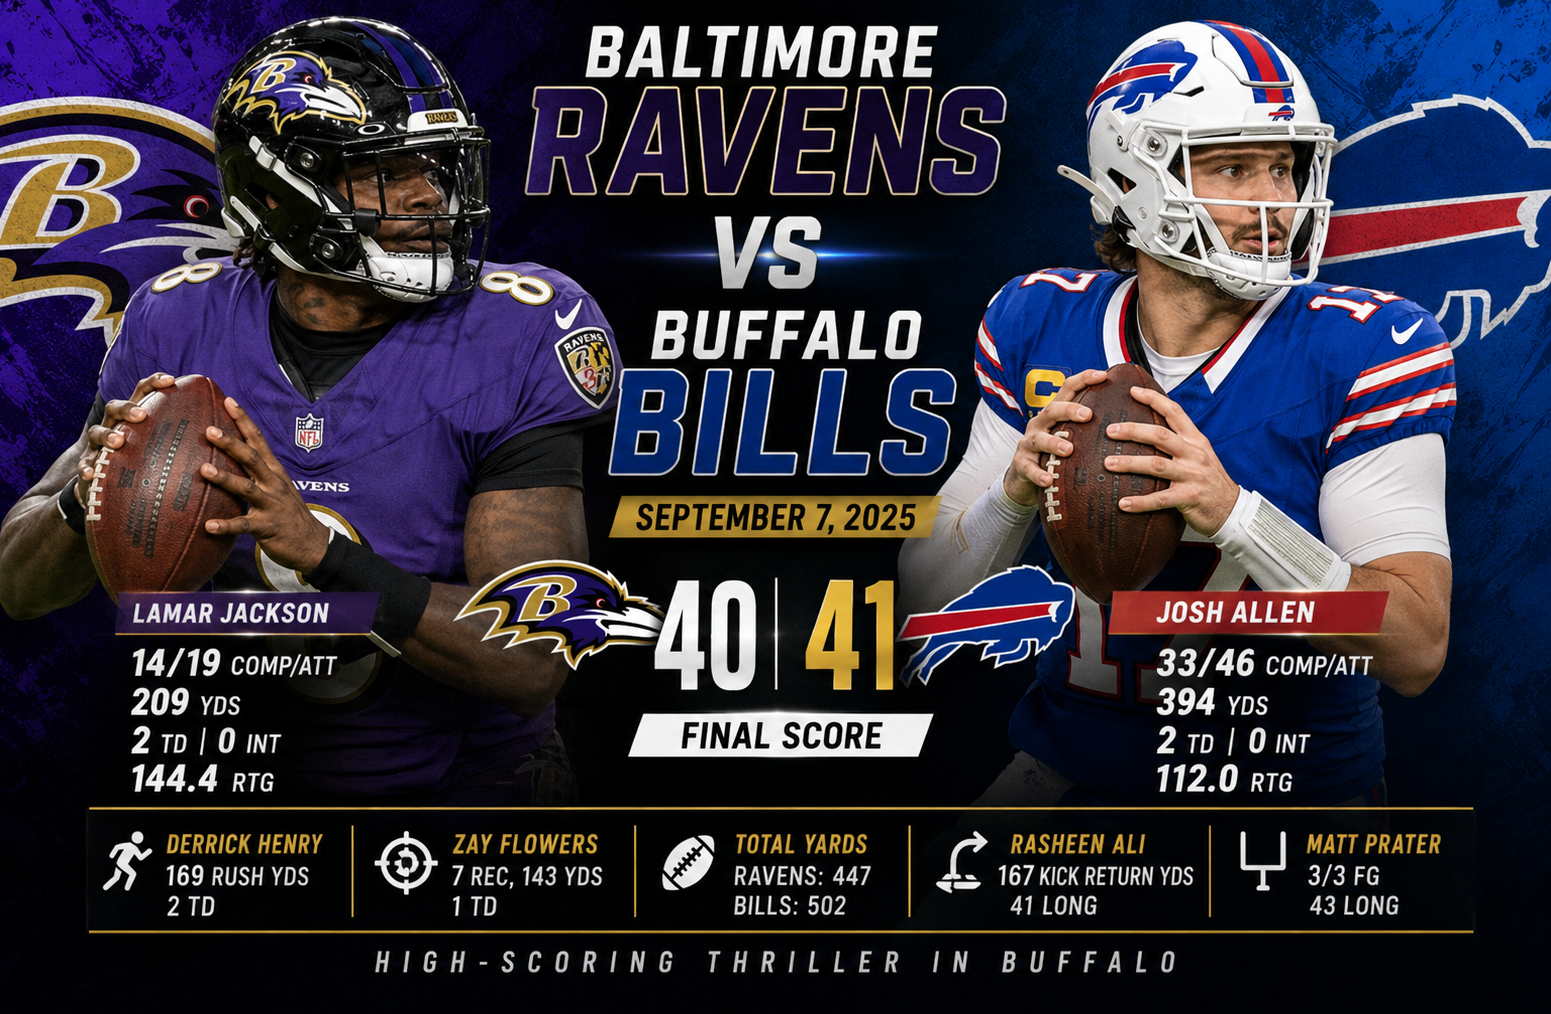
Baltimore Ravens vs Buffalo Bills Match Player Stats
The Baltimore Ravens vs Buffalo Bills Match Player Stats from September 7, 2025, tell the story of one of the most productive and tightly contested games of the season. Buffalo defeated Baltimore 41-40, but the box score shows that this was far more than a simple one-point victory. Both offenses produced explosive plays, both quarterbacks protected the football, and several individual performances stood out across passing, rushing, receiving, and special teams.
Baltimore finished with 238 rushing yards on only 29 attempts, averaging 8.2 yards per carry. Buffalo, meanwhile, threw for 394 yards through Josh Allen while completing 33 passes. Lamar Jackson accounted for 209 passing yards and added another 70 rushing yards. Derrick Henry produced 169 rushing yards and two touchdowns, while Zay Flowers delivered 143 receiving yards and a touchdown.
The final score was Buffalo Bills 41, Baltimore Ravens 40. Buffalo moved to 1-0, while Baltimore opened the season 0-1.
This article breaks down the most important numbers from the game and explains what those statistics actually tell us about how the contest developed.
Baltimore Ravens vs Buffalo Bills Match Player Stats at a Glance
The basic game information provides the starting point for understanding the performance of both teams.
| Category | Buffalo Bills | Baltimore Ravens |
| Final Score | 41 | 40 |
| Record After Game | 1-0 | 0-1 |
| Passing Yards | 394 | 209 |
| Passing Attempts | 46 | 19 |
| Passing TDs | 2 | 2 |
| Interceptions | 0 | 0 |
| Rushing Attempts | 31 | 29 |
| Rushing Yards | 108 | 238 |
| Rushing TDs | 3 | 3 |
| Total Offensive Yards | 502 | 447 |
| Sacks Allowed | 1 | 2 |
One of the biggest statistical contrasts is immediately visible. Baltimore dominated the ground game, while Buffalo generated a much larger passing volume.
That difference created two very different offensive profiles.
Baltimore was highly efficient on the ground and dangerous whenever Derrick Henry or Lamar Jackson found space. Buffalo relied heavily on Josh Allen’s arm and produced enough passing volume to overcome Baltimore’s exceptional rushing performance.
Josh Allen’s Passing Performance
Josh Allen was one of the most important reasons Buffalo escaped with the victory.
Allen completed 33 of 46 passes for 394 yards and two touchdowns. He did not throw an interception. His completion rate was approximately 71.7 percent, and he averaged 8.6 yards per passing attempt.
His reported quarterback rating was 112.0, while his QBR was 76.9.
Those numbers show a quarterback who combined volume with efficiency.
Allen attempted 46 passes, which is significantly more than Lamar Jackson’s 19 attempts. Buffalo therefore asked its quarterback to carry a much larger share of the passing offense.
Allen’s key passing numbers
- Completions: 33
- Attempts: 46
- Completion rate: 71.7 percent
- Passing yards: 394
- Average: 8.6 yards per attempt
- Touchdowns: 2
- Interceptions: 0
- Sacks: 1
- Sack yards: 5
- QBR: 76.9
- Passer rating: 112.0
The most impressive part is that Allen maintained strong efficiency despite the heavy workload.
He also spread the ball effectively. Keon Coleman led Buffalo with 112 receiving yards, while Khalil Shakir, Joshua Palmer, James Cook III, and Dalton Kincaid all contributed meaningful production.
That distribution made Buffalo’s passing attack difficult to reduce to one receiver.
Lamar Jackson’s Dual-Threat Impact
Lamar Jackson’s passing totals were smaller than Allen’s, but his overall offensive impact was much greater when his rushing production is included.
Jackson completed 14 of 19 passes for 209 yards and two touchdowns without throwing an interception. He averaged 11.0 yards per attempt and recorded a 144.4 passer rating.
He also ran six times for 70 yards and a touchdown.
That means Jackson accounted for 279 yards of combined passing and rushing production, along with three total touchdowns.
Lamar Jackson’s key numbers
- Passing completions: 14
- Passing attempts: 19
- Passing yards: 209
- Passing average: 11.0 yards per attempt
- Passing touchdowns: 2
- Interceptions: 0
- Sacks: 2
- Sack yards: 15
- QBR: 94.9
- Passer rating: 144.4
- Rushing attempts: 6
- Rushing yards: 70
- Rushing touchdown: 1
- Long rush: 19 yards
Jackson’s 11.0 yards per attempt is especially notable. Baltimore did not need him to throw 40 or 50 times to create explosive passing production.
Instead, the Ravens combined his efficient passing with a powerful rushing attack.
Derrick Henry Dominates the Ground Game
Derrick Henry was arguably the most physically dominant runner in the game.
Henry carried the ball 18 times for 169 yards, an average of 9.4 yards per carry. He scored two touchdowns and produced a long run of 49 yards.
His rushing performance accounted for more than 70 percent of Baltimore’s team rushing yardage.
Derrick Henry rushing statistics
| Statistic | Derrick Henry |
| Carries | 18 |
| Rushing Yards | 169 |
| Average | 9.4 |
| Touchdowns | 2 |
| Longest Run | 49 yards |
The 49-yard run was especially important because it demonstrates the explosive upside Baltimore possessed on the ground.
A 9.4-yard average is also difficult to sustain over a full game. Henry consistently generated significant yardage on relatively limited attempts, which helped Baltimore maintain offensive efficiency without relying heavily on Jackson’s arm.
Henry also caught one pass for 13 yards.
His overall contribution was therefore 182 yards from scrimmage and two rushing touchdowns.
However, Henry also recorded one fumble that was lost. That turnover mattered because the game was decided by only one point.
Zay Flowers Provides Explosive Receiving Production
Zay Flowers was Baltimore’s leading receiver and one of the most productive offensive players in the entire game.
Flowers caught seven passes for 143 yards and one touchdown on nine targets.
He averaged 20.4 yards per reception and recorded a long reception of 39 yards.
Zay Flowers receiving numbers
- Receptions: 7
- Targets: 9
- Receiving yards: 143
- Average: 20.4 yards per reception
- Touchdown: 1
- Long reception: 39 yards
Flowers’ performance is significant because Baltimore’s passing offense produced 209 yards in total, meaning Flowers accounted for roughly 68 percent of the team’s receiving yardage.
That is an enormous share.
It also shows that Baltimore’s passing attack was highly concentrated around its most explosive receiver.
When Jackson found Flowers downfield, the Ravens were able to generate major chunks of offense without needing a large passing volume.
DeAndre Hopkins Adds a Touchdown
DeAndre Hopkins recorded two receptions for 35 yards and a touchdown on two targets.
His average was 17.5 yards per reception, with a long reception of 29 yards.
Although his total volume was much lower than Flowers’, Hopkins was highly efficient with the opportunities he received.
His touchdown gave Baltimore another important scoring option and demonstrated that the Ravens could generate explosive plays from multiple receiving positions.
Buffalo’s Receiving Attack
Buffalo’s passing game was much more distributed than Baltimore’s.
Keon Coleman led the Bills with 112 receiving yards and a touchdown. He caught eight passes on 11 targets and averaged 14.0 yards per reception.
Khalil Shakir caught six passes for 64 yards on nine targets.
Joshua Palmer added five receptions for 61 yards on nine targets.
James Cook III contributed five catches for 58 yards and produced the longest reception of the game for Buffalo, a 51-yard play.
Dalton Kincaid caught four passes for 48 yards and a touchdown.
Buffalo receiving leaders
| Player | Rec. | Yards | Avg. | TD | Targets |
| Keon Coleman | 8 | 112 | 14.0 | 1 | 11 |
| Khalil Shakir | 6 | 64 | 10.7 | 0 | 9 |
| Joshua Palmer | 5 | 61 | 12.2 | 0 | 9 |
| James Cook III | 5 | 58 | 11.6 | 0 | 5 |
| Dalton Kincaid | 4 | 48 | 12.0 | 1 | 4 |
This distribution is one of the clearest differences between the two passing offenses.
Baltimore’s receiving production was heavily concentrated in Flowers.
Buffalo, on the other hand, had five players contribute at least 48 receiving yards.
That gave Allen multiple ways to attack the Ravens defense.
James Cook’s Contribution
James Cook III had a mixed but valuable statistical performance.
On the ground, Cook carried 13 times for 44 yards and a touchdown. He averaged 3.4 yards per carry and had an 11-yard long run.
His rushing efficiency was considerably lower than Henry’s.
However, Cook was much more involved as a receiver. He caught five passes for 58 yards, including a 51-yard reception.
That reception was particularly valuable because it created a major gain without requiring Buffalo to win a series of short-yardage plays.
Cook therefore finished with 102 yards from scrimmage and one rushing touchdown.
His performance is a good example of why box-score analysis should not focus exclusively on rushing averages.
Buffalo’s Rushing Attack
Buffalo rushed 31 times for 108 yards and three touchdowns.
The team averaged 3.5 yards per carry.
Josh Allen was a major part of that production. He carried 14 times for 30 yards and two touchdowns.
Buffalo rushing leaders
| Player | Carries | Yards | Average | TD | Long |
| James Cook III | 13 | 44 | 3.4 | 1 | 11 |
| Josh Allen | 14 | 30 | 2.1 | 2 | 9 |
| Ty Johnson | 2 | 24 | 12.0 | 0 | 17 |
| Elijah Moore | 1 | 8 | 8.0 | 0 | 0 |
| Ray Davis | 1 | 2 | 2.0 | 0 | 0 |
The statistics show an interesting contrast.
Buffalo did not run the ball with the same efficiency as Baltimore, but its rushing attack still produced three touchdowns.
Allen’s rushing ability was particularly important around the goal line.
Baltimore’s Rushing Numbers Were Exceptional
Baltimore finished with 238 rushing yards on 29 carries.
An 8.2-yard team rushing average is the kind of number that immediately stands out in any NFL box score.
The Ravens also scored three rushing touchdowns.
Henry supplied two, while Jackson added one.
Baltimore rushing leaders
| Player | Carries | Yards | Average | TD | Long |
| Derrick Henry | 18 | 169 | 9.4 | 2 | 49 |
| Lamar Jackson | 6 | 70 | 11.7 | 1 | 19 |
| Zay Flowers | 2 | 8 | 4.0 | 0 | 0 |
| Rasheen Ali | 1 | 5 | 5.0 | 0 | 0 |
| Justice Hill | 2 | -14 | -7.0 | 0 | 0 |
Jackson averaged 11.7 yards per rushing attempt.
That number was even higher than Henry’s impressive 9.4-yard average.
The negative 14 yards from Justice Hill reduced the team’s overall efficiency, but Baltimore still finished with a huge rushing advantage.
Total Offensive Comparison
The total yardage numbers help explain the unusual nature of the game.
| Offensive Category | Ravens | Bills |
| Passing Yards | 209 | 394 |
| Rushing Yards | 238 | 108 |
| Total Yards | 447 | 502 |
| Rushing Attempts | 29 | 31 |
| Passing Attempts | 19 | 46 |
| Total Offensive Attempts | 48 | 77 |
Buffalo generated 55 more total yards.
However, the Bills needed considerably more offensive plays to produce those yards.
Baltimore’s 447 yards came from just 48 offensive attempts.
That works out to approximately 9.3 yards per offensive play.
Buffalo produced 502 yards on 77 combined rushing and passing attempts, or approximately 6.5 yards per offensive attempt.
This is an important analytical point.
The Ravens were extremely explosive and efficient on a per-play basis, while Buffalo generated more total production through volume.
Why Buffalo’s Passing Volume Mattered
The game demonstrates an important principle in NFL statistics: total yardage and efficiency are not always the same thing.
Baltimore produced fewer total yards, but its running game was far more efficient.
Buffalo generated 394 passing yards, which helped compensate for a relatively modest rushing average.
Allen’s 46 pass attempts created many opportunities for Buffalo’s receivers.
The Bills also avoided interceptions.
That combination of volume, efficiency, and ball security helped Buffalo turn its offensive yardage into enough points to win.
Turnovers Played a Major Role
Neither quarterback threw an interception.
That is important because both Jackson and Allen were aggressive enough to generate explosive plays without committing a passing turnover.
Baltimore did, however, lose a fumble by Derrick Henry.
The Ravens recorded two total fumbles, with one lost.
Buffalo had one fumble but did not lose it.
Turnover summary
| Team | Fumbles | Lost | Interceptions |
| Baltimore | 2 | 1 | 0 |
| Buffalo | 1 | 0 | 0 |
In a one-point game, a single lost possession becomes especially important.
It would be inaccurate to say the fumble alone determined the outcome, because football games are influenced by many possessions and plays. But it was unquestionably one of the statistical differences between the teams.
Baltimore Defensive Performance
Baltimore recorded 75 total tackles, including 53 solo tackles.
The Ravens had one sack, three tackles for loss, four passes defended, and three quarterback hits.
Roquan Smith led the team with 10 total tackles and eight solo tackles.
Nnamdi Madubuike recorded Baltimore’s only sack.
Baltimore defensive leaders
| Category | Player | Production |
| Total tackles | Roquan Smith | 10 |
| Solo tackles | Roquan Smith | 8 |
| Sacks | Nnamdi Madubuike | 1 |
| Team tackles | Ravens | 75 |
| Passes defended | Ravens | 4 |
| QB hits | Ravens | 3 |
Baltimore’s defense generated some pressure, but it did not produce a turnover.
Against a quarterback who threw 46 passes without an interception, that absence of takeaways was significant.
Buffalo Defensive Performance
Buffalo recorded 52 total tackles and 44 solo tackles.
The Bills produced two sacks, five tackles for loss, one pass defended, and four quarterback hits.
Christian Benford led Buffalo with seven total tackles and five solo tackles.
Ed Oliver and Matt Milano each recorded a sack.
Buffalo defensive leaders
| Category | Player | Production |
| Total tackles | Christian Benford | 7 |
| Solo tackles | Christian Benford | 5 |
| Sacks | Ed Oliver | 1 |
| Sacks | Matt Milano | 1 |
| Team tackles | Bills | 52 |
| Tackles for loss | Bills | 5 |
| QB hits | Bills | 4 |
Buffalo’s defense did not create an interception either, but it managed to generate two sacks and slightly more quarterback pressure than Baltimore.
Special Teams Statistics
Special teams often receive less attention than offensive statistics, but the numbers were relevant in a game decided by one point.
Baltimore’s Tyler Loop made both of his field-goal attempts, including a 52-yard kick. He also converted four of five extra-point attempts for 10 points.
Buffalo’s Matt Prater made all three field-goal attempts, with a long of 43 yards. He also converted both extra points and scored 11 points.
Kicking comparison
| Statistic | Tyler Loop | Matt Prater |
| Field goals | 2/2 | 3/3 |
| FG percentage | 100% | 100% |
| Long FG | 52 yards | 43 yards |
| Extra points | 4/5 | 2/2 |
| Total points | 10 | 11 |
Prater’s perfect field-goal record and one extra point made the difference in kicking points.
Baltimore’s Tyler Loop also performed well, especially with a successful 52-yard field goal.
Kick Return Production
Baltimore’s Rasheen Ali returned six kicks for 167 yards.
His average was 27.8 yards per return, with a long of 41 yards.
Buffalo’s Brandon Codrington returned five kicks for 139 yards, also averaging 27.8 yards per return.
Ty Johnson added two returns for 54 yards.
Buffalo finished with 193 kick-return yards and a 27.6-yard average.
Kick return comparison
| Team | Returns | Yards | Average | Long |
| Baltimore | 6 | 167 | 27.8 | 41 |
| Buffalo | 7 | 193 | 27.6 | 41 |
Both teams were productive in the return game.
Neither team recorded a kick-return touchdown.
Punting Comparison
Jordan Stout punted three times for Baltimore for 152 yards.
His average was 50.7 yards, with a long punt of 59 yards. He placed one punt inside the 20-yard line and recorded one touchback.
Brad Robbins punted four times for Buffalo for 158 yards.
He averaged 39.5 yards, had a long of 48 yards, and placed one punt inside the 20.
The raw punting average favored Baltimore.
What the Numbers Say About the Game
The most interesting feature of this matchup is that the losing team was exceptionally efficient offensively.
Baltimore averaged 8.2 yards per rushing attempt and produced 238 rushing yards.
Henry averaged 9.4 yards per carry.
Jackson averaged 11.7 yards per rush.
Flowers averaged 20.4 yards per reception.
These numbers are not typical of an offense that loses by only one point.
At the same time, Buffalo’s 502 total yards were the highest team total in the matchup.
The Bills achieved that production through a dramatically different offensive strategy.
Allen threw 46 passes.
Buffalo completed 33 of them.
Five different Buffalo players recorded at least 48 receiving yards.
That passing distribution allowed Buffalo to keep producing first downs and offensive yardage even though its running game averaged only 3.5 yards per attempt.
The Biggest Statistical Mismatches
Several areas clearly separated the teams.
1. Passing production
Buffalo had a massive advantage in passing yardage.
The Bills produced 394 passing yards compared with Baltimore’s 209.
That was a difference of 185 yards.
2. Rushing production
Baltimore dominated the rushing category.
The Ravens produced 238 rushing yards compared with Buffalo’s 108.
That gave Baltimore a 130-yard advantage on the ground.
3. Total offense
Buffalo still finished ahead in total offense.
The Bills produced 502 yards, while Baltimore generated 447.
The difference was 55 yards.
4. Turnovers
Neither team threw an interception.
Baltimore lost one fumble, while Buffalo did not lose one.
5. Explosive plays
Both offenses generated big plays.
Henry had a 49-yard run.
Cook recorded a 51-yard reception.
Flowers had a 39-yard reception.
These explosive gains help explain why both teams scored 40 or more points.
What Derrick Henry’s Numbers Reveal
Henry’s performance deserves more attention than his two touchdowns alone.
He averaged 9.4 yards per carry across 18 attempts.
Even after accounting for his 49-yard run, his production demonstrates that Baltimore consistently created favorable rushing opportunities.
His lost fumble, however, is the clearest negative statistic attached to his performance.
This is an important reminder that individual box-score dominance can coexist with a costly mistake.
Henry still finished with one of the strongest statistical performances in the game.
What Zay Flowers’ Numbers Reveal
Flowers was Baltimore’s primary explosive receiving weapon.
Seven catches for 143 yards is an excellent performance by itself.
The 20.4-yard reception average makes it even more impressive.
His nine targets also show that Jackson looked toward him frequently despite Baltimore’s low passing volume.
Flowers’ numbers suggest Baltimore did not need a high-volume passing attack to create explosive gains.
What Josh Allen’s Numbers Reveal
Allen’s performance was built on volume and consistency.
He threw 46 passes and completed 33.
He generated 394 yards and two touchdowns without an interception.
His ability to distribute the ball across multiple receivers was particularly valuable.
Coleman led the team with 112 yards, but Shakir, Palmer, Cook, and Kincaid also contributed significantly.
That balance reduced Buffalo’s dependence on a single receiving option.
What Lamar Jackson’s Numbers Reveal
Jackson’s numbers demonstrate why his impact cannot be evaluated through passing statistics alone.
He produced 209 passing yards, then added 70 rushing yards.
He scored two passing touchdowns and one rushing touchdown.
His 144.4 passer rating was higher than Allen’s 112.0.
Yet Buffalo still won because Allen’s passing volume and Buffalo’s overall offensive production were enough to produce 41 points.
This is a classic example of how quarterback efficiency and team success are related but not identical.
How to Read These Stats Correctly
A box score should not be treated as a list of winners and losers.
For this matchup, a better approach is to examine four layers:
- Volume: How many opportunities did each player receive?
- Efficiency: What did the player produce from those opportunities?
- Explosiveness: How often did the player create major gains?
- Mistakes: Did turnovers or negative plays reduce the value of that production?
Using that framework produces a much clearer picture.
Allen had huge passing volume and strong efficiency.
Jackson had lower passing volume but excellent efficiency plus major rushing production.
Henry had elite rushing efficiency but lost a fumble.
Flowers produced huge receiving numbers from only nine targets.
Buffalo’s receiving group produced more balanced volume across several players.
Why the One-Point Margin Matters
The final score was Buffalo 41, Baltimore 40.
That one-point difference makes individual mistakes and special teams production more important than they would be in a comfortable victory.
Baltimore’s lost fumble stands out.
Buffalo’s perfect field-goal performance also stands out.
The Bills made three field goals.
The Ravens made two.
Prater scored 11 kicking points compared with Loop’s 10.
None of these statistics alone explains the entire result.
Together, however, they illustrate why extremely close NFL games often come down to a combination of offensive efficiency, possession value, red-zone execution, and special teams.
Where Each Team Was Strongest
Baltimore’s strengths
Baltimore’s strongest areas were:
- Rushing efficiency
- Derrick Henry’s production
- Lamar Jackson’s dual-threat ability
- Zay Flowers’ explosive receiving
- Overall yards per offensive attempt
- Kick-return efficiency
The Ravens consistently created explosive plays.
Buffalo’s strengths
Buffalo’s strongest areas were:
- Passing volume
- Passing yardage
- Receiver distribution
- Ball security
- Field-goal accuracy
- Overall total yardage
The Bills found a different path to 41 points.
Rather than dominating on the ground, they used Allen and a broad receiving group to sustain offensive production.
Player Performances That Deserve the Most Attention
Several players stand out when the complete statistical picture is considered.
Josh Allen: 33 completions, 394 yards, two passing touchdowns, zero interceptions, plus 30 rushing yards and two rushing touchdowns.
Lamar Jackson: 209 passing yards, two passing touchdowns, zero interceptions, 70 rushing yards, and one rushing touchdown.
Derrick Henry: 169 rushing yards, two rushing touchdowns, and a 9.4-yard average.
Zay Flowers: 143 receiving yards and a touchdown on seven receptions.
Keon Coleman: 112 receiving yards and a touchdown.
James Cook III: 102 total yards from scrimmage and one rushing touchdown.
Roquan Smith: 10 total tackles and eight solo tackles.
Christian Benford: Seven total tackles and five solo tackles.
These performances show that the game was not controlled by a single player.
It was a collection of major individual contributions from both sides.
Data Accuracy and Source Context
The statistics used throughout this article come directly from the game data supplied for the September 7, 2025 matchup, including the listed ESPN Game ID 401772918.
For readers who want to compare the box score against an authoritative league source, the NFL official website is a useful reference for league and game information.
Because this analysis is based on the supplied box-score data, it focuses on the statistical record rather than adding unsupported claims about coaching decisions, injuries, play-calling, or events that are not contained in the provided data.
Frequently Asked Questions
Who won the Ravens vs Bills game on September 7, 2025?
The Buffalo Bills defeated the Baltimore Ravens 41-40 on September 7, 2025.
How many passing yards did Josh Allen have?
Josh Allen completed 33 of 46 passes for 394 yards, two touchdowns, and zero interceptions.
How many rushing yards did Derrick Henry have?
Derrick Henry rushed 18 times for 169 yards, averaging 9.4 yards per carry. He scored two rushing touchdowns.
How many receiving yards did Zay Flowers have?
Zay Flowers caught seven passes for 143 yards and one touchdown on nine targets.
How many rushing yards did Lamar Jackson have?
Lamar Jackson rushed six times for 70 yards and one touchdown. He also passed for 209 yards and two touchdowns.
Did either quarterback throw an interception?
No. Neither Lamar Jackson nor Josh Allen threw an interception in the game.
Conclusion
The Baltimore Ravens vs Buffalo Bills Match Player Stats reveal a game defined by contrasting offensive approaches.
Baltimore was outstanding on the ground, producing 238 rushing yards at an 8.2-yard average. Derrick Henry led that attack with 169 yards, while Lamar Jackson added 70 rushing yards and another touchdown. Zay Flowers was also highly productive, finishing with 143 receiving yards.
Buffalo took a different route.
Josh Allen threw for 394 yards and two touchdowns while completing 33 of 46 attempts without an interception. The Bills also received meaningful production from several receivers, including Keon Coleman, Khalil Shakir, Joshua Palmer, James Cook III, and Dalton Kincaid.
The final statistical picture is therefore unusual. Baltimore was more efficient on the ground, while Buffalo produced substantially more through the air. The Bills finished with 502 total yards compared with Baltimore’s 447 and ultimately won 41-40.
For anyone studying this matchup, the most useful lesson is not simply which player recorded the biggest number. The deeper story is how different forms of efficiency combined to produce an extremely close result. Baltimore’s explosive rushing attack and Flowers’ receiving production were matched by Buffalo’s passing volume, balanced receiving contributions, and clean turnover profile.
The one-point margin makes every category worth examining, from quarterback efficiency and rushing averages to fumbles, field goals, and return yardage. That is what makes this box score particularly valuable for understanding how individual performances translate into a team result.




One Comment