Miami Dolphins vs Buffalo Bills Match Player Stats
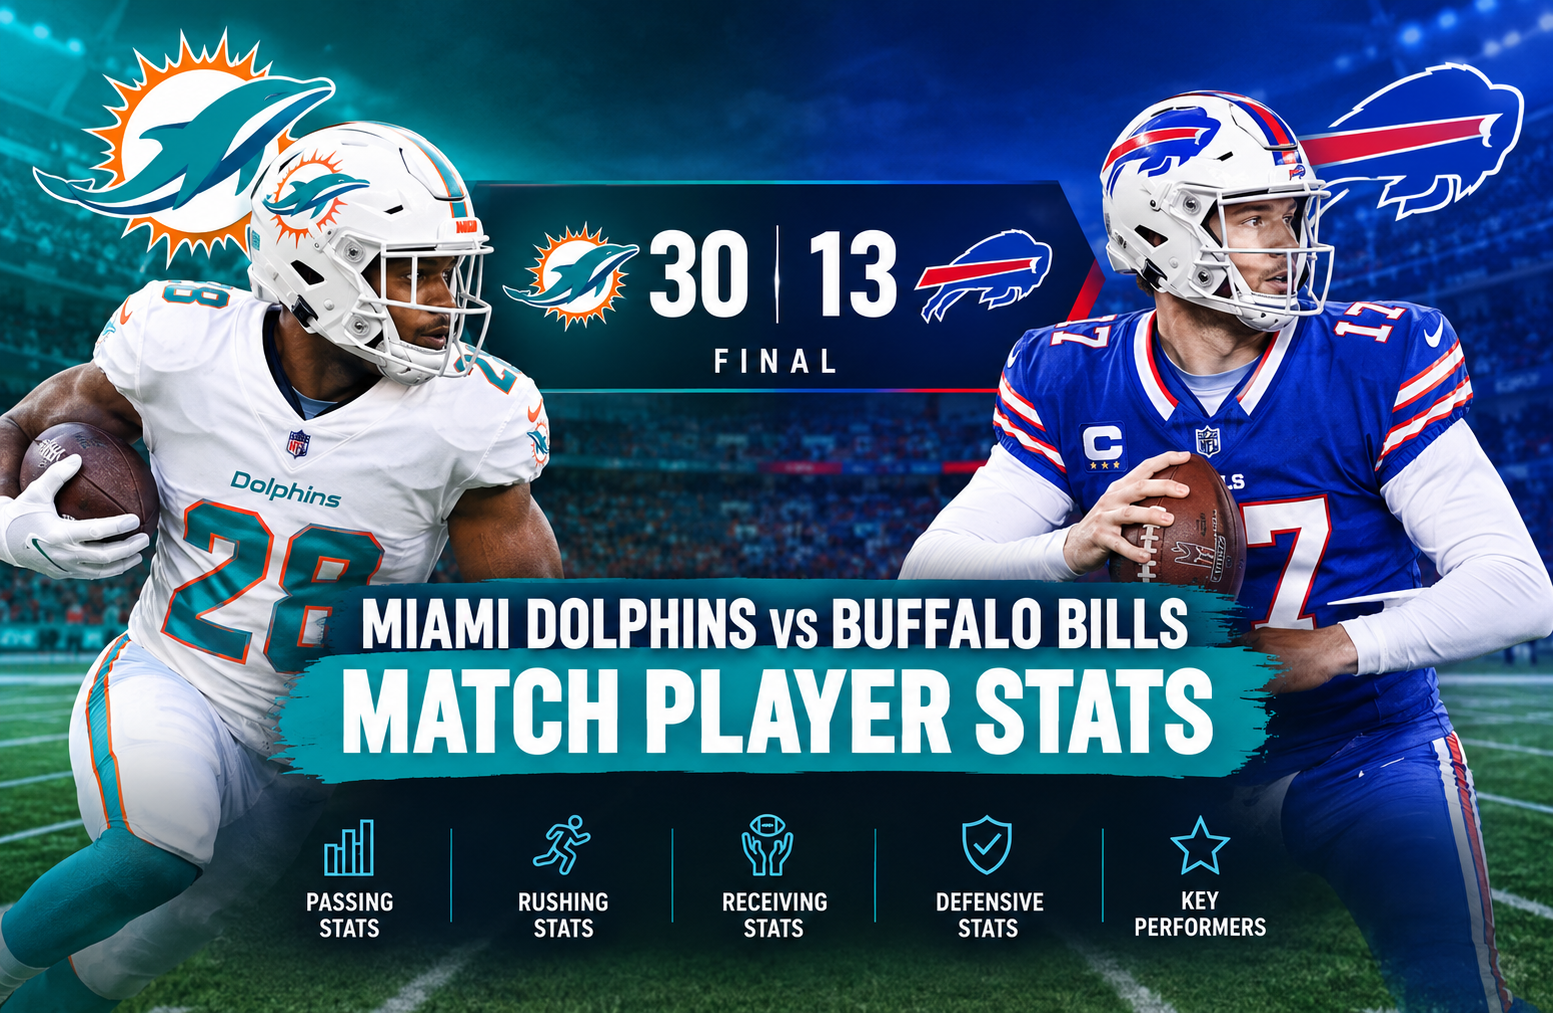
The miami dolphins vs buffalo bills match player stats from November 9, 2025, tell the story of a convincing 30-13 Miami Dolphins victory over the Buffalo Bills. Miami built its win around a powerful rushing attack led by De’Von Achane, who recorded 174 rushing yards and two touchdowns on 22 carries. The Dolphins also benefited from three sacks, a more productive ground game, and a mistake-free performance in the fumble department. Buffalo gained 306 passing yards through Josh Allen but struggled to turn its offensive production into points, finishing with two lost fumbles and no rushing touchdowns. The result showed how a team can win the statistical battle in one area while losing the overall contest through turnovers, red-zone execution, and an inability to contain an explosive opponent.
Match Overview: Miami Dolphins vs Buffalo Bills
The AFC East matchup featured two teams with different records and contrasting performances. Buffalo entered the game with a 6-2 record before the defeat moved the Bills to 6-3. Miami improved to 3-7, earning an important divisional victory at home.
Miami Dolphins
Home team · 3-7 after the game
30 points
Buffalo Bills
Away team · 6-3 after the game
13 points
Game date
November 9, 2025
Final margin
Miami by 17 points
Game status
Final
The final score was more than a reflection of offensive talent. Miami produced 197 rushing yards, compared with Buffalo’s 87. The Dolphins also scored two rushing touchdowns, while Buffalo failed to score on the ground. Although the Bills accumulated 306 passing yards, Miami’s ability to control the running game and capitalize on Buffalo’s mistakes proved decisive.
The official ESPN box score provides the statistical record for the matchup: Miami Dolphins vs Buffalo Bills box score.
Miami Dolphins vs Buffalo Bills Match Player Stats
The most important numbers from this contest reveal why Miami won despite recording fewer passing yards and completions than Buffalo. The Dolphins created their biggest advantage on the ground, while their defense added pressure and benefited from Buffalo’s ball-security problems.
Final Team Statistics
| Statistical category | Miami Dolphins | Buffalo Bills |
| Final score | 30 | 13 |
| Passing completions | 15 | 28 |
| Passing attempts | 21 | 40 |
| Passing yards | 173 | 306 |
| Passing touchdowns | 2 | 2 |
| Interceptions thrown | 2 | 1 |
| Rushing attempts | 32 | 22 |
| Rushing yards | 197 | 87 |
| Yards per carry | 6.2 | 4.0 |
| Rushing touchdowns | 2 | 0 |
| Receptions | 15 | 28 |
| Receiving yards | 173 | 306 |
| Fumbles lost | 0 | 2 |
| Defensive sacks | 3 | 0 |
| Total defensive tackles | 71 | 55 |
| Quarterback hits | 7 | 2 |
These figures highlight three major differences.
First, Miami averaged 6.2 yards per rushing attempt, a substantial advantage over Buffalo’s 4.0. Second, the Dolphins lost no fumbles, while the Bills lost two. Third, Miami recorded three sacks and seven quarterback hits, putting additional pressure on Allen.
Buffalo’s passing advantage was real, not imaginary. The Bills completed 28 passes for 306 yards. However, yardage alone does not explain how efficiently a team scores. Miami found a better balance between passing, rushing, and finishing possessions.
Quarter-by-Quarter Score
| Quarter | Miami Dolphins | Buffalo Bills |
| First quarter | 7 | 0 |
| Second quarter | 9 | 0 |
| Third quarter | 0 | 0 |
| Fourth quarter | 14 | 13 |
| Final | 30 | 13 |
Miami scored 16 points across the first two quarters and added 14 in the fourth. Buffalo’s recorded scoring came entirely in the final quarter.
That distribution matters when interpreting the box score. Miami established an early scoring advantage, while Buffalo’s late points were not enough to erase the deficit. The available statistics establish the scoring pattern, although they do not independently establish every tactical decision made by either coaching staff.
Quarterback Comparison: Josh Allen vs Tua Tagovailoa
Quarterback performance is one of the most searched aspects of any NFL matchup. In this game, Josh Allen produced more passing yards, but Tua Tagovailoa’s shorter statistical line was supported by Miami’s effective rushing production.
Josh Allen
306
Passing yards
Completions
28/40
TD passes
2
Interceptions
1
Passer rating
98.5
QBR
30.0
Tua Tagovailoa
173
Passing yards
Completions
15/21
TD passes
2
Interceptions
2
Passer rating
88.1
QBR
67.0
Josh Allen’s Passing Performance
Allen completed 28 of 40 attempts, giving him a completion rate of 70%. He threw for 306 yards, averaged 7.7 yards per attempt, and recorded two touchdown passes against one interception.
Those numbers demonstrate that Buffalo’s passing offense could move the ball. Allen’s 98.5 passer rating also reflects a productive statistical performance by several traditional passing measures.
However, he was sacked three times for a combined loss of 17 yards. He also lost a fumble, adding to Buffalo’s two lost fumbles as a team.
The key analytical distinction is between moving the ball and protecting possessions. Allen’s passing yardage helped Buffalo generate offense, but the team could not convert that production into enough points to challenge Miami’s lead.
His 30.0 QBR provides a different perspective from his passer rating. These metrics measure performance differently, and neither should be interpreted as a complete explanation of the result. The combination of passing production, turnovers, sacks, and the final score offers a more useful assessment than any single number.
Tua Tagovailoa’s Efficiency
Tagovailoa completed 15 of 21 passes for 173 yards, two touchdowns, and two interceptions. His completion rate was approximately 71.4%, and he averaged 8.2 yards per attempt.
He was not perfect. Two interceptions are significant, and his 88.1 passer rating was lower than Allen’s. It would therefore be misleading to describe Tagovailoa as having won every aspect of the quarterback comparison.
His contribution must instead be considered within Miami’s overall offensive performance. The Dolphins generated 197 rushing yards and two rushing touchdowns, reducing the need for their quarterback to produce the same passing volume as Allen.
Tagovailoa also avoided sacks, finishing with zero recorded sacks taken. That helped Miami avoid the negative yardage Allen experienced from three sacks.
His 67.0 QBR was considerably higher than Allen’s 30.0. Although QBR and passer rating use different methods, the difference reinforces an important lesson: quarterback evaluation involves context, not just passing totals.
Which Quarterback Played Better?
The answer depends on the metric.
- Passing volume: Allen, with 306 yards compared with 173.
- Completion percentage: Tagovailoa, at approximately 71.4% compared with 70%.
- Passing touchdowns: Equal, with two each.
- Interceptions: Allen threw one, while Tagovailoa threw two.
- Passer rating: Allen led, 98.5 to 88.1.
- QBR: Tagovailoa led, 67.0 to 30.0.
- Sacks taken: Tagovailoa avoided sacks, while Allen took three.
Allen produced the larger passing performance, but Tagovailoa’s team won the game. Neither conclusion cancels out the other. The most accurate interpretation is that Buffalo’s passing production was stronger in raw volume, while Miami’s combined offensive and defensive performance was more successful.
De’Von Achane’s Outstanding Rushing Performance
De’Von Achane
Miami Dolphins running back
174 rushing yards
22 carries · 7.9 yards per carry · 2 rushing touchdowns
Longest rush: 59 yards
Achane was the defining offensive performer. His 174 rushing yards accounted for approximately 88.3% of Miami’s 197 team rushing yards. He averaged 7.9 yards per carry and scored twice on the ground.
His 59-yard longest run illustrates how one explosive play can change the statistical profile of a game. Long gains force a defense to respond differently to the running threat, while also helping an offense gain substantial field position without relying on multiple completions.
Achane’s contribution went beyond rushing. He also caught six passes for 51 yards, giving him 225 combined rushing and receiving yards from scrimmage.
That total is especially important because it captures his impact in both phases of the offense. His rushing production stressed Buffalo’s run defense, while his receiving work provided an additional way to gain yards.
Why Achane’s Efficiency Mattered
A running back averaging 7.9 yards per carry can create several advantages:
- Fewer plays needed to gain ground. Miami could cover significant distances without needing a long series of short gains.
- More scoring opportunities. Explosive runs can move an offense into scoring territory quickly.
- Greater offensive flexibility. A credible rushing threat can complement passing plays and prevent the defense from focusing exclusively on the quarterback.
- Pressure on defensive adjustments. A defense that gives up repeated successful runs must decide how to allocate players between stopping the run and defending passes.
The supplied box score does not establish how often Buffalo changed its defensive formations or which specific calls produced each gain. Nevertheless, the rushing totals clearly show that Miami’s ground game was a major source of its advantage.
Other Miami Rushing Contributors
Achane led the way, but the Dolphins also received contributions from several other players.
| Player | Carries | Rushing yards | Average | TDs |
| De’Von Achane | 22 | 174 | 7.9 | 2 |
| Jaylen Wright | 5 | 17 | 3.4 | 0 |
| Alec Ingold | 1 | 6 | 6.0 | 0 |
| Malik Washington | 1 | 4 | 4.0 | 0 |
| Tua Tagovailoa | 2 | -1 | -0.5 | 0 |
| Ollie Gordon II | 1 | -3 | -3.0 | 0 |
The distribution shows that Achane was responsible for most of Miami’s rushing production. Wright added 17 yards, while Ingold and Washington recorded smaller gains.
The team finished with 32 rushing attempts for 197 yards, averaging 6.2 yards per carry. Those figures provide a strong numerical explanation for Miami’s success on the ground.
Buffalo Bills Rushing Stats: James Cook and Josh Allen
Buffalo’s rushing offense produced 87 yards on 22 attempts, averaging 4.0 yards per carry. Unlike Miami, the Bills did not record a rushing touchdown.
James Cook III was Buffalo’s leading rusher, while Allen added meaningful yardage with his legs. Their combined production helped Buffalo move the ball, but it did not match Miami’s efficiency or scoring output.
James Cook III’s Contribution
James Cook III
53 rushing yards
13 carries · 4.1 yards per carry · 0 rushing touchdowns
Longest rush: 14 yards
Cook recorded 13 carries for 53 yards, averaging 4.1 yards per attempt. He also caught five passes for 24 yards, producing 77 combined rushing and receiving yards.
His rushing average was respectable, but the overall output lacked the explosive impact Achane provided. Cook’s longest run was 14 yards, compared with Achane’s 59-yard gain.
Cook also lost a fumble, according to the supplied statistics. That turnover is an important part of his game-day evaluation because ball security affects offensive possessions independently of rushing efficiency.
Josh Allen’s Rushing Numbers
Allen carried the ball four times for 31 yards, averaging 7.8 yards per attempt. His longest rush was 15 yards.
These numbers show that Allen remained a useful rushing threat. His yards per carry were close to Achane’s average, although the small number of attempts makes a direct comparison less meaningful.
Allen’s rushing ability gave Buffalo another way to gain yards when passing plays were unavailable or when he chose to run. However, the team finished without a rushing touchdown.
Comparing the Ground Games
| Metric | Miami | Buffalo |
| Rushing attempts | 32 | 22 |
| Rushing yards | 197 | 87 |
| Average per carry | 6.2 | 4.0 |
| Rushing touchdowns | 2 | 0 |
| Longest rush | 59 yards | 15 yards |
Miami gained 110 more rushing yards than Buffalo. That difference was one of the clearest statistical advantages in the matchup.
The Dolphins also recorded ten more rushing attempts. More attempts alone do not guarantee success, but in this case Miami combined greater volume with significantly better efficiency.
The most revealing comparison is the difference between the teams’ longest runs. Miami’s 59-yard gain demonstrated the explosive potential of its ground attack, while Buffalo’s longest rush was 15 yards.
Receiving Statistics: Jaylen Waddle Leads Miami
The receiving numbers reveal another important difference between the offenses. Buffalo produced more total receiving yards, but Miami’s top receivers contributed to a more balanced overall attack.
Jaylen Waddle led the Dolphins with five receptions for 84 yards and one touchdown. Achane added 51 receiving yards, making him a significant contributor in both rushing and receiving.
Miami Dolphins Receiving Leaders
| Player | Receptions | Yards | Average | TDs |
| Jaylen Waddle | 5 | 84 | 16.8 | 1 |
| De’Von Achane | 6 | 51 | 8.5 | 0 |
| Greg Dulcich | 1 | 22 | 22.0 | 0 |
| Malik Washington | 2 | 9 | 4.5 | 1 |
| Nick Westbrook-Ikhine | 1 | 7 | 7.0 | 0 |
Jaylen Waddle’s Impact
Waddle recorded five receptions on seven targets for 84 yards, averaging 16.8 yards per catch. His longest reception covered 38 yards, and he scored one touchdown.
His receiving average indicates that Miami gained substantial yardage from relatively few catches. Waddle’s production gave the Dolphins a downfield threat that complemented Achane’s rushing dominance.
The combination matters because offenses become more difficult to defend when they can threaten opponents in different ways. A defense focused on the running back must still account for receivers capable of producing large gains.
The statistics do not identify every route, coverage assignment, or defensive mistake behind Waddle’s production. They do establish that he was Miami’s leading receiver by yardage and an important scoring contributor.
De’Von Achane as a Receiver
Achane’s six receptions for 51 yards made him Miami’s reception leader. He averaged 8.5 yards per catch and received six targets.
Combining his receiving and rushing totals gives him 225 yards from scrimmage. That calculation uses 174 rushing yards plus 51 receiving yards and excludes any return yardage.
His receiving work is a useful reminder that a running back’s influence cannot always be understood by looking only at rushing attempts. Players who contribute in both phases can create different problems for opposing defenses.
Malik Washington’s Touchdown Contribution
Washington recorded two receptions for nine yards and one touchdown. His longest reception was nine yards.
Although his yardage total was modest, the touchdown made his contribution meaningful on the scoreboard. Receiving yardage and scoring production are related, but they are not interchangeable measures of a player’s impact.
Buffalo Bills Receiving Leaders
Buffalo’s passing offense produced 306 yards, with Khalil Shakir leading the team in receptions.
| Player | Receptions | Yards | Average | TDs |
| Khalil Shakir | 7 | 58 | 8.3 | 0 |
| Keon Coleman | 3 | 46 | 15.3 | 1 |
| Dalton Kincaid | 2 | 37 | 18.5 | 0 |
| Dawson Knox | 3 | 37 | 12.3 | 0 |
| Jackson Hawes | 1 | 26 | 26.0 | 1 |
| Ty Johnson | 2 | 24 | 12.0 | 0 |
| Tyrell Shavers | 1 | 24 | 24.0 | 0 |
| James Cook III | 5 | 24 | 4.8 | 0 |
| Curtis Samuel | 1 | 21 | 21.0 | 0 |
| Elijah Moore | 2 | 9 | 4.5 | 0 |
| Ray Davis | 1 | 0 | 0.0 | 0 |
Khalil Shakir’s Reliable Volume
Shakir caught seven passes for 58 yards on nine targets. His 7.0 receptions per game figure is not relevant here because this table concerns a single contest; his actual contribution was seven catches in this matchup.
He led Buffalo in receptions, showing that he was a frequently used target. However, his 8.3 yards per reception was lower than the averages recorded by several teammates.
Shakir’s role in the passing game helped Allen distribute the ball across the offense. His performance was valuable for maintaining passing volume, even though he did not score a touchdown.
Keon Coleman and Buffalo’s Touchdown Threat
Coleman finished with three catches for 46 yards and one touchdown on eight targets. His longest reception was 35 yards, and he averaged 15.3 yards per catch.
That average shows how Coleman contributed explosive receiving potential despite finishing with fewer receptions than Shakir. His touchdown also made him one of Buffalo’s scoring contributors.
Jackson Hawes added another touchdown on one reception for 26 yards, averaging 26.0 yards per catch. The figures demonstrate that Buffalo’s passing attack had multiple players capable of producing meaningful gains.
Why More Passing Yards Did Not Produce a Win
Buffalo recorded 133 more passing yards than Miami. It also recorded 13 more receptions.
Yet Miami scored 17 more points.
This difference illustrates why passing yardage should not be used as a standalone predictor of the final score. Yardage describes how much ground an offense gained through the air. It does not independently account for turnovers, rushing touchdowns, defensive pressure, or the value of each scoring possession.
Miami’s two passing touchdowns matched Buffalo’s total, while the Dolphins added two rushing touchdowns. That difference in rushing scores was particularly important.
Defensive Player Stats: Which Defense Made the Difference?
Miami’s defensive performance was another major factor in the 30-13 victory. The Dolphins recorded three sacks, seven quarterback hits, six tackles for loss, and four passes defended. Buffalo recorded no sacks, although the Bills also finished with six tackles for loss and four passes defended.
These numbers show that Miami generated more direct pressure on the opposing quarterback. Buffalo’s defensive production included tackles and disruptive plays, but it did not produce a sack in the supplied statistics.
Miami Dolphins Defensive Leaders
| Player | Total tackles | Solo tackles | Sacks | Tackles for loss |
| Jordyn Brooks | 12 | 6 | 0 | 2 |
| Tyrel Dodson | 9 | 5 | 0 | 0 |
| Minkah Fitzpatrick | 6 | 6 | 0 | 0 |
| Jack Jones | 6 | 3 | 0 | 2 |
Brooks led Miami with 12 total tackles, including six solo tackles and two tackles for loss. His total was the highest among the defensive players highlighted in the supplied statistics.
Dodson added nine tackles, while Fitzpatrick and Jones recorded six each. Jones also contributed two tackles for loss, matching Brooks in that category.
Tackles indicate how often defenders finish plays, but the total does not tell the whole story. Tackles for loss are especially relevant because they show plays in which the offense is stopped behind the line of scrimmage. Such plays can create longer subsequent downs and make it more difficult to sustain a drive.
Miami recorded six tackles for loss as a team. The figures support the conclusion that the defense disrupted Buffalo’s offense in the backfield, even though the available player highlights do not assign all six tackles for loss to the players listed above.
Buffalo Bills Defensive Leaders
| Player | Total tackles | Solo tackles | Sacks | Tackles for loss |
| Jordan Poyer | 8 | 3 | 0 | 0 |
| Cole Bishop | 7 | 6 | 0 | 0 |
| Cam Lewis | 7 | 4 | 0 | 1 |
| Terrel Bernard | 5 | 4 | 0 | 1 |
| Joey Bosa | 4 | 4 | 0 | 2 |
Poyer led the highlighted Buffalo defenders with eight tackles. Bishop and Lewis recorded seven each, while Bernard and Bosa contributed five and four respectively.
Bosa recorded two tackles for loss, making him a notable contributor in that category. Lewis and Bernard recorded one each.
However, Buffalo finished with zero sacks as a team. That contrasts with Miami’s three sacks and suggests the Bills were less successful at bringing down the opposing quarterback behind the line of scrimmage.
It would be too simplistic to say that a defense without sacks necessarily played poorly. Defenses can force incompletions, create interceptions, stop runs, and limit scoring without recording sacks. In this game, Buffalo did intercept two passes, an important defensive accomplishment. Nevertheless, the final score indicates that those plays were not enough to offset Miami’s offensive production.
Team Defensive Comparison
| Defensive category | Miami | Buffalo |
| Total tackles | 71 | 55 |
| Solo tackles | 47 | 32 |
| Sacks | 3 | 0 |
| Tackles for loss | 6 | 6 |
| Passes defended | 4 | 4 |
| Quarterback hits | 7 | 2 |
| Interceptions | 1 | 2 |
Miami recorded 16 more total tackles and five more quarterback hits. Both teams recorded six tackles for loss and four passes defended, while Buffalo finished with one more interception.
The interception total is a useful reminder that Miami did not win every defensive category. Buffalo’s defenders created two interceptions, compared with Miami’s one. The Dolphins’ advantage came from their broader performance, including pressure, rushing offense, and superior ball security.
Turnovers and Ball Security: A Crucial Difference
Turnovers often change the direction of an NFL game because they can end a promising drive and give the opponent another opportunity to score. The supplied statistics identify two lost fumbles by Buffalo and no lost fumbles by Miami.
Buffalo’s Two Lost Fumbles
Josh Allen lost one fumble, and James Cook III lost one. Together, those plays accounted for Buffalo’s two lost fumbles.
The distinction between a fumble and a lost fumble matters. A fumble occurs when a player loses possession of the ball, but the same team can recover it and retain possession. A lost fumble means the opposing team gains possession.
For Buffalo, losing possession twice reduced the number of opportunities to finish drives. Even a high-performing passing attack can struggle to win when it gives the opposition additional possessions or ends its own drives prematurely.
The available statistics do not provide enough information to attribute a specific number of Miami points directly to each fumble. It would therefore be inaccurate to claim that both turnovers resulted in touchdowns or that they alone decided the game.
Miami Protected the Football
Miami recorded zero team fumbles and zero fumbles lost.
That was a significant advantage in a contest where the Dolphins scored 30 points. The team avoided the specific problem that affected Buffalo’s ball security, allowing its offense to continue working without a lost fumble appearing in the statistical record.
The Dolphins did throw two interceptions, so their ball security was not flawless in every respect. Those interceptions must be considered alongside the fumbles rather than ignored.
The broader comparison is still favorable to Miami in the fumble category. Buffalo lost two fumbles, while Miami lost none.
Interceptions Tell a More Complicated Story
The defensive interception totals were two for Buffalo and one for Miami. Maxwell Hairston and Cole Bishop each recorded an interception for the Bills, while Ifeatu Melifonwu recorded one for the Dolphins.
These figures align with the quarterbacks’ interception totals: Tagovailoa threw two interceptions, while Allen threw one.
Interceptions show that Buffalo’s defense successfully disrupted Miami’s passing game. They also demonstrate why a single statistic cannot fully explain the result. Buffalo forced more interceptions, yet Miami still won by 17 points.
A useful evaluation therefore considers both sides of the ball. Miami’s running game, scoring production, and defensive pressure outweighed Buffalo’s advantages in passing yardage and interceptions.
Special Teams Statistics
Special teams did not produce the same statistical gap as the rushing game, but their contributions are still part of a complete match analysis.
Kicking Performance
| Kicker | Field goals | Extra points | Points recorded |
| Riley Patterson, Miami | 1/1 | 3/4 | 6 |
| Matt Prater, Buffalo | 0/0 | 1/1 | 1 |
Patterson converted his only field-goal attempt, a 46-yard kick, and made three of four extra points. His recorded kicking total was six points.
Prater did not attempt a field goal and converted his only extra-point attempt. He finished with one point.
The distinction between team points and kicking points is important. Miami scored 30 points overall, but Patterson was credited with six. The remaining scoring came through other offensive plays.
Patterson’s 46-yard field goal also demonstrates that Miami converted at least one scoring opportunity without needing a touchdown. However, the supplied statistics do not identify the precise sequence of every scoring drive, so no further drive-specific conclusion should be drawn from the kicking figures alone.
Punting Comparison
| Punter | Punts | Total yards | Average | Inside the 20 | Longest |
| Mitch Wishnowsky, Buffalo | 4 | 217 | 54.3 | 2 | 61 |
| Jake Bailey, Miami | 3 | 153 | 51.0 | 2 | 61 |
Wishnowsky averaged 54.3 yards per punt, compared with Bailey’s 51.0. Both recorded a longest punt of 61 yards and placed two punts inside the opponent’s 20-yard line.
Buffalo punted four times, while Miami punted three times. The totals suggest that both punters delivered effective distance, but the Bills had one additional punt.
Punting average does not measure every part of field-position value. The location of the kick, the return, and where the opposing offense begins its possession all matter. Based on the supplied figures, both punters produced similar longest kicks and identical inside-the-20 counts.
Kick and Punt Returns
Buffalo recorded four kick returns for 93 yards, averaging 23.3 yards per return. Ray Davis handled three of those returns for 74 yards, while Curtis Samuel returned one for 19 yards.
Miami recorded one kick return for 24 yards, handled by Malik Washington. On punt returns, Buffalo had one return for seven yards by Shakir, while Miami had one return for 13 yards by Washington.
These are relatively small samples. One return can change a team’s average considerably, so it would be unwise to draw broad conclusions about the long-term quality of either return unit from these numbers alone.
Still, the figures complete the statistical picture of the matchup. Miami’s clearest advantages were in rushing and defensive pressure, while the return numbers do not show a comparably large difference.
What the Statistics Reveal About Miami’s Victory
The result becomes easier to understand when the statistics are examined together rather than as isolated totals.
1. Miami’s Running Game Created a Major Advantage
Miami gained 197 rushing yards on 32 carries. Buffalo gained 87 yards on 22 carries.
The 110-yard difference gave the Dolphins an important source of offense that did not depend on accumulating passing yards. Achane was responsible for 174 rushing yards, making him the central figure in that advantage.
Miami also recorded two rushing touchdowns, while Buffalo had none. That scoring difference is more meaningful than rushing yardage alone because it directly contributed to the final margin.
2. Buffalo’s Passing Production Did Not Translate Into Enough Points
Allen threw for 306 yards and two touchdowns. Buffalo also recorded 28 receptions.
Those figures would normally be considered evidence of a productive passing performance. However, the Bills scored only 13 points overall.
The difference between yards and points can reflect several factors, including turnovers, failed scoring opportunities, penalties, and the effectiveness of the opposing defense. The supplied data supports the importance of turnovers and defensive pressure here, but it does not provide sufficient detail to assign the outcome to every possible factor.
3. Miami Generated More Quarterback Pressure
The Dolphins recorded three sacks and seven quarterback hits. Buffalo recorded zero sacks and two quarterback hits.
This difference matters because pressure can disrupt timing and make passing plays more difficult. Allen’s three sacks also resulted in 17 yards lost.
Sacks alone do not establish the full quality of a pass rush, but they offer a clear recorded measure of defensive success. Miami’s advantage in this category complemented its offensive production.
4. Ball Security Favored Miami in the Fumble Category
Buffalo lost two fumbles. Miami lost none.
Although Miami threw two interceptions, Buffalo’s lost fumbles created an additional problem for the Bills. These turnovers were part of a game in which Miami’s rushing attack was already generating substantial yardage and scoring.
A complete review should avoid claiming that turnovers alone explain the result. Rather, they were one of several factors that made it difficult for Buffalo to overcome Miami’s lead.
5. Miami Won Without Dominating Passing Yardage
The Dolphins passed for 173 yards, compared with Buffalo’s 306. They also threw one more interception.
Yet Miami won 30-13.
This is the clearest lesson from the box score: the team that gains more passing yards does not automatically win. Miami’s advantage on the ground, its two rushing touchdowns, its three sacks, and its clean fumble record helped offset Buffalo’s passing advantage.
How to Read NFL Player Statistics Correctly
For readers reviewing individual player numbers, a few distinctions can make the box score more useful.
Passing yards versus total offensive yards: Passing yards describe the quarterback’s passing production. They do not include a team’s rushing yards, so the passing totals should not be used as a complete measure of offensive production.
Rushing yards versus yards from scrimmage: Rushing yards come from running plays. Yards from scrimmage combine rushing and receiving yards. Achane’s 225 combined yards, for example, include 174 rushing yards and 51 receiving yards.
Passer rating versus QBR: These are different quarterback metrics. A passer rating of 98.5 and a QBR of 30.0 should not be treated as two versions of the same scale. Their methods and interpretations differ.
Receptions versus targets: A reception is a completed catch, while a target is a pass directed toward a player. Shakir’s seven receptions on nine targets show both his completed catches and the opportunities he received.
Tackles versus tackles for loss: Total tackles count recorded defensive stops, while tackles for loss identify tackles that stop a play behind the line of scrimmage. A high tackle count does not necessarily mean that every tackle had the same impact.
Turnovers versus scoring: An interception or lost fumble changes possession, but it does not automatically produce points. The subsequent drive still has to be evaluated separately.
These distinctions are useful when comparing players across games or assessing whether a player’s contribution was more substantial than a single headline statistic suggests.
Frequently Asked Questions
1. What was the final score of the Miami Dolphins vs Buffalo Bills game on November 9, 2025?
The Miami Dolphins defeated the Buffalo Bills 30-13. Miami scored 16 points in the first half and 14 in the fourth quarter, while Buffalo scored all 13 of its points in the fourth quarter.
2. Who was the leading rusher in the game?
De’Von Achane was the leading rusher with 174 yards and two touchdowns on 22 carries. He averaged 7.9 yards per carry and recorded a longest run of 59 yards.
3. How many passing yards did Josh Allen and Tua Tagovailoa record?
Josh Allen threw for 306 yards, completing 28 of 40 passes with two touchdowns and one interception. Tua Tagovailoa recorded 173 passing yards on 15 completions from 21 attempts, with two touchdowns and two interceptions.
4. Who led the game in receiving yards?
Jaylen Waddle led Miami with 84 receiving yards on five catches and scored one touchdown. Buffalo’s leading receiver by receptions was Khalil Shakir, who caught seven passes for 58 yards.
5. How many sacks did the Dolphins record against the Bills?
Miami recorded three sacks for the game, while Buffalo recorded none. Allen was sacked three times for a combined loss of 17 yards.
6. Which team had more rushing yards?
Miami finished with 197 rushing yards on 32 attempts, averaging 6.2 yards per carry. Buffalo recorded 87 rushing yards on 22 attempts, averaging 4.0 yards per carry. Miami also scored two rushing touchdowns, compared with none for Buffalo.
Conclusion
The miami dolphins vs buffalo bills match player stats show how Miami secured a 30-13 victory through an effective ground game, timely scoring, and defensive pressure. De’Von Achane delivered the standout performance with 174 rushing yards and two touchdowns, while Jaylen Waddle added 84 receiving yards and a touchdown. Together, their contributions helped Miami produce a balanced offensive performance despite recording fewer passing yards than Buffalo.
Josh Allen led the Bills with 306 passing yards and two touchdown passes, but Buffalo struggled to turn its passing production into enough points. The Bills recorded two lost fumbles, managed only 87 rushing yards, and failed to score a rushing touchdown. Miami, meanwhile, recorded three sacks and seven quarterback hits, adding pressure to an already challenging afternoon for Buffalo’s offense.
The numbers also reveal why a complete statistical analysis requires more than identifying the player with the most passing yards or the highest passer rating. Rushing efficiency, touchdowns, turnovers, quarterback pressure, and receiving contributions all help explain how a game unfolds.
Ultimately, Miami’s 110-yard advantage in rushing production, Achane’s explosive performance, and the Dolphins’ ability to avoid lost fumbles were central features of the final statistical picture. Buffalo’s passing numbers remained impressive, but Miami was more effective at turning its overall performance into a decisive result.