Brooklyn Nets vs Lakers Match Player Stats
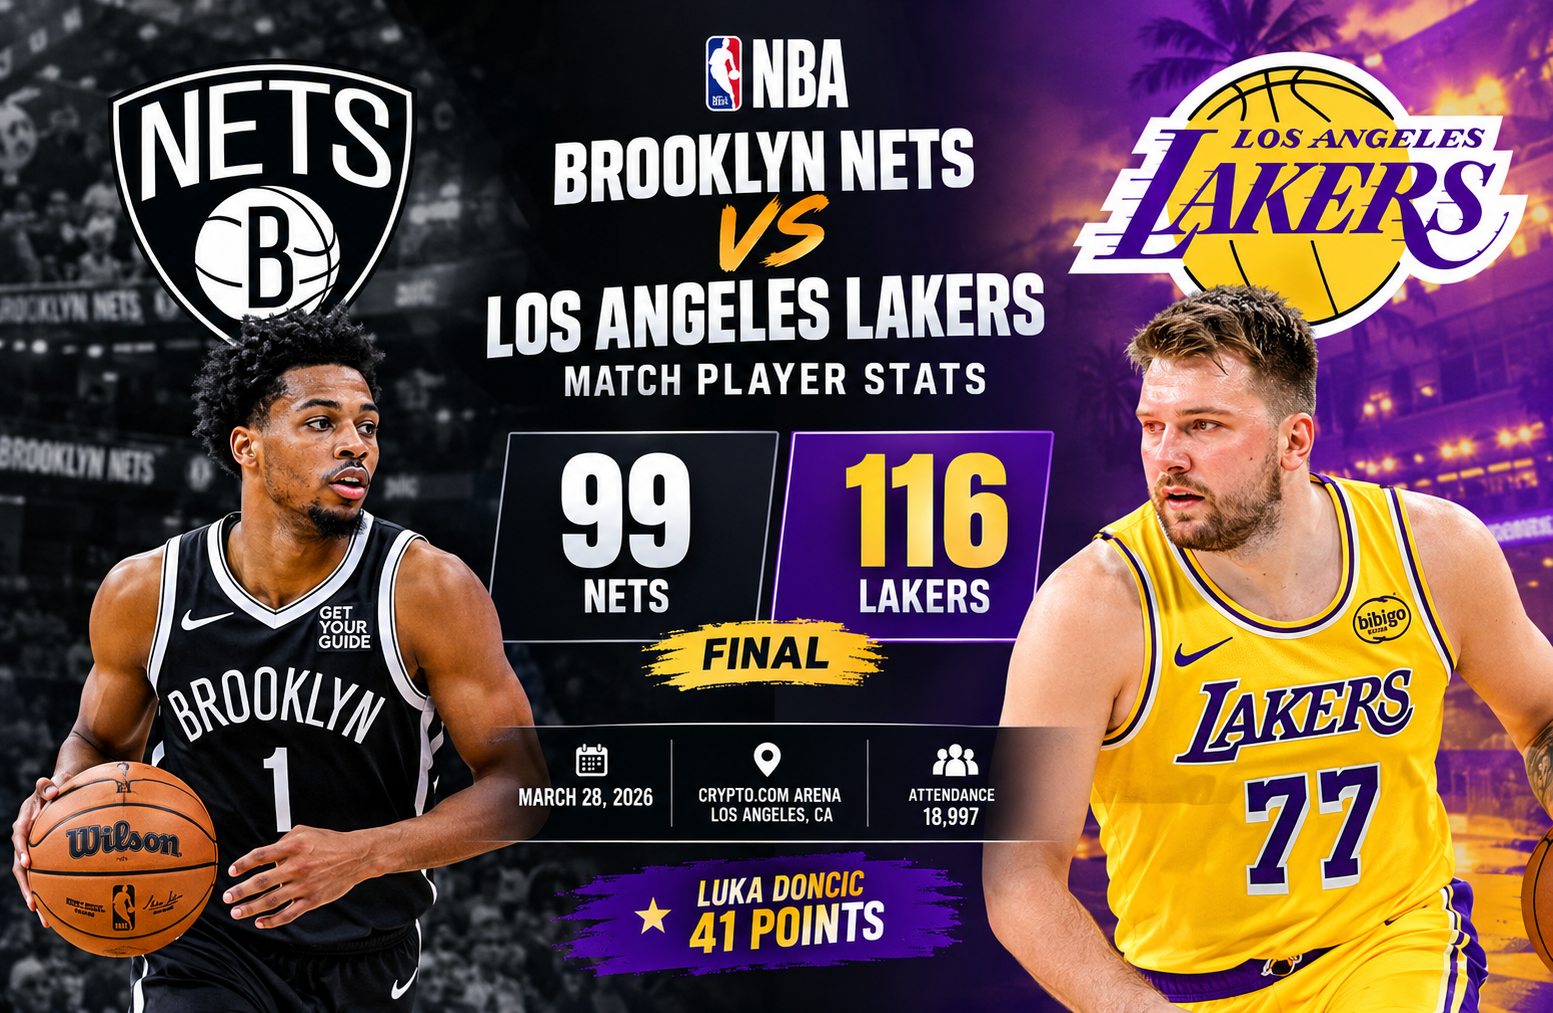
The Brooklyn Nets vs Lakers match player stats from March 28, 2026, tell a clear story: Los Angeles controlled the game through efficient shooting, strong rebounding, and a dominant scoring performance from Luka Doncic. The Lakers defeated Brooklyn 116-99 at crypto.com Arena in front of 18,997 fans, completing a 2-0 season sweep of the Nets.
This matchup is especially useful for readers who want more than the final score. The box score shows how each team’s leading players contributed, where the game changed, and why the Lakers created separation despite Brooklyn producing competitive stretches in the first three quarters.
Brooklyn Nets vs Lakers Match Player Stats: Game Overview
The Lakers entered the game with a 48-26 record and a 24-12 home mark. Brooklyn arrived at 17-57 overall and 8-31 on the road.
Los Angeles eventually won by 17 points, but the game was not simply decided in the opening minutes. Brooklyn scored 30 points in the first quarter and 29 in the second, keeping its offense active for much of the first half.
The decisive difference came from Los Angeles’ efficiency and fourth-quarter execution.
| Category | Brooklyn Nets | Los Angeles Lakers |
| Final Score | 99 | 116 |
| Q1 | 30 | 35 |
| Q2 | 29 | 26 |
| Q3 | 25 | 24 |
| Q4 | 15 | 31 |
| Field Goals | 40-96 | 38-70 |
| FG Percentage | 42% | 54% |
| 3-Pointers | 10-39 | 11-25 |
| 3PT Percentage | 26% | 44% |
| Free Throws | 9-15 | 29-42 |
| Rebounds | 39 | 48 |
| Assists | 24 | 18 |
| Turnovers | 14 | 13 |
| Steals | 11 | 9 |
| Blocks | 2 | 9 |
| Offensive Rebounds | 12 | 6 |
| Defensive Rebounds | 27 | 42 |
| Fouls | 28 | 16 |
The biggest statistical contrast is shooting volume versus shooting efficiency. Brooklyn attempted 26 more field goals than Los Angeles, but the Lakers converted at a much higher rate.
That distinction matters when interpreting a box score. More attempts do not automatically mean better offensive performance.
Luka Doncic Leads the Lakers With 41 Points
Luka Doncic was the standout scorer in the game, finishing with 41 points.
His scoring output was the most important individual number in the Lakers’ offensive profile. Austin Reaves added 26 points, giving Los Angeles two major scoring contributors.
Doncic also collected 8 rebounds, matching Reaves for the Lakers’ team lead in that category according to the supplied game data.
The combination of scoring and rebounding made Doncic’s performance more significant than simply looking at his point total. His 41 points accounted for more than one third of Los Angeles’ 116 points.
Austin Reaves Adds 26 Points
Austin Reaves finished as the Lakers’ second-highest scorer with 26 points.
His production gave Los Angeles another reliable scoring option and reduced the burden on Doncic. When one player scores 41 points and another contributes 26, the opposing defense has to deal with two major offensive threats rather than focusing exclusively on one scorer.
Reaves also finished with 8 rebounds, tying Doncic for the Lakers’ highest individual rebounding total in the supplied statistics.
LeBron James Controls the Passing Game
LeBron James led the Lakers with 8 assists.
Although his listed rebounding total was 6, his playmaking contribution stands out when examining how Los Angeles generated offense.
The Lakers recorded 18 assists overall, meaning James was directly responsible for a substantial share of the team’s recorded assists.
This is an important distinction when reading player statistics. A player does not need to lead a team in points to have a major influence on offensive production.
Brooklyn’s Leading Scorers
Brooklyn’s scoring was more evenly distributed.
Jalen Wilson led the Nets with 18 points.
Ziaire Williams and Nic Claxton each added 16 points, giving Brooklyn three players who reached double figures at the top of the supplied scoring data.
That production was not enough to match Los Angeles‘ scoring efficiency.
Nic Claxton Provides Interior Production
Nic Claxton finished with 16 points and led Brooklyn in rebounds with 7.
His contribution was particularly relevant because the Nets had 12 offensive rebounds overall. Brooklyn generated second-chance opportunities, but the Lakers were much stronger on the defensive glass, collecting 42 defensive rebounds.
That contrast helped Los Angeles prevent Brooklyn from turning its offensive rebounding into sustained scoring pressure.
Nolan Traore Leads Brooklyn in Assists
Nolan Traore recorded 7 assists, the most among Nets players in the supplied data.
Brooklyn finished with 24 assists overall, four more than Los Angeles despite losing the game by 17 points.
This is a useful reminder that assists alone do not explain offensive success. Brooklyn moved the ball effectively enough to produce 24 assists, but its 42% field-goal shooting and 26% three-point shooting limited the value of those possessions.
Why the Lakers Won
The Brooklyn Nets vs Lakers match player stats show several reasons for the final result.
1. Los Angeles Shot Much More Efficiently
The Lakers made 38 of 70 field-goal attempts.
That translates to a 54% field-goal rate.
Brooklyn made 40 of 96 attempts for 42%.
Interestingly, Brooklyn actually made two more field goals. The difference was efficiency.
Los Angeles needed 70 attempts to make 38 baskets, while Brooklyn needed 96 attempts to make 40.
This is one of the clearest examples of why box-score analysis should go beyond counting made shots.
2. Three-Point Shooting Favored Los Angeles
The Lakers made 11 of 25 three-point attempts, or 44%.
Brooklyn made 10 of 39, or 26%.
The teams therefore made almost the same number of three-pointers, but Los Angeles required considerably fewer attempts.
Brooklyn’s 39 three-point attempts represented a major portion of its overall field-goal attempts. When those outside shots were not falling efficiently, the extra volume could not compensate for the lower conversion rate.
3. Free Throws Created Another Gap
Los Angeles attempted 42 free throws and made 29.
Brooklyn attempted only 15 and made 9.
That gave the Lakers 20 more free-throw attempts.
The Lakers converted 69% of their free throws, while Brooklyn converted 60%.
Free throws therefore provided Los Angeles with another meaningful source of points.
4. The Lakers Dominated the Glass
Los Angeles won the rebounding battle 48-39.
The difference was particularly notable on the defensive end.
The Lakers recorded 42 defensive rebounds compared with Brooklyn’s 27.
That helped Los Angeles finish possessions and limited Brooklyn’s ability to repeatedly attack after missed shots.
Brooklyn did have an advantage in offensive rebounds, 12-6, but the Lakers’ defensive rebounding advantage was considerably larger.
5. Blocks Were Heavily in Los Angeles’ Favor
The Lakers recorded 9 blocks.
Brooklyn recorded only 2.
That seven-block difference indicates a major disparity in rim protection during this particular matchup.
It also helps explain why raw field-goal attempts need context. Brooklyn attempted 96 shots, but Los Angeles still managed to protect the basket effectively enough to finish with nine blocks.
The Fourth Quarter Changed the Game
The fourth quarter is arguably the most important part of this matchup when looking at the scoring sequence.
The Lakers scored 31 points in the final period.
Brooklyn scored only 15.
That created a 16-point fourth-quarter difference.
Los Angeles entered the fourth quarter with a relatively narrow scoring advantage based on the supplied quarter totals:
- Lakers: 35 + 26 + 24 = 85
- Nets: 30 + 29 + 25 = 84
So after three quarters, Los Angeles led by only one point.
That means the 17-point final margin was almost entirely created during the fourth quarter.
This is one of the most important insights in the Brooklyn Nets vs Lakers match player stats. The final score alone makes the game look consistently one-sided. The quarter-by-quarter numbers tell a different story.
Brooklyn was competitive through three quarters before Los Angeles produced a decisive closing period.
A One-Point Game After Three Quarters
The scoring sequence deserves special attention.
First Quarter
Los Angeles opened with 35 points compared with Brooklyn’s 30.
Lakers advantage: 5 points
Second Quarter
Brooklyn responded with 29 points while Los Angeles scored 26.
Nets advantage: 3 points
Halftime score:
Lakers 61, Nets 59
Third Quarter
Brooklyn scored 25.
Los Angeles scored 24.
Brooklyn gained another point in the period.
After three quarters:
Lakers 85, Nets 84
Fourth Quarter
Los Angeles exploded for 31 points.
Brooklyn managed only 15.
Final:
Lakers 116, Nets 99
This progression shows exactly where the game separated.
Efficiency Versus Volume
One of the most useful lessons from this box score is the difference between offensive volume and offensive efficiency.
Brooklyn attempted:
- 96 field goals
- 39 three-pointers
- 15 free throws
Los Angeles attempted:
- 70 field goals
- 25 three-pointers
- 42 free throws
Brooklyn had substantially more field-goal attempts, but Los Angeles produced a much higher shooting percentage.
The Lakers’ 54% field-goal rate compared with Brooklyn’s 42% represents a 12-percentage-point gap.
That is enormous over a full NBA game.
The numbers suggest that Los Angeles generated more efficient scoring opportunities while Brooklyn relied more heavily on shot volume.
Turnovers Were Not the Main Difference
Turnovers were relatively close.
Brooklyn committed 14 turnovers.
Los Angeles committed 13.
That is only a one-turnover difference.
The Lakers’ victory therefore cannot be explained primarily by forcing Brooklyn into significantly more turnovers.
Instead, shooting, free throws, rebounding, and rim protection were much more prominent statistical differences.
Brooklyn did record 11 steals compared with Los Angeles’ 9, so the Nets were active defensively in generating takeaways.
But those defensive plays did not translate into enough efficient offense.
Assists Tell an Interesting Story
Brooklyn recorded 24 assists.
Los Angeles recorded 18.
At first glance, this may appear surprising because the Lakers won comfortably.
But team assists are not equivalent to offensive efficiency.
Brooklyn’s 24 assists demonstrate that the Nets were capable of creating assisted baskets. However, the team made only 40 of 96 field-goal attempts.
Los Angeles made 38 of 70.
The Lakers therefore needed far fewer attempts to reach almost the same number of made field goals.
This is why assists should be analyzed alongside shooting percentage, free throws, rebounds, and turnovers rather than treated as an isolated measure.
Comparing the Main Player Contributions
The most important individual performances from the supplied data can be summarized as follows:
| Player | Team | Key Contribution |
| Luka Doncic | Lakers | 41 points, 8 rebounds |
| Austin Reaves | Lakers | 26 points, 8 rebounds |
| LeBron James | Lakers | 8 assists, 6 rebounds |
| Nic Claxton | Nets | 16 points, 7 rebounds |
| Jalen Wilson | Nets | 18 points |
| Ziaire Williams | Nets | 16 points |
| Nolan Traore | Nets | 7 assists |
These figures show contrasting team structures.
Los Angeles had two high-scoring players at the top of its scoring sheet, while James supplied major playmaking.
Brooklyn’s leading scoring totals were lower, although Traore’s seven assists and Claxton’s seven rebounds provided important supporting production.
What the Rebounding Numbers Reveal
Rebounding can sometimes be overlooked when the leading scorer dominates headlines.
That would be a mistake in this matchup.
The Lakers collected 48 total rebounds compared with 39 for Brooklyn.
The defensive-rebounding split was even more pronounced:
Lakers: 42
Nets: 27
This meant Los Angeles secured 15 more defensive rebounds.
Brooklyn’s 12 offensive rebounds show that the Nets did create extra possessions at times. However, Los Angeles’ ability to secure missed Brooklyn shots prevented those second chances from becoming a consistent source of offense.
The Role of Free Throws
The free-throw numbers are another major part of the game.
Los Angeles attempted 42 free throws.
Brooklyn attempted 15.
That 27-attempt difference is substantial.
The Lakers made 29 free throws, compared with nine for Brooklyn.
As a result, Los Angeles scored 20 more points from the free-throw line.
The difference does not automatically identify why every foul occurred, because a box score does not provide the full context of every possession. But statistically, free throws were one of the largest scoring gaps between the teams.
Lakers Defense Beyond Rebounding
Los Angeles’ defensive performance had multiple layers.
The team recorded:
- 9 blocks
- 9 steals
- 42 defensive rebounds
Brooklyn recorded:
- 2 blocks
- 11 steals
- 27 defensive rebounds
The Nets actually had two more steals.
Yet the Lakers produced seven more blocks and 15 more defensive rebounds.
That combination suggests the Lakers’ defensive impact was not dependent on steals alone.
They were also protecting the rim and ending possessions with defensive rebounds.
Season Series: Lakers Go 2-0
The March 28 meeting was the second Lakers-Nets matchup of the 2025-26 season based on the supplied information.
The Lakers won both games.
February 4, 2026
Lakers 125, Nets 109
March 28, 2026
Lakers 116, Nets 99
The second meeting therefore produced another Lakers victory, although with a lower combined scoring total.
The two results also show a 17-point difference in the March matchup compared with a 16-point difference in February.
For readers comparing both games, it is useful to treat each box score separately because player roles, shooting efficiency, and game flow can change from one meeting to another.
What the Box Score Says About Brooklyn
Brooklyn’s statistics reveal a team that competed offensively for three quarters but struggled to sustain that production late.
The Nets:
- Scored at least 25 points in each of the first three quarters.
- Recorded 24 assists.
- Collected 12 offensive rebounds.
- Produced 11 steals.
- Attempted 39 three-pointers.
Those numbers show activity and offensive volume.
The major weakness in this particular game was conversion.
A 42% field-goal percentage and 26% three-point percentage made it difficult to maintain scoring pressure against a Lakers team shooting 54% overall and 44% from three.
The fourth-quarter collapse then turned a one-point game after three periods into a 17-point final defeat.
What the Box Score Says About Los Angeles
The Lakers’ statistical profile was built around efficiency and finishing.
Los Angeles:
- Shot 54% from the field.
- Shot 44% from three-point range.
- Made 29 free throws.
- Won the rebounding battle by nine.
- Recorded nine blocks.
- Scored 31 fourth-quarter points.
- Held Brooklyn to 15 fourth-quarter points.
The most important feature is that several advantages reinforced each other.
Better shooting generated efficient scoring.
Free throws added points.
Defensive rebounds ended possessions.
Blocks protected the rim.
And the fourth-quarter offense converted those advantages into separation.
Brooklyn Nets vs Lakers Match Player Stats: Key Takeaways
The Brooklyn Nets vs Lakers match player stats provide several useful conclusions for anyone studying the game.
Luka Doncic was the scoring centerpiece
His 41 points made him the clear leading scorer for Los Angeles.
Austin Reaves supplied major secondary scoring
His 26 points gave the Lakers another high-level scoring contributor.
LeBron James led the Lakers in assists
His 8 assists highlighted his role as a primary playmaker.
Brooklyn’s scoring was more distributed
Jalen Wilson led the Nets with 18, followed by Williams and Claxton with 16 each.
Shooting efficiency favored Los Angeles
The Lakers shot 54% overall and 44% from three, compared with Brooklyn’s 42% and 26%.
The fourth quarter decided the contest
The Lakers outscored Brooklyn 31-15 after the teams were separated by just one point through three quarters.
Rebounding favored Los Angeles
The Lakers won 48-39 overall and held a major 42-27 advantage on the defensive glass.
Free throws created a major scoring gap
Los Angeles attempted 42 free throws compared with 15 for Brooklyn.
How to Read This Game Without Overlooking the Details
A common mistake in sports analysis is to look only at the final score and leading scorer.
That approach misses the structure of the game.
A better process is to examine five layers:
- Score progression: Determine when the separation occurred.
- Shooting efficiency: Compare field-goal and three-point percentages.
- Possession factors: Examine turnovers and offensive rebounds.
- Second-chance prevention: Look at defensive rebounds.
- Individual roles: Identify scoring, rebounding, and playmaking leaders.
Using that method, this game becomes much easier to understand.
The final score says Los Angeles won by 17.
The quarter scores explain that the game was essentially even after three periods.
The shooting numbers explain why Los Angeles was more efficient.
The rebounding numbers explain how the Lakers controlled missed-shot possessions.
The free-throw numbers explain another major scoring advantage.
The player statistics then show which individuals drove those team outcomes.
Author’s Analytical Perspective
When evaluating a basketball box score, I find the most useful approach is to separate production from efficiency.
A player scoring 20 points on a large number of attempts tells a different story from a player scoring 20 points efficiently. The same principle applies to teams.
That is why the field-goal attempt gap in this game deserves attention.
Brooklyn attempted 96 field goals, 26 more than Los Angeles, yet the Lakers made 38 shots compared with Brooklyn’s 40. The difference was not the number of made field goals. It was how many attempts each team needed to produce them.
The quarter-by-quarter data adds another important layer. At 85-84 after three quarters, this was not a game in which Los Angeles simply dominated from start to finish. The decisive statistical event was the fourth-quarter scoring split.
That is the kind of context that can disappear when a reader looks only at a final score.
Data Accuracy and Scope
The statistics used throughout this article are based on the game data supplied for the March 28, 2026 matchup.
The supplied information identifies:
- Game date: March 28, 2026
- Venue: crypto.com Arena, Los Angeles
- Attendance: 18,997
- Final score: Lakers 116, Nets 99
- Season series: Lakers 2-0
- Previous meeting: Lakers 125, Nets 109
- Officials: Sean Wright, Brian Forte, and JD Ralls
- Listed broadcast: Spectrum Sports Net +3
Where individual statistics were not provided in the supplied data, they have not been invented or estimated.
For broader NBA statistical context, readers can consult NBA.com as an authoritative league source.
Frequently Asked Questions
Who scored the most points in the Nets vs Lakers game?
Luka Doncic led all listed scorers with 41 points for the Lakers.
What was the final score between the Brooklyn Nets and Lakers?
The Lakers defeated the Nets 116-99 on March 28, 2026.
Who led the Nets in scoring?
Jalen Wilson led Brooklyn with 18 points.
Who led the Lakers in assists?
LeBron James led Los Angeles with 8 assists.
Who led the Nets in rebounds?
Nic Claxton led Brooklyn with 7 rebounds.
Did the Lakers sweep the Nets during the season series?
Yes. Based on the supplied data, Los Angeles won both meetings, including a 125-109 victory on February 4 and a 116-99 victory on March 28, 2026.
Conclusion
The March 28, 2026 matchup between Brooklyn and Los Angeles was decided less by a single statistic than by the interaction of several advantages.
Luka Doncic’s 41 points provided the headline performance, while Austin Reaves added 26 and LeBron James contributed 8 assists. Brooklyn received 18 points from Jalen Wilson, 16 each from Ziaire Williams and Nic Claxton, and seven assists from Nolan Traore.
The team numbers explain the final result even more clearly.
Los Angeles shot 54% from the field and 44% from three-point range. The Lakers also won the rebounding battle 48-39, recorded nine blocks, and attempted 42 free throws.
Most importantly, the game was still extremely close after three quarters. The Lakers led 85-84 before scoring 31 points in the fourth quarter while holding Brooklyn to 15.
That final period transformed a one-point game into a 17-point Lakers victory and completed Los Angeles‘ 2-0 season sweep of Brooklyn.