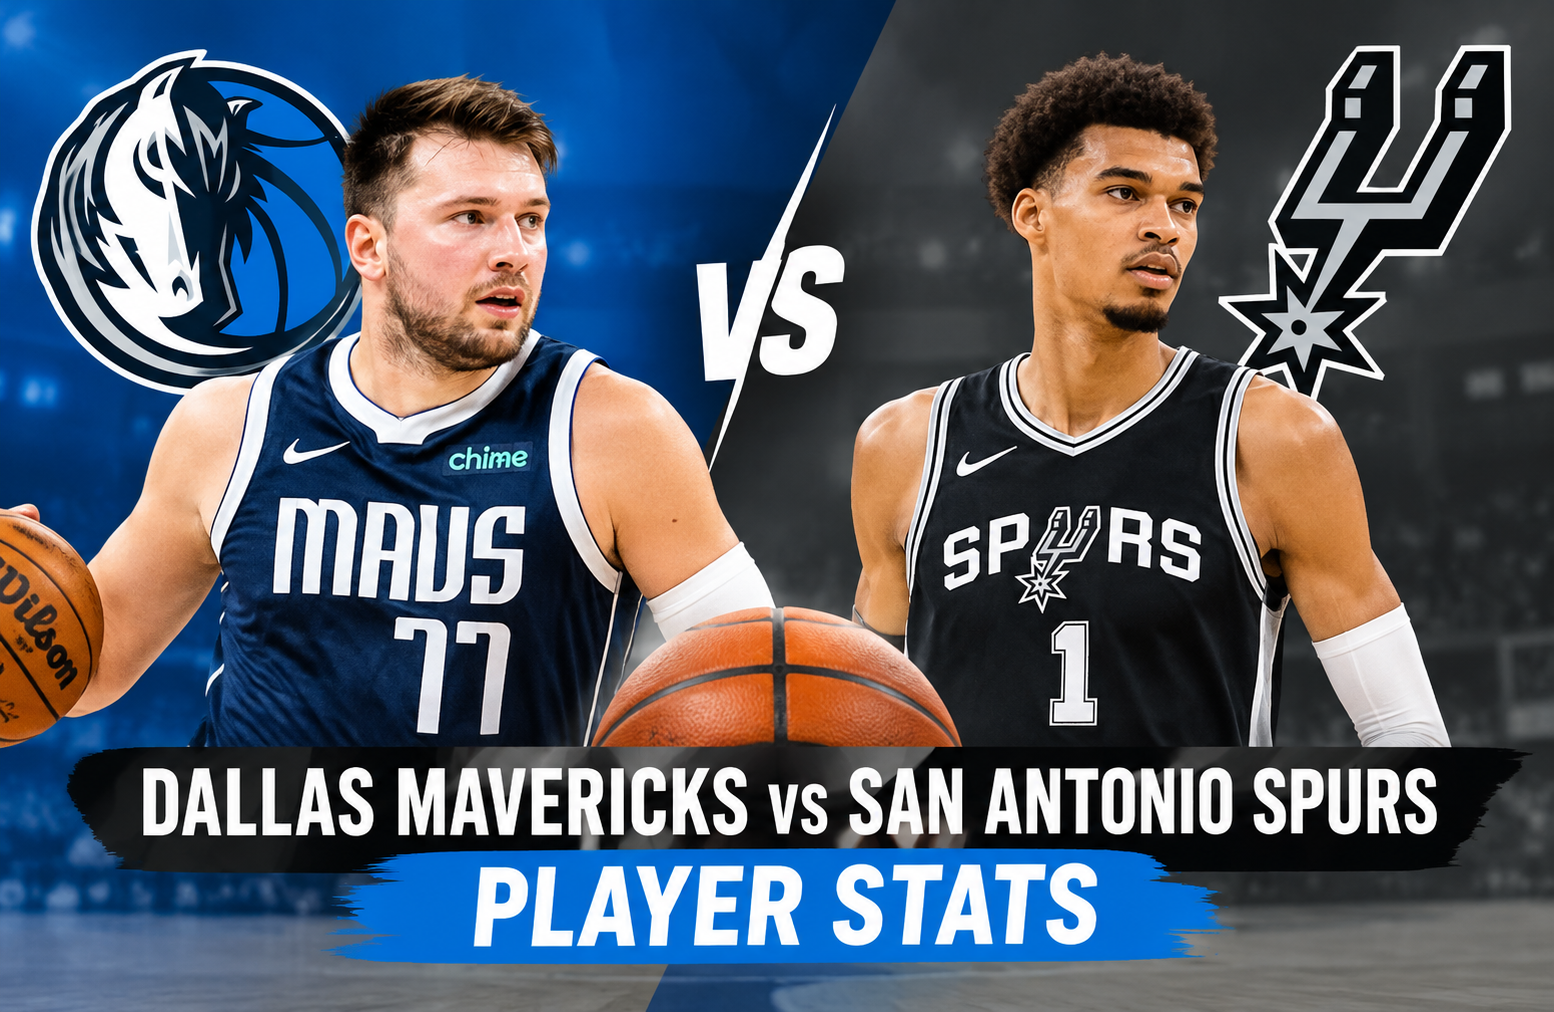
Dallas Mavericks vs San Antonio Spurs Match Player Stats
The Dallas Mavericks vs San Antonio Spurs match player stats from February 7, 2026, tell a much deeper story than the 138-125 final score. San Antonio produced one of its most explosive offensive performances of the season at Frost Bank Center, while Stephon Castle delivered a career-high 40-point triple-double to lead the Spurs past Dallas. The final score was San Antonio 138, Dallas 125, with the Spurs improving to 36-16 and the Mavericks falling to 19-33.
For readers looking for the complete player-by-player picture, this game is particularly interesting because the box score shows several different stories at once. Castle dominated the headline numbers with 40 points, 12 rebounds, and 12 assists. Victor Wembanyama contributed 16 points, 11 rebounds, and 3 blocks, while Devin Vassell scored 17 points. On the Dallas side, Klay Thompson finished with 19 points, Brandon Williams scored 18, and Marvin Bagley III had an immediate impact with 16 points and 12 rebounds in his Dallas debut.
The team statistics also explain why the Spurs won despite committing more turnovers. San Antonio shot 55 of 99 from the field for 56%, compared with Dallas shooting 46 of 105 for 43.8%. The Spurs also held a 52-41 rebounding advantage and blocked 11 shots compared with four for Dallas. Dallas, however, protected the ball extremely well, committing only seven turnovers compared with San Antonio’s 16.
Dallas Mavericks vs San Antonio Spurs Match Player Stats at a Glance
The game was played at Frost Bank Center in San Antonio in front of 18,617 spectators. San Antonio led from the first half and built a maximum advantage of 28 points before Dallas reduced the margin in the fourth quarter.
| Category | Dallas Mavericks | San Antonio Spurs |
| Final Score | 125 | 138 |
| Record After Game | 19-33 | 36-16 |
| First Quarter | 32 | 39 |
| Second Quarter | 35 | 42 |
| Third Quarter | 24 | 33 |
| Fourth Quarter | 34 | 24 |
| Field Goals | 46-105 | 55-99 |
| Field Goal % | 43.8% | 55.6% |
| Three-Pointers | 15-37 | 14-35 |
| Three-Point % | 40.5% | 40.0% |
| Free Throws | 18-24 | 14-20 |
| Free Throw % | 75.0% | 70.0% |
| Rebounds | 41 | 52 |
| Assists | 35 | 34 |
| Turnovers | 7 | 16 |
| Steals | 10 | 5 |
| Blocks | 4 | 11 |
The numbers show a clear contrast. Dallas was more careful with the ball and created 35 assists while turning it over only seven times. San Antonio was much more efficient from the field and generated a substantial advantage around the basket. The Spurs scored 74 points in the paint, compared with 50 for Dallas.
That combination mattered more than the turnover difference.
Stephon Castle Leads San Antonio With a 40-Point Triple-Double
The defining performance of the night belonged to Stephon Castle.
Castle finished with:
- 40 points
- 12 rebounds
- 12 assists
- 15-of-19 shooting
- 3-of-5 from three-point range
- 7-of-10 from the free-throw line
- 3 steals
- 1 block
- 6 turnovers
- +30 plus/minus
The 40 points were a career high, and the performance produced Castle’s second career triple-double. NBA’s official game coverage described the performance as a 40-12-12 triple-double. The Associated Press also noted that Castle became only the second player in Spurs franchise history to record a 40-point triple-double, joining Hall of Famer David Robinson.
What makes Castle’s line especially impressive is the efficiency behind it.
He attempted 19 field goals and made 15. That is a field-goal percentage of 78.9%. He also made three of his five three-point attempts and seven of his ten free throws.
This was not a case of a player accumulating 40 points through an unusually high number of possessions. Castle combined volume with extraordinary shooting efficiency.
His 12 assists also changed the way Dallas had to defend him. A defense cannot simply focus on stopping a high-scoring guard when that guard is simultaneously creating opportunities for teammates.
Castle’s rebounding contribution was another important part of the performance. He tied Wembanyama for the team lead with 12 rebounds, giving him a complete statistical profile rather than a scoring-only performance.
The six turnovers are worth noting. They prevented the performance from being completely clean from an efficiency standpoint. However, his scoring, rebounding, passing, steals, and overall influence still made him the central figure in the game.
Victor Wembanyama Provides the Interior Presence
Victor Wembanyama finished with 16 points, 11 rebounds, 1 assist, and 3 blocks in 27 minutes.
His scoring total was not close to Castle’s 40, but his defensive influence was important.
Wembanyama shot 6 of 14 from the field and 1 of 6 from three. He also made 3 of 4 free throws. More importantly for San Antonio, he collected 11 rebounds and recorded three blocks.
The Spurs’ 11 total blocks compared with Dallas’ four illustrates how much defensive length affected the game.
San Antonio’s interior defense helped create a difficult environment for Dallas scorers. The Mavericks made only 46 of 105 field-goal attempts overall. Their 43.8% shooting was substantially below San Antonio’s 55.6%.
Wembanyama’s presence does not have to appear as a huge scoring total to influence a box score. A seven-foot-plus defender who can challenge shots changes the decisions opponents make before a shot is even attempted.
That defensive effect becomes especially relevant when examining Dallas’ offensive efficiency.
Klay Thompson Leads Dallas in Scoring
Klay Thompson was Dallas’ leading scorer with 19 points.
He shot:
- 6-of-14 from the field
- 4-of-10 from three
- 3-of-3 from the free-throw line
- 1 rebound
- 2 assists
- 2 steals
- 2 turnovers
Thompson’s four made three-pointers were tied for the highest total by a Dallas player in the game. His 40% three-point shooting was also exactly in line with the Mavericks’ overall three-point percentage of 40.5%.
His plus/minus was +9, which is notable because Dallas lost the game by 13 points.
That number should not be treated as a complete measure of individual performance, but it does show that the Mavericks had stretches in which Thompson’s minutes coincided with competitive possessions.
Dallas ultimately needed more scoring efficiency across the lineup. Thompson was one of the team’s primary perimeter scoring options, but no Maverick reached 20 points.
That was a major contrast with San Antonio, where Castle alone scored 40.
Brandon Williams Provides Efficient Scoring
Brandon Williams scored 18 points for Dallas and was one of the team’s most efficient offensive players.
He finished 8-of-12 from the field, including 2-of-2 from three-point range. That gave him a 66.7% field-goal percentage and 100% shooting from beyond the arc.
Williams also added:
- 3 rebounds
- 4 assists
- 1 steal
- 1 turnover
His +/− was -10.
The efficiency stands out because Dallas struggled to convert shots as a team. Williams was one of the exceptions.
His 18 points on 12 field-goal attempts meant he generated considerable production without requiring a large share of the team’s shot attempts.
This is one reason a box score should be read beyond the leading scorer column. Castle obviously dominated the scoring category, but Williams’ shooting efficiency was one of the more interesting Dallas-specific details.
Marvin Bagley III Makes an Immediate Impact
Marvin Bagley III had one of the more noteworthy individual performances for Dallas despite coming off the bench.
He recorded:
- 16 points
- 12 rebounds
- 2 assists
- 1 steal
- 4 blocks
- 6-of-14 field goals
- 1-of-1 from three
- 3-of-7 free throws
The 12 rebounds tied Castle and Wembanyama for the highest individual rebound total among players in the game.
Bagley’s debut was particularly noticeable because he made an impact quickly. The Associated Press reported that he scored eight points in his first five minutes, including two dunks, and also blocked shots by Devin Vassell and Harrison Barnes.
His four blocks were also the most by any Dallas player.
Bagley’s -19 plus/minus reflects the team’s overall struggles during his minutes, but that number should be considered alongside his individual production. He provided Dallas with rebounding, interior finishing, and shot blocking.
For someone evaluating the player statistics rather than simply the result, Bagley’s debut is one of the most useful parts of the box score to examine.
Tyus Jones Was Dallas’ Assist Leader
One correction is important when discussing the supplied statistics.
Brandon Williams did not lead Dallas in assists.
Tyus Jones led the Mavericks with 7 assists.
Jones played 17 minutes and recorded:
- 4 points
- 2-of-4 field goals
- 7 assists
- 0 turnovers
- 0 rebounds
- 0 steals
- 0 blocks
His seven assists without a turnover were particularly efficient from a ball-distribution standpoint.
This is an excellent example of why complete box-score verification matters. A player can have a modest scoring line while still making a meaningful contribution as a facilitator.
Jones’ assist-to-turnover performance was especially clean. Dallas as a team finished with only seven turnovers, and Jones did not contribute any to that total.
Cooper Flagg’s Numbers
Cooper Flagg finished with 14 points, four rebounds, four assists, and two turnovers.
His shooting line was:
- 5-of-12 from the field
- 2-of-3 from three
- 2-of-2 from the free-throw line
That translated to 41.7% shooting from the field and 66.7% from three.
Flagg also finished with a team-low -31 plus/minus among Dallas players with substantial minutes.
Again, plus/minus needs context. It does not mean every possession during his minutes was individually poor, nor does it isolate his performance from the five-man lineup and opposing lineup combinations.
Still, the -31 is a useful indicator of how difficult the game became for Dallas during those stretches.
San Antonio’s Supporting Scorers
Castle’s 40 points understandably dominated the headlines, but San Antonio had several other contributors.
Devin Vassell scored 17 points on 7-of-15 shooting. He also had four rebounds and six assists.
Wembanyama added 16 points and 11 rebounds.
De’Aaron Fox scored 15 points and recorded five assists, while Carter Bryant added 11 points.
Dylan Harper also finished with 11 points, five assists, and four rebounds in 23 minutes.
Harrison Barnes contributed nine points, including three made three-pointers on five attempts. Keldon Johnson scored eight points.
This distribution mattered because Dallas could not simply eliminate Castle and expect the rest of San Antonio’s offense to disappear.
The Spurs had several players capable of turning individual advantages into points.
Full Dallas Player Statistics
Here is the detailed Dallas statistical picture from the official box score.
| Player | MIN | PTS | FG | 3PT | REB | AST | STL | BLK | TO | +/- |
| Klay Thompson | 19 | 19 | 6-14 | 4-10 | 1 | 2 | 2 | 0 | 2 | +9 |
| Brandon Williams | 24 | 18 | 8-12 | 2-2 | 3 | 4 | 1 | 0 | 1 | -10 |
| Tyus Jones | 17 | 4 | 2-4 | 0-2 | 0 | 7 | 0 | 0 | 0 | +18 |
| Marvin Bagley III | 24 | 16 | 6-14 | 1-1 | 12 | 2 | 1 | 4 | 0 | -19 |
| Cooper Flagg | 26 | 14 | 5-12 | 2-3 | 4 | 4 | 0 | 0 | 2 | -31 |
| Caleb Martin | 24 | 11 | 5-10 | 1-2 | 5 | 2 | 0 | 0 | 1 | +1 |
| Max Christie | 27 | 17 | 6-11 | 3-7 | 3 | 3 | 1 | 0 | 0 | -23 |
| Naji Marshall | 25 | 6 | 1-8 | 0-2 | 3 | 5 | 3 | 0 | 1 | -8 |
| P.J. Washington | 23 | 10 | 4-10 | 2-5 | 5 | 3 | 1 | 0 | 0 | -10 |
| Daniel Gafford | 18 | 9 | 3-5 | 0-0 | 4 | 2 | 0 | 0 | 0 | 0 |
| Dwight Powell | 5 | 1 | 0-1 | 0-1 | 1 | 0 | 1 | 0 | 0 | +4 |
| A.J. Johnson | 7 | 0 | 0-4 | 0-2 | 0 | 1 | 0 | 0 | 0 | +4 |
The official team total was 125 points on 46-of-105 shooting, 15-of-37 from three, and 18-of-24 from the free-throw line.
Full San Antonio Player Statistics
San Antonio’s complete player production shows why the Spurs were able to sustain their offensive advantage.
| Player | MIN | PTS | FG | 3PT | REB | AST | STL | BLK | TO | +/- |
| Stephon Castle | 32 | 40 | 15-19 | 3-5 | 12 | 12 | 3 | 1 | 6 | +30 |
| Devin Vassell | 30 | 17 | 7-15 | 1-4 | 4 | 6 | 0 | 1 | 1 | +31 |
| Victor Wembanyama | 27 | 16 | 6-14 | 1-6 | 11 | 1 | 0 | 3 | 0 | +3 |
| De’Aaron Fox | 26 | 15 | 7-13 | 1-4 | 2 | 5 | 0 | 0 | 3 | +11 |
| Carter Bryant | 17 | 11 | 4-11 | 3-7 | 5 | 0 | 0 | 3 | 0 | +6 |
| Dylan Harper | 23 | 11 | 5-8 | 1-1 | 4 | 5 | 1 | 1 | 1 | +14 |
| Harrison Barnes | 22 | 9 | 3-6 | 3-5 | 1 | 1 | 0 | 0 | 0 | -12 |
| Keldon Johnson | 16 | 8 | 3-5 | 0-2 | 4 | 0 | 0 | 0 | 4 | -13 |
| Julian Champagnie | 15 | 5 | 2-2 | 1-1 | 2 | 0 | 1 | 1 | 0 | +5 |
| Luke Kornet | 16 | 6 | 3-3 | 0-0 | 4 | 3 | 0 | 0 | 0 | +14 |
| Jeremy Sochan | 4 | 0 | 0-1 | 0-0 | 0 | 0 | 0 | 1 | 0 | -6 |
| Bismack Biyombo | 3 | 0 | 0-0 | 0-0 | 1 | 0 | 0 | 0 | 0 | -8 |
| Kelly Olynyk | 5 | 0 | 0-1 | 0-0 | 2 | 1 | 0 | 0 | 1 | -4 |
| Jordan McLaughlin | 4 | 0 | 0-1 | 0-0 | 0 | 0 | 0 | 0 | 0 | -6 |
The Spurs finished 55-of-99 from the field, 14-of-35 from three, and 14-of-20 at the free-throw line.
Why San Antonio Won Despite 16 Turnovers
At first glance, San Antonio’s 16 turnovers look like a major weakness.
Dallas committed only seven.
That means the Spurs gave the ball away nine more times.
Yet San Antonio still won by 13 points.
The explanation is shooting efficiency and interior production.
The Spurs made 55 field goals. Dallas made 46.
That is a nine-field-goal difference.
San Antonio also shot 55.6% from the field, while Dallas shot 43.8%.
The Spurs therefore created significantly more value from their possessions.
Dallas’ turnover advantage helped keep the game from becoming even more one-sided, but it could not fully compensate for the shooting gap.
This is an important lesson when reading basketball statistics. Turnovers matter, but they should never be viewed in isolation.
A team can lose the turnover battle and still win comfortably if it has a large enough advantage in shooting, rebounding, interior scoring, or other possession-level factors.
That is exactly what happened here.
The Rebounding Difference Was Significant
San Antonio collected 52 rebounds compared with Dallas’ 41.
That is an 11-rebound advantage.
Castle and Wembanyama each grabbed 12, while Bagley led Dallas with 12.
The important point is that Dallas did have a strong individual rebounder in Bagley, but San Antonio’s production was distributed across more players.
The Spurs also collected 40 defensive rebounds compared with Dallas’ 29.
That limited Dallas’ second-chance opportunities and allowed San Antonio to finish defensive possessions more consistently.
Rebounding also affected transition opportunities. Once a defensive possession ends with a clean defensive rebound, the winning team can immediately move into offense.
The Spurs finished with 28 fast-break points, compared with 18 for Dallas.
San Antonio Dominated the Paint
Perhaps the clearest statistical difference was inside the three-point line.
San Antonio scored 74 points in the paint.
Dallas scored 50.
That is a 24-point advantage.
This is especially important because both teams shot around 40% from three.
Dallas made 15 of 37 three-point attempts, while San Antonio made 14 of 35.
The difference was therefore not primarily three-point accuracy.
It was what happened around those perimeter shots.
San Antonio was more effective at converting inside, finishing possessions, attacking the basket, and using its size.
Wembanyama’s presence naturally creates a different interior matchup, but Castle’s ability to penetrate and score efficiently added another dimension.
The result was an offense that could produce points from several areas of the floor.
The First Half Created the Separation
The game was largely shaped before halftime.
Dallas scored 32 points in the first quarter.
That sounds strong on its own.
But San Antonio scored 39.
In the second quarter, Dallas added 35.
San Antonio scored 42.
At halftime, the Spurs had scored 81 points.
Dallas had scored 67.
That 14-point halftime deficit became difficult to overcome because San Antonio continued to score efficiently in the third quarter.
The Spurs scored another 33 points in the third, while Dallas managed only 24.
After three quarters, San Antonio had built a 114-91 lead.
Dallas then won the fourth quarter 34-24, but the deficit was already too large.
This is why quarter-by-quarter statistics can provide more insight than the final score alone.
The fourth quarter showed that Dallas could compete with San Antonio’s offense over a single period.
The first three quarters showed why the game was already largely decided.
Dallas’ Fourth-Quarter Response
Dallas did not simply stop playing after falling behind.
The Mavericks scored 34 points in the fourth quarter, their highest total of the night.
San Antonio scored 24.
That reduced the final margin to 13.
The fourth-quarter response is relevant because it shows the final score did not fully represent the game’s largest separation.
San Antonio’s biggest lead was 28 points.
Dallas’ late scoring made the final margin look more competitive than some of the earlier game states.
For anyone studying the game, the sequence matters.
A 13-point final margin does not mean the two teams played evenly throughout the night.
The game had stretches where San Antonio controlled the contest much more clearly.
What the Dallas Shot Profile Reveals
Dallas attempted 105 field goals.
That was six more attempts than San Antonio’s 99.
Yet the Mavericks made nine fewer shots.
This creates one of the clearest statistical explanations for the result.
Dallas had enough opportunities.
The bigger problem was converting those opportunities at the same rate.
The Mavericks made 46 of 105 attempts.
San Antonio made 55 of 99.
That means Dallas needed significantly more attempts to produce fewer made field goals.
The three-point numbers were much closer.
Dallas made 15 of 37.
San Antonio made 14 of 35.
Both teams were therefore around 40% from deep.
The major shooting difference came from overall field-goal efficiency.
Free Throws Did Not Decide the Game
Dallas actually had a slight advantage in free-throw percentage.
The Mavericks shot 18-of-24, or 75%.
San Antonio shot 14-of-20, or 70%.
Dallas also made four more free throws.
But the difference was not large enough to offset the Spurs’ field-goal advantage.
This is another example of why one category rarely explains an NBA game by itself.
Dallas performed well enough at the line.
It also protected the ball.
It made one more three-pointer.
It had more steals.
Yet San Antonio still won comfortably because the Spurs were far more efficient from the field and controlled the rebounding and paint categories.
Dallas’ Seven Turnovers Stand Out
One of the most impressive team statistics for Dallas was its seven turnovers.
That is remarkably low for a team producing 35 assists.
Dallas finished with an assist-to-turnover ratio of 5.0.
San Antonio had 34 assists against 16 turnovers.
That is an assist-to-turnover ratio of approximately 2.1.
From a pure ball-security standpoint, Dallas was much cleaner.
Tyus Jones was especially effective, recording seven assists without a turnover.
This suggests that Dallas’ offensive problems were not primarily caused by careless ball handling.
The issue was more closely connected to shot conversion and the Spurs’ ability to generate efficient offense.
What the Plus/Minus Numbers Say
Plus/minus can be useful, but it needs careful interpretation.
For San Antonio, Vassell finished at +31 and Castle at +30.
For Dallas, Tyus Jones finished at +18 and Klay Thompson at +9.
Those numbers indicate that some Dallas lineups performed better during their minutes despite the overall loss.
Jones’ +18 is especially interesting because he scored only four points.
His impact came through seven assists, zero turnovers, and the possessions he helped organize.
Meanwhile, Flagg finished at -31.
That does not mean Flagg was solely responsible for the margin. Plus/minus reflects the score differential while a player is on the court, not an isolated player grade.
The best way to use it is alongside the traditional box score.
Season Series Context
The result was also significant in the season series.
San Antonio took a 3-0 lead over Dallas in the 2025-26 season series following this win. The Spurs had also defeated the Mavericks 135-123 earlier in the week.
That context matters because this was not an isolated matchup.
The teams had already faced each other multiple times, allowing both coaching staffs and players to have substantial familiarity with the opposing personnel.
The repeated matchups also make the statistical pattern notable.
San Antonio’s offensive advantages continued to show up across the series.
What This Game Says About Stephon Castle
Castle’s performance deserves to be viewed separately from the team result.
A 40-point triple-double is rare.
Doing it while shooting 15-of-19 makes the performance even more statistically unusual.
The combination of scoring and playmaking was the key.
Castle did not simply finish possessions himself.
He also created scoring opportunities for teammates.
His 12 assists matched his 12 rebounds, giving him a perfectly balanced triple-double outside of the scoring total.
His six turnovers are the obvious statistical blemish, but they occurred alongside an enormous offensive workload.
The most important takeaway is that Castle was involved in virtually every major aspect of San Antonio’s performance.
What This Game Says About Victor Wembanyama
Wembanyama’s 16 points may appear modest next to Castle’s 40.
But his complete line was still highly influential:
16 points, 11 rebounds, 3 blocks.
He was also part of a Spurs frontcourt that helped San Antonio win the overall rebounding battle by 11.
The three blocks contributed to San Antonio’s 11 total blocks.
This is a useful reminder that Wembanyama’s value cannot be judged only by scoring.
A player can affect shot selection, rebounding, rim protection, and spacing without producing 30 points.
In this matchup, San Antonio had both a dominant perimeter performance from Castle and meaningful interior production from Wembanyama.
Important Statistical Corrections
Several figures are worth clarifying for readers comparing different versions of this game report.
First, the game was officially listed as Saturday, February 7, 2026, at Frost Bank Center. Some reports may show February 8 because the AP game recap was published shortly after midnight on February 8.
Second, Tyus Jones was Dallas’ assist leader with seven assists.
Third, Klay Thompson was Dallas’ top scorer with 19 points, but Max Christie and Brandon Williams were also significant contributors with 17 and 18 points respectively.
Fourth, Marvin Bagley III finished with 16 points and 12 rebounds, making him Dallas’ leading rebounder.
These distinctions are important for anyone using the game statistics for analysis, publishing, fantasy research, or historical reference.
Key Takeaways From the Box Score
The most useful conclusions from the player statistics are straightforward.
- Stephon Castle was the central performer.
His 40-point triple-double combined scoring, rebounding, and playmaking at an exceptional level.
- San Antonio won through efficiency.
The Spurs shot 55.6% from the field compared with Dallas at 43.8%.
- The Spurs controlled the interior.
San Antonio scored 74 points in the paint, 24 more than Dallas.
- Rebounding favored San Antonio.
The Spurs had 52 rebounds to Dallas’ 41.
- Dallas protected the ball better.
The Mavericks committed seven turnovers compared with 16 for San Antonio.
- Dallas had several efficient individual performances.
Brandon Williams shot 8-of-12, Klay Thompson made four threes, and Tyus Jones delivered seven assists without a turnover.
- Marvin Bagley III made a strong statistical debut.
He recorded 16 points, 12 rebounds, and four blocks.
- The first three quarters determined the outcome.
San Antonio led by 14 at halftime and by 23 after three quarters before Dallas won the fourth quarter 34-24.
Frequently Asked Questions
Who scored the most points in the Dallas Mavericks vs San Antonio Spurs game?
Stephon Castle led all players with 40 points. He also recorded 12 rebounds and 12 assists for a triple-double.
What was Stephon Castle’s stat line?
Stephon Castle finished with 40 points, 12 rebounds, 12 assists, 15-of-19 field-goal shooting, 3-of-5 three-point shooting, three steals, one block, and six turnovers.
Who led the Dallas Mavericks in scoring?
Klay Thompson led Dallas with 19 points. Brandon Williams scored 18, while Max Christie scored 17.
Who led Dallas in rebounds and assists?
Marvin Bagley III led Dallas with 12 rebounds. Tyus Jones led the Mavericks with seven assists and committed no turnovers.
What was the final score?
The San Antonio Spurs defeated the Dallas Mavericks 138-125 at Frost Bank Center.
How did the teams compare statistically?
San Antonio shot 55.6% from the field and collected 52 rebounds, while Dallas shot 43.8% and collected 41 rebounds. Dallas had the better turnover figure, committing seven compared with San Antonio’s 16.
Conclusion
The Dallas Mavericks vs San Antonio Spurs match player stats from this matchup provide a clear picture of how San Antonio built a 138-125 victory.
Stephon Castle was the standout performer, producing a career-high 40-point triple-double with 12 rebounds and 12 assists. Victor Wembanyama added 16 points, 11 rebounds, and three blocks, while Devin Vassell contributed 17 points and six assists.
Dallas had several useful individual performances of its own. Klay Thompson led the Mavericks with 19 points, Brandon Williams scored 18 on efficient shooting, Max Christie added 17, and Marvin Bagley III produced 16 points, 12 rebounds, and four blocks. Tyus Jones also supplied seven assists without a turnover.
The broader team numbers explain the result even more clearly. San Antonio shot 55.6% from the field, outrebounded Dallas 52-41, scored 74 points in the paint, and blocked 11 shots. Dallas responded with better ball security, committing only seven turnovers while producing 35 assists.
The game therefore was not simply a story about one spectacular individual performance. It was a combination of Castle’s extraordinary production, San Antonio’s shooting efficiency, interior control, rebounding advantage, and strong first three quarters.
For anyone examining the Dallas Mavericks vs San Antonio Spurs match player stats, the most useful approach is to look beyond the final score and leading scorer. The individual lines, shooting percentages, rebounding totals, assist numbers, turnovers, and quarter-by-quarter scoring together provide the clearest explanation of how the game unfolded.