Milwaukee Bucks vs Washington Wizards Match Player Stats
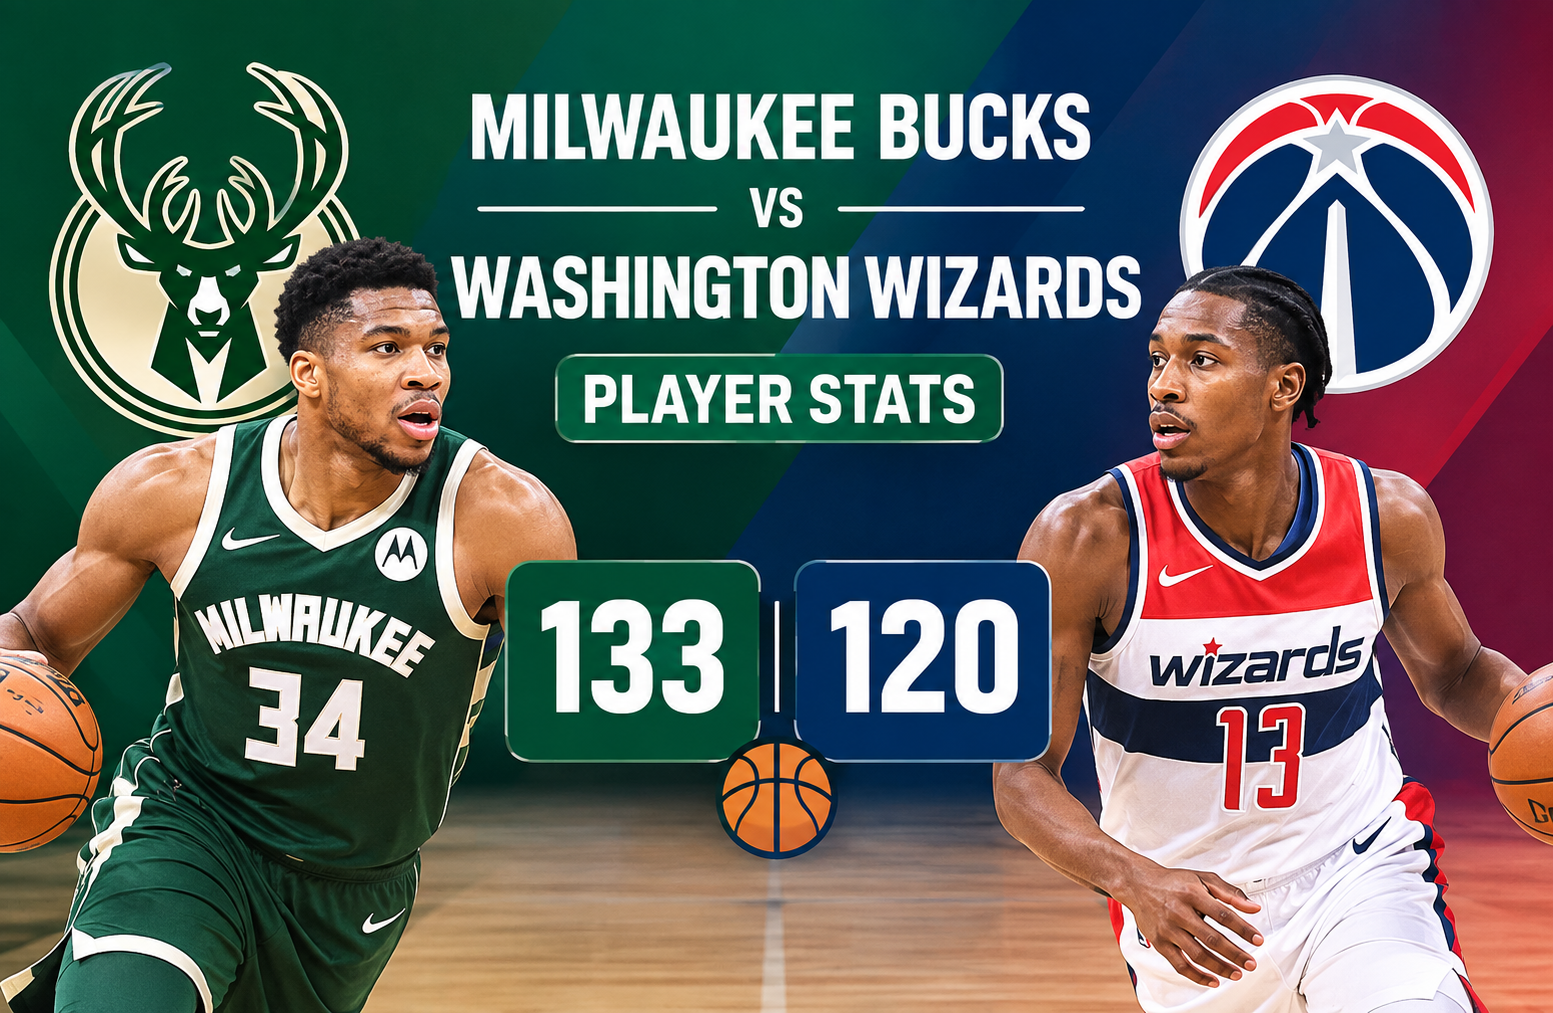
The milwaukee bucks vs washington wizards match player stats from October 23, 2025, tell the story of a game that was much more competitive offensively than the final margin might suggest. The Milwaukee Bucks defeated the Washington Wizards 133-120 at Fiserv Forum in Milwaukee, but the box score reveals several layers beneath the 13-point difference. Milwaukee opened the game with a dominant 40-point first quarter, converted 51 percent of its field-goal attempts, committed only eight turnovers, and received a huge all-around performance from Giannis Antetokounmpo. Washington responded with 37 points in the third quarter and shot 40 percent from three-point range, but the Wizards could not overcome Milwaukee’s early advantage and superior ball security.
The final score was Milwaukee 133, Washington 120, giving the Bucks a 1-0 record and leaving the Wizards at 0-1. Giannis Antetokounmpo was the clear statistical centerpiece, producing 37 points, 14 rebounds, and 5 assists. For Washington, Khris Middleton led the team with 23 points, while Alex Sarr collected 11 rebounds and Kyshawn George finished with 4 assists.
The game also provides a useful example of why player statistics should not be viewed in isolation. Points explain who scored, but shooting efficiency, rebounding, assists, turnovers, and the timing of scoring runs explain why one team ultimately won.
Milwaukee Bucks vs Washington Wizards Match Player Stats: Game Overview
The Bucks entered the matchup and immediately established control. Milwaukee scored 40 points in the opening quarter while Washington managed 23. That 17-point difference became the foundation of the final result.
Washington improved in the second quarter, scoring 30 points compared with Milwaukee’s 32. The Wizards then produced their best offensive quarter of the night in the third, scoring 37 points while limiting Milwaukee to 29. That reduced some of the deficit and showed that Washington had enough offensive firepower to challenge the Bucks.
Milwaukee regained its rhythm in the fourth quarter, scoring 32 points to Washington’s 30.
Final score
| Team | Q1 | Q2 | Q3 | Q4 | Final |
| Milwaukee Bucks | 40 | 32 | 29 | 32 | 133 |
| Washington Wizards | 23 | 30 | 37 | 30 | 120 |
The 133-120 result means Milwaukee won by 13 points.
However, the quarter-by-quarter numbers are particularly revealing. Washington actually outscored Milwaukee 67-61 across the second half. The problem was that the Bucks had already created a substantial advantage during the opening two quarters.
That is one of the most important lessons from this box score. A team can play better for long stretches and still lose comfortably when it starts too slowly.
Giannis Antetokounmpo Dominates the Box Score
Giannis Antetokounmpo produced the most complete individual performance of the game.
He finished with:
- 37 points
- 14 rebounds
- 5 assists
That combination made him the game’s MVP-level performer according to the supplied game data.
The significance of the performance goes beyond his scoring total. A 37-point game can be impressive on its own, but adding 14 rebounds and 5 assists demonstrates that Giannis influenced multiple areas of the game.
His 14 rebounds were also the highest total recorded by any player in the matchup. That gave Milwaukee a major interior presence while allowing its best player to contribute on both ends of the floor.
The five assists are equally important. They show that Giannis was not simply finishing possessions himself. He was also creating opportunities for teammates.
For statistical analysis, this is an important distinction. A player’s impact becomes easier to understand when scoring, rebounding, and playmaking are evaluated together rather than relying on points alone.
Why Giannis’ 37-point performance mattered
Milwaukee’s offensive efficiency was already strong, with the team making 50 of 98 field-goal attempts for 51 percent. Giannis’ ability to produce 37 points within that offense gave Washington another problem to solve.
The Bucks also finished with 31 assists. That suggests their scoring was supported by meaningful ball movement rather than relying entirely on individual isolation possessions.
Giannis therefore stands out not only because he scored the most points, but because his 37-14-5 line fits into a broader team performance built around efficient shooting and passing.
Washington’s Leading Scorer: Khris Middleton
Khris Middleton led Washington with 23 points.
His scoring total was 14 points lower than Giannis’ 37, which illustrates the gap between the leading individual performers on the two teams.
Nevertheless, Middleton’s 23 points were important for a Wizards team that scored 120 points overall. Washington was not shut down offensively. In fact, the team produced 37 points in the third quarter and shot 47 percent from the field for the game.
That makes the offensive story more nuanced.
Washington’s problem was not an inability to score. The Wizards generated 120 points and converted 17 of 42 three-point attempts. Their 40 percent three-point shooting was respectable and gave them the ability to create scoring runs.
The larger issue was that their offense could not consistently compensate for Milwaukee’s first-quarter explosion and superior overall efficiency.
Alex Sarr Leads Washington on the Boards
Alex Sarr finished as Washington’s top rebounder with 11 rebounds.
That number is significant because Washington actually won the overall rebounding battle.
The Wizards collected 56 rebounds compared with Milwaukee’s 46, a 10-rebound advantage.
This is one of the most interesting statistics in the game because it shows that winning a particular statistical category does not automatically guarantee victory.
Washington grabbed:
- 13 offensive rebounds
- 43 defensive rebounds
Milwaukee recorded:
- 6 offensive rebounds
- 40 defensive rebounds
The Wizards therefore created additional opportunities through offensive rebounding. Yet Milwaukee’s efficiency, passing, and turnover advantage proved more influential.
Sarr’s 11 rebounds were the strongest individual contribution in that category for Washington.
Kyshawn George Leads the Wizards in Assists
Kyshawn George recorded 4 assists to lead Washington in that category.
The Wizards finished with 23 assists as a team.
Milwaukee, meanwhile, produced 31 assists, giving the Bucks an eight-assist advantage.
That difference matters because assists can provide useful context for understanding offensive organization. Washington scored 120 points, but Milwaukee produced more assisted offense while also shooting a higher percentage from the field.
The eight-assist gap does not explain every possession, but it is part of the larger statistical pattern that favored the Bucks.
Team Shooting Comparison
Shooting efficiency was one of the clearest advantages for Milwaukee.
The Bucks made 50 of 98 field-goal attempts, good for 51 percent.
The Wizards made 46 of 98, or 47 percent.
| Shooting Category | Bucks | Wizards |
| Field Goals | 50-98 | 46-98 |
| Field-Goal Percentage | 51% | 47% |
| Three-Pointers | 18-44 | 17-42 |
| Three-Point Percentage | 41% | 40% |
| Free Throws | 15-19 | 11-19 |
| Free-Throw Percentage | 79% | 58% |
The field-goal attempt totals were identical at 98, which makes the four-percentage-point difference particularly useful.
Milwaukee made four more field goals despite taking exactly the same number of attempts.
That is not an enormous shooting gap, but over 98 attempts it becomes meaningful.
The free-throw difference was even more notable.
Milwaukee converted 15 of 19 free throws, or 79 percent.
Washington made only 11 of 19, or 58 percent.
Both teams attempted 19 free throws, so the difference came entirely from conversion rate.
Milwaukee therefore gained four additional points from the free-throw line.
Three-Point Shooting Was Surprisingly Close
Washington’s three-point shooting was one of the stronger elements of its performance.
The Wizards made 17 of 42 attempts from beyond the arc, producing a 40 percent success rate.
Milwaukee made 18 of 44, shooting 41 percent.
That means the Bucks made only one more three-pointer than Washington.
The difference was therefore not a dramatic advantage from outside.
This is important when interpreting the result. Someone looking only at the final score might assume Milwaukee dominated every offensive category. The box score does not support that conclusion.
Washington was competitive from three-point range and actually generated a large number of rebounds. The Bucks won because several smaller advantages accumulated alongside their explosive first quarter.
Turnovers Were a Major Difference
One of the clearest statistical advantages belonged to Milwaukee in ball security.
Washington committed 13 turnovers.
Milwaukee committed only 8.
That is a five-turnover difference.
In a high-scoring game, five additional turnovers can have a substantial effect because each lost possession removes an opportunity to score and can create a transition opportunity for the opponent.
The Bucks also finished with more steals, recording 8 compared with Washington’s 5.
That combination points toward better defensive disruption and possession management.
Milwaukee’s 31 assists compared with Washington’s 23 further strengthened the overall picture. The Bucks moved the ball more effectively while giving away fewer possessions.
Rebounding: Washington Won the Battle
The rebounding statistics provide one of the game’s clearest surprises.
Washington finished with 56 total rebounds.
Milwaukee had 46.
That means the Wizards won the rebounding battle by 10.
Offensive rebounds
Washington: 13
Milwaukee: 6
Washington’s seven-rebound advantage on the offensive glass gave the Wizards extra opportunities.
Defensive rebounds
Washington: 43
Milwaukee: 40
Washington also led in defensive rebounds, although the gap was much smaller.
Despite this advantage, Washington still lost by 13.
That tells us that rebounding was not enough to offset the Bucks’ other statistical strengths.
This is a useful reminder for anyone studying basketball box scores: no single category should be treated as a complete explanation of the result.
A team can win rebounds and still lose because of shooting, turnovers, passing, free throws, or an early scoring deficit.
Assists Reveal Milwaukee’s Offensive Structure
Milwaukee recorded 31 assists against Washington’s 23.
The eight-assist difference is one of the strongest team-level indicators in the box score.
The Bucks scored 133 points and generated 31 assists while shooting 51 percent from the field.
Washington scored 120 points with 23 assists while shooting 47 percent.
The combination suggests that Milwaukee’s offense was both efficient and well connected.
This does not mean every Bucks basket was created through an assist. Nor does it mean assists alone determine offensive quality. But when assists, field-goal percentage, and turnovers all favor the same team, the statistical case becomes much stronger.
Steals and Blocks: Milwaukee Had More Defensive Activity
Milwaukee recorded 8 steals and 6 blocks.
Washington had 5 steals and 4 blocks.
The Bucks therefore led in both categories.
The difference was not enormous, but it continued the pattern of Milwaukee holding small advantages in several important areas.
Defensively, Milwaukee did not need to dominate every category because its offensive production had already created separation.
The Bucks’ eight steals also paired with their eight turnovers, creating a balanced possession profile.
Washington’s five steals compared with 13 turnovers shows a less favorable turnover ratio.
Personal Fouls and Free Throws
Washington committed 19 personal fouls.
Milwaukee committed 22.
Interestingly, the team that committed more fouls also shot free throws more effectively.
Milwaukee went 15 for 19 from the line.
Washington went 11 for 19.
This means the number of attempts was identical, but Milwaukee converted four more free throws.
The difference in foul totals also indicates that the game was not decided simply because one team received substantially more free-throw opportunities.
Instead, conversion efficiency played a role.
The First Quarter Changed the Game
If one quarter deserves special attention, it is the opening period.
Milwaukee scored 40 points.
Washington scored 23.
That 17-point difference represented the largest quarter-to-quarter gap of the game.
The Wizards spent the rest of the night trying to recover.
Washington improved by seven points in the second quarter, then exploded for 37 points in the third. By that point, however, Milwaukee had already built enough of a cushion to withstand Washington’s offensive push.
The fourth quarter ended 32-30 in Milwaukee’s favor, allowing the Bucks to close the game without another major collapse.
This is why the quarter-by-quarter breakdown is more useful than the final score alone.
The final 13-point margin does not fully communicate how much of the game was shaped by Milwaukee’s opening 12 minutes.
Washington’s Third-Quarter Response
Washington’s 37-point third quarter was arguably the team’s strongest stretch.
The Wizards outscored Milwaukee 37-29 during the period, cutting into the deficit and showing that the game was not simply a one-sided offensive performance.
This response also demonstrates the importance of momentum in high-scoring basketball.
After being outscored by 17 points in the first quarter, Washington needed a major offensive response. It delivered that response in the third quarter.
The problem was consistency.
A 37-point quarter is excellent, but it could not erase the damage created by the opening period.
Milwaukee’s ability to respond in the fourth quarter was equally important. The Bucks scored 32 points and kept Washington from turning its third-quarter surge into a complete comeback.
Milwaukee’s Offensive Efficiency
Milwaukee scored 133 points on 98 field-goal attempts.
The team shot 51 percent from the field, 41 percent from three, and 79 percent from the free-throw line.
Those numbers describe an efficient offensive performance across all three major shooting areas.
The Bucks also produced 31 assists and committed only 8 turnovers.
That combination is particularly strong:
- 133 points
- 51 percent field shooting
- 41 percent three-point shooting
- 79 percent free-throw shooting
- 31 assists
- 8 turnovers
It is difficult for an opponent to overcome that type of offensive profile, especially after conceding 40 points in the first quarter.
Washington’s Offensive Performance Should Not Be Overlooked
Despite losing, Washington’s 120 points are significant.
The Wizards shot 47 percent from the field and 40 percent from three.
They also collected 56 rebounds.
Those statistics show that Washington was capable of producing offense and controlling the glass.
The biggest weaknesses were relative rather than absolute.
A 47 percent field-goal percentage is not poor.
A 40 percent three-point percentage is not poor.
Twenty-three assists is not an insignificant total.
But Milwaukee was better in the categories that mattered most collectively.
The Bucks shot better, passed better, protected the ball better, made free throws at a higher rate, and started the game much faster.
Comparing the Leading Players
The individual leaders provide a useful snapshot of how the game unfolded.
| Category | Milwaukee | Washington |
| Leading Scorer | Giannis Antetokounmpo, 37 points | Khris Middleton, 23 points |
| Top Rebounder | Giannis Antetokounmpo, 14 rebounds | Alex Sarr, 11 rebounds |
| Top Assists | Giannis Antetokounmpo, Myles Turner, Ryan Rollins, 5 each | Kyshawn George, 4 assists |
| MVP-Level Performance | Giannis Antetokounmpo | Not specified in supplied data |
Giannis led Milwaukee in both scoring and rebounding while also tying for the team lead in assists.
That makes his performance unusually complete.
Washington had more specialized statistical leaders. Middleton led in scoring, Sarr led in rebounding, and George led in assists.
Milwaukee’s statistical structure was therefore more concentrated around Giannis’ all-around production.
Why the Box Score Favors Milwaukee
The most important advantages can be grouped into five areas.
1. Milwaukee started much faster
The Bucks scored 40 points in the first quarter while Washington scored only 23.
That created the game’s fundamental advantage.
2. Milwaukee shot more efficiently
Both teams attempted 98 field goals, but Milwaukee made 50 compared with Washington’s 46.
3. Milwaukee protected the ball
The Bucks had only 8 turnovers compared with Washington’s 13.
4. Milwaukee passed more effectively
The Bucks recorded 31 assists against Washington’s 23.
5. Milwaukee converted free throws better
Both teams attempted 19 free throws, but Milwaukee made 15 while Washington made 11.
These advantages outweighed Washington’s 10-rebound edge.
What Washington Did Well
The Wizards’ performance should not be reduced to a loss.
Several areas were encouraging from the box-score perspective.
Washington shot 40 percent from three-point range, which kept its offense dangerous.
The team also grabbed 13 offensive rebounds. Those second-chance opportunities helped Washington reach 120 points despite falling behind early.
The third quarter was another positive. Washington scored 37 points and outscored Milwaukee by eight.
Alex Sarr’s 11 rebounds also demonstrated a strong individual contribution on the glass.
The problem was that these strengths were not enough to neutralize Milwaukee’s efficiency and ball security.
What Milwaukee Did Best
The Bucks’ strongest feature was balance.
They were not overwhelmingly better in every statistical category.
Instead, they were better in several categories that directly influence scoring efficiency and possession value.
Their 51 percent shooting was better than Washington’s 47 percent.
Their 41 percent three-point shooting was slightly better than Washington’s 40 percent.
Their 79 percent free-throw shooting was considerably better than Washington’s 58 percent.
Their 31 assists were eight more than Washington’s.
Their eight turnovers were five fewer.
Their eight steals were three more.
That combination created a sustainable advantage.
Milwaukee Bucks vs Washington Wizards Match Player Stats and Key Takeaways
The milwaukee bucks vs washington wizards match player stats show why box-score analysis requires more than identifying the leading scorer.
Giannis Antetokounmpo’s 37 points were the headline figure, but his 14 rebounds and 5 assists made the performance considerably more impactful.
Khris Middleton’s 23 points made him Washington’s leading scorer, while Alex Sarr’s 11 rebounds and Kyshawn George’s 4 assists represented the team’s leading individual contributions in those categories.
At the team level, Milwaukee shot 51 percent compared with Washington’s 47 percent. The Bucks also made 15 of 19 free throws, while Washington converted only 11 of 19.
Washington’s 56 rebounds were an important positive, especially its 13 offensive rebounds, but Milwaukee’s eight turnovers compared with Washington’s 13 gave the Bucks a significant possession advantage.
The quarter-by-quarter numbers provide perhaps the clearest explanation.
Milwaukee’s 40-23 first quarter created the cushion that Washington spent the remainder of the game attempting to erase. Washington did respond with a 37-point third quarter, but Milwaukee answered with 32 points in the fourth and secured a 133-120 victory.
A Statistical Profile of the Game
The game can be summarized through several connected statistical relationships.
Scoring: Milwaukee 133, Washington 120.
Field-goal efficiency: Milwaukee 51 percent, Washington 47 percent.
Three-point efficiency: Milwaukee 41 percent, Washington 40 percent.
Free-throw efficiency: Milwaukee 79 percent, Washington 58 percent.
Rebounding: Washington 56, Milwaukee 46.
Assists: Milwaukee 31, Washington 23.
Turnovers: Milwaukee 8, Washington 13.
Steals: Milwaukee 8, Washington 5.
Blocks: Milwaukee 6, Washington 4.
These numbers demonstrate a common basketball principle: winning is usually the result of several connected advantages rather than one isolated statistic.
Washington won the rebounding battle by 10, but Milwaukee won the game because it was more efficient with its shooting, more effective with its passing, and more careful with possession.
Why the Result Matters for Player Evaluation
Individual statistics are most useful when placed within the team context.
Giannis’ 37-14-5 performance becomes more impressive because it arrived during a 133-point team performance.
Similarly, Middleton’s 23 points should be considered alongside Washington’s 120-point total and the team’s 47 percent shooting.
Sarr’s 11 rebounds are particularly notable because Washington won the overall rebounding battle.
George’s 4 assists show that he was Washington’s leading facilitator based on the supplied data, but Milwaukee’s three co-leaders in assists each reached 5.
This kind of context prevents misleading conclusions.
A player can lead a team in scoring without necessarily being the most influential player overall. Likewise, a team can dominate one statistical category while losing because of weaknesses elsewhere.
Milwaukee’s 1-0 Start
The victory moved Milwaukee to 1-0, while Washington fell to 0-1.
The season-series record after the game was also 1-0 in Milwaukee’s favor.
The matchup took place at Fiserv Forum in Milwaukee, Wisconsin, with an attendance of 17,341.
The game was identified by Game ID 401809939.
The officials listed for the contest were Brian Forte, Curtis Blair, and Brandon Adair.
These details provide useful context for readers who want to distinguish this specific matchup from other Bucks-Wizards meetings.
Frequently Asked Questions
Who led the Bucks in scoring against the Wizards?
Giannis Antetokounmpo led Milwaukee with 37 points. He also recorded 14 rebounds and 5 assists.
Who was Washington’s leading scorer?
Khris Middleton led Washington with 23 points.
Who had the most rebounds in the game?
Giannis Antetokounmpo had the most individual rebounds with 14. Alex Sarr led Washington with 11 rebounds.
Which team won the game?
The Milwaukee Bucks defeated the Washington Wizards 133-120 on October 23, 2025.
Did Washington win the rebounding battle?
Yes. Washington collected 56 rebounds compared with Milwaukee’s 46, giving the Wizards a 10-rebound advantage.
What was the biggest statistical difference between the teams?
Milwaukee had several important advantages, including better field-goal shooting, more assists, fewer turnovers, more steals, and better free-throw accuracy. Washington’s biggest advantage was rebounding.
Conclusion
The milwaukee bucks vs washington wizards match player stats from October 23, 2025, present a clear example of how a basketball game can be decided by efficiency and possession management rather than one statistical category.
Giannis Antetokounmpo delivered the game’s standout individual performance with 37 points, 14 rebounds, and 5 assists. Khris Middleton led Washington with 23 points, while Alex Sarr collected 11 rebounds and Kyshawn George recorded 4 assists.
Milwaukee’s 51 percent field-goal shooting, 41 percent three-point shooting, 79 percent free-throw shooting, 31 assists, and only 8 turnovers formed the statistical backbone of its victory. Washington countered with 56 rebounds, 13 offensive rebounds, and a strong 40 percent performance from three-point range.
The biggest turning point remained the opening quarter. Milwaukee scored 40 points while Washington managed 23, creating a deficit that the Wizards could not completely erase despite winning the third quarter 37-29.
Ultimately, the 133-120 score reflects more than Milwaukee’s ability to score. It reflects the Bucks’ combination of efficient shooting, ball movement, possession control, and a dominant all-around performance from Giannis. Washington showed enough offensive quality and rebounding strength to make the game competitive for stretches, but Milwaukee’s early advantage and overall statistical balance proved decisive.