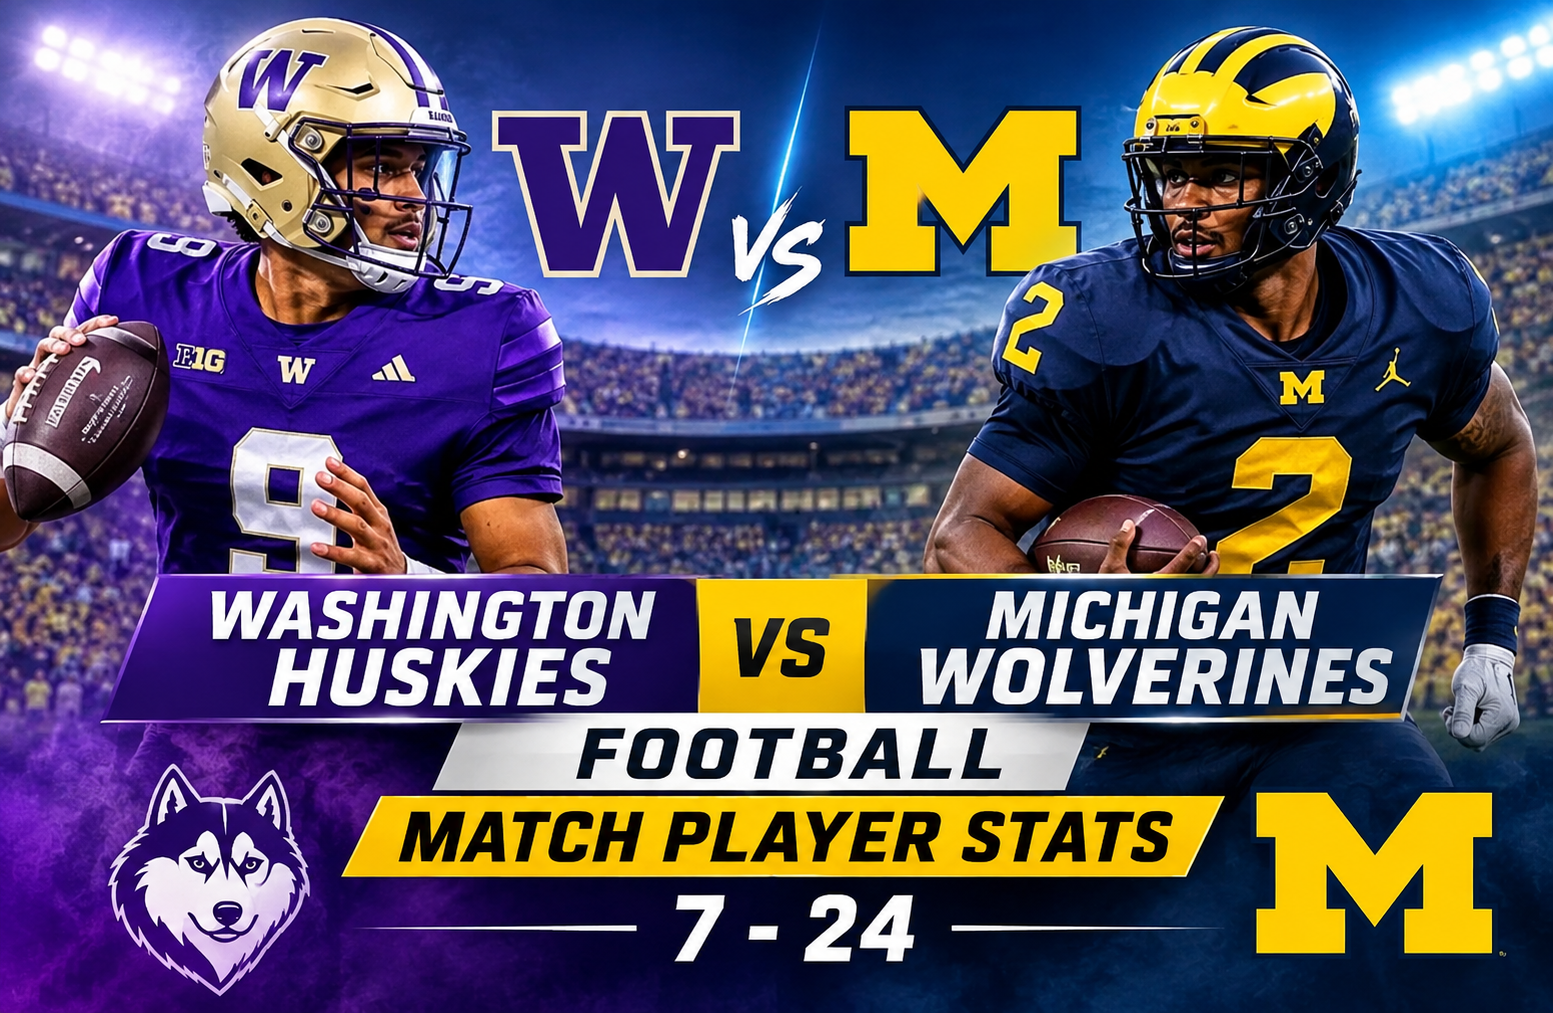
Washington huskies football vs michigan wolverines football match player stats
The washington huskies football vs michigan wolverines football match player stats reveal how Michigan secured a convincing 24-7 victory over Washington on October 18, 2025. The matchup showcased Michigan’s balanced offensive approach, strong quarterback play, and an aggressive defensive performance that created three interceptions. Washington showed flashes of offensive potential, but turnovers and limited rushing production made it difficult to stay competitive throughout the game.
Michigan entered the contest with a 5-2 overall record and a 3-1 mark in Big Ten play. Washington also held a 5-2 overall record but had a 2-2 conference record. Both teams had important reasons to compete for a victory, making this matchup a valuable test of their performance during the 2025 college football season.
The final score reflected Michigan’s ability to control important phases of the game. Quarterback Bryce Underwood completed 21 of 27 passes for 230 yards and two touchdowns without throwing an interception. Running back Jordan Marshall added 133 rushing yards and a touchdown on 25 carries. Together, they provided the offensive balance Michigan needed.
Washington quarterback Demond Williams Jr. completed 20 of 32 passes for 209 yards. However, his three interceptions proved costly. Running back Jonah Coleman scored Washington’s only touchdown, while wide receiver Denzel Boston led the receiving group with 71 yards.
This detailed breakdown examines the final score, quarterback statistics, rushing and receiving performances, defensive contributions, special teams, and the numbers that explain why Michigan won the contest.
Game Overview: Washington Huskies vs Michigan Wolverines
The October 18, 2025 matchup featured two Big Ten programs with identical overall records. Michigan ultimately demonstrated greater efficiency on offense and stronger execution on defense.
Here are the essential details from the contest.
| Game Information | Details |
| Matchup | Washington Huskies vs Michigan Wolverines |
| Sport | NCAA College Football |
| Game Date | October 18, 2025 |
| Final Score | Michigan 24, Washington 7 |
| Game Status | Final |
| Washington Record | 5-2 |
| Washington Big Ten Record | 2-2 |
| Michigan Record | 5-2 |
| Michigan Big Ten Record | 3-1 |
| ESPN Game ID | 401752873 |
| Data Source | ESPN College Football Box Score |
Michigan won by 17 points, but the result was about more than the final margin. The Wolverines controlled the rushing game, protected their quarterback, and repeatedly took advantage of Washington’s passing mistakes.
Washington managed to remain competitive during the first half. However, the Wolverines created separation after halftime and prevented the Huskies from establishing a consistent offensive rhythm.
Final Score by Quarter
The scoring progression provides a useful picture of how the contest developed.
| Quarter | Washington | Michigan |
| First Quarter | 0 | 7 |
| Second Quarter | 7 | 0 |
| Third Quarter | 0 | 7 |
| Fourth Quarter | 0 | 10 |
| Final | 7 | 24 |
Michigan started the game with a seven-point advantage. Washington responded in the second quarter, tying the scoring for the first half at 7-7.
The third quarter became an important turning point. Michigan scored another touchdown and regained control of the scoreboard. The Wolverines then added 10 points in the fourth quarter, while Washington failed to score again.
The scoring pattern highlights an important difference between the teams. Washington showed that it could respond during the first half, but Michigan maintained its offensive production after halftime.
washington huskies football vs michigan wolverines football match player stats
The individual performances provide a clearer explanation of Michigan’s victory. The Wolverines received major contributions from their quarterback, running backs, receivers, and defensive players.
Washington also had several productive individual performances, particularly from Denzel Boston and Jonah Coleman. However, its offensive production was not enough to overcome the turnovers.
Complete Team Statistics
| Statistical Category | Washington | Michigan |
| Total Points | 7 | 24 |
| Passing Yards | 209 | 230 |
| Passing Completions | 20 | 21 |
| Passing Attempts | 32 | 28 |
| Passing Touchdowns | 0 | 2 |
| Interceptions Thrown | 3 | 0 |
| Rushing Attempts | 23 | 40 |
| Rushing Yards | 40 | 187 |
| Rushing Touchdowns | 1 | 1 |
| Average Rushing Yards | 1.7 | 4.7 |
| Receiving Yards | 209 | 230 |
| Receptions | 20 | 21 |
| Receiving Touchdowns | 0 | 2 |
| Total Tackles | 72 | 46 |
| Sacks | 1 | 2 |
| Tackles for Loss | 3 | 7 |
| Passes Defended | 3 | 2 |
| Fumbles Lost | 0 | 0 |
Michigan’s biggest advantage came on the ground. The Wolverines produced 187 rushing yards compared with Washington’s 40.
That difference of 147 rushing yards allowed Michigan to maintain better offensive balance. It also helped the Wolverines avoid placing too much pressure on their passing game.
The passing numbers were relatively close in total yardage. Michigan recorded 230 passing yards, while Washington finished with 209. However, the touchdown and interception statistics tell a different story.
Michigan scored twice through the passing game without giving away possession through an interception. Washington did not record a passing touchdown and threw three interceptions.
This combination of rushing efficiency and passing security was central to the result.
Bryce Underwood’s Quarterback Performance
Bryce Underwood delivered one of Michigan’s most important performances.
The young quarterback completed 21 of 27 passing attempts for 230 yards and two touchdowns. He averaged 8.5 yards per attempt and finished without an interception.
His reported QBR was 69.6.
| Bryce Underwood Statistic | Performance |
| Completions | 21 |
| Attempts | 27 |
| Completion Percentage | 77.8% |
| Passing Yards | 230 |
| Yards Per Attempt | 8.5 |
| Passing Touchdowns | 2 |
| Interceptions | 0 |
| QBR | 69.6 |
| Rushing Attempts | 7 |
| Rushing Yards | 25 |
| Rushing Average | 3.6 |
Underwood’s completion percentage was particularly impressive. Completing nearly 78% of his passes allowed Michigan to sustain drives and avoid unnecessary passing mistakes.
His 230 passing yards also demonstrated that Michigan did not rely entirely on its rushing attack. The Wolverines could move the football through the air when opportunities appeared.
Why Underwood’s Accuracy Mattered
Quarterback efficiency involves more than accumulating passing yards. A quarterback must complete passes, protect possession, and help the offense maintain a manageable down-and-distance situation.
Underwood performed well in these areas.
Three aspects of his performance stand out:
- High completion rate: His 21 completions on 27 attempts demonstrated consistent passing accuracy.
- Touchdown production: Both of his passing touchdowns directly contributed to Michigan’s scoring advantage.
- Ball security: Avoiding interceptions prevented Washington from receiving additional offensive opportunities.
Underwood also contributed 25 rushing yards on seven carries. This added another element to Michigan’s offensive attack.
His ability to contribute as both a passer and runner made it harder for Washington to focus exclusively on stopping Jordan Marshall.
Donaven McCulley’s Passing Attempt
Michigan also recorded one passing attempt from Donaven McCulley.
| Statistic | Result |
| Completions | 0 |
| Attempts | 1 |
| Passing Yards | 0 |
| Touchdowns | 0 |
| Interceptions | 0 |
| QBR | 3.7 |
McCulley’s passing attempt did not produce additional yardage. His more meaningful statistical contributions came through receiving and rushing.
Demond Williams Jr. and Washington’s Passing Struggles
Demond Williams Jr. finished with 209 passing yards, but his three interceptions significantly affected Washington’s offensive performance.
He completed 20 of 32 attempts, giving him a completion rate of 62.5%. His average was 6.5 yards per attempt, and he did not record a passing touchdown.
His reported QBR was 35.7.
| Demond Williams Jr. Statistic | Performance |
| Completions | 20 |
| Attempts | 32 |
| Completion Percentage | 62.5% |
| Passing Yards | 209 |
| Yards Per Attempt | 6.5 |
| Passing Touchdowns | 0 |
| Interceptions | 3 |
| QBR | 35.7 |
| Rushing Attempts | 5 |
| Rushing Yards | -19 |
| Rushing Average | -3.8 |
Williams showed the ability to complete passes and move the ball through the air. However, the three interceptions prevented Washington from converting enough offensive opportunities into points.
His negative rushing total also limited his overall contribution.
Three Interceptions Changed the Game
Interceptions were arguably the most damaging part of Washington’s performance.
The Huskies finished with three interceptions thrown, while Michigan recorded three interceptions through Cole Sullivan, Jimmy Rolder, and Jacob Oden.
Turnovers affect a football game in several ways.
- They stop offensive drives immediately.
- They give the opposing offense additional possession opportunities.
- They can create favorable field position.
- They prevent an offense from building momentum.
- They place additional pressure on the defense.
Michigan took advantage of Washington’s mistakes without committing an interception of its own.
That difference in ball security helped the Wolverines maintain control even when their offense was not scoring on every possession.
Rushing Statistics: Jordan Marshall Leads Michigan
The rushing game was one of the clearest differences between the two teams.
Michigan recorded 187 rushing yards on 40 attempts, averaging 4.7 yards per carry. Washington managed only 40 rushing yards on 23 attempts, averaging 1.7 yards per carry.
Jordan Marshall was the standout performer.
Michigan Rushing Leaders
| Player | Carries | Yards | Average | Touchdowns | Long |
| Jordan Marshall | 25 | 133 | 5.3 | 1 | 14 |
| Bryce Underwood | 7 | 25 | 3.6 | 0 | 17 |
| Jasper Parker | 6 | 20 | 3.3 | 0 | 6 |
| Donaven McCulley | 1 | 11 | 11.0 | 0 | 11 |
| Team-Recorded Carry | 1 | -2 | -2.0 | 0 | Not specified |
| Michigan Total | 40 | 187 | 4.7 | 1 | 17 |
Jordan Marshall’s Outstanding Performance
Jordan Marshall produced 133 rushing yards on 25 carries.
He averaged 5.3 yards per attempt and scored one rushing touchdown. His longest recorded run was 14 yards.
His workload was particularly important because Michigan could consistently use him to move the football and control possession.
Marshall’s performance provided three major benefits:
- Consistent rushing production
His 133 yards accounted for a substantial portion of Michigan’s total offensive yardage.
- Scoring contribution
His rushing touchdown gave Michigan another way to produce points without relying on the passing game.
- Offensive balance
His success helped create a balanced attack that also allowed Bryce Underwood to complete passes efficiently.
Marshall also contributed three receptions for 20 yards, showing that his role extended beyond traditional rushing situations.
Jasper Parker’s Contribution
Jasper Parker recorded six carries for 20 yards.
His average was 3.3 yards per carry, with a longest run of six yards.
Although his total was smaller than Marshall’s, Parker helped Michigan distribute its rushing workload across multiple players.
Bryce Underwood’s Rushing Contribution
Underwood added 25 rushing yards on seven carries.
His longest run was 17 yards, which was the longest individual rushing play listed among Michigan’s players.
This contribution made the Wolverines more difficult to defend because Washington had to account for the quarterback as a possible runner.
Washington Rushing Leaders
| Player | Carries | Yards | Average | Touchdowns | Long |
| Jonah Coleman | 16 | 50 | 3.1 | 1 | 8 |
| Adam Mohammed | 2 | 9 | 4.5 | 0 | 6 |
| Demond Williams Jr. | 5 | -19 | -3.8 | 0 | 6 |
| Washington Total | 23 | 40 | 1.7 | 1 | 8 |
Jonah Coleman Was Washington’s Leading Rusher
Jonah Coleman was Washington’s most productive running back.
He recorded 16 carries for 50 yards and scored the Huskies’ only rushing touchdown.
His average was 3.1 yards per carry.
Coleman also contributed through the passing game, finishing with three receptions for 41 yards.
This made him one of Washington’s more versatile offensive players.
Despite Coleman’s effort, Washington could not generate enough consistent rushing production to balance its passing attack.
The Rushing Difference Explained
The 147-yard difference between Michigan and Washington is important.
Michigan averaged 4.7 yards per carry, while Washington averaged only 1.7.
This difference meant Michigan could gain more yardage from each rushing opportunity.
It also helped the Wolverines maintain a more predictable offensive rhythm.
Washington’s limited ground production made it more difficult to establish balance, particularly when Williams was under pressure to make plays through the air.
Receiving Statistics: Denzel Boston and Zack Marshall Lead Their Teams
Both teams distributed the football among multiple receivers.
Michigan recorded 230 receiving yards and two receiving touchdowns. Washington finished with 209 receiving yards but did not record a receiving touchdown.
The difference was not simply the total yardage. Michigan converted its passing opportunities into points, while Washington struggled to finish its drives.
Washington Receiving Leaders
| Player | Receptions | Yards | Average | Touchdowns | Long |
| Denzel Boston | 4 | 71 | 17.8 | 0 | 48 |
| Jonah Coleman | 3 | 41 | 13.7 | 0 | 27 |
| Raiden Vines-Bright | 3 | 35 | 11.7 | 0 | 31 |
| Dezmen Roebuck | 3 | 27 | 9.0 | 0 | 17 |
| Decker DeGraaf | 4 | 26 | 6.5 | 0 | 14 |
| Kade Eldridge | 1 | 6 | 6.0 | 0 | 6 |
| Adam Mohammed | 2 | 3 | 1.5 | 0 | 6 |
| Washington Total | 20 | 209 | 10.5 | 0 | 48 |
Denzel Boston’s 71 Receiving Yards
Denzel Boston was Washington’s leading receiver.
He caught four passes for 71 yards, averaging 17.8 yards per reception.
His longest reception covered 48 yards.
Boston’s average demonstrated his ability to create meaningful gains through the passing game. His 48-yard reception was also Washington’s longest individual receiving play.
However, his production did not result in a touchdown.
This highlights a significant issue for Washington. The Huskies could create receiving yardage, but they struggled to turn those gains into points.
Jonah Coleman’s Receiving Contribution
Coleman added three receptions for 41 yards.
His average of 13.7 yards per reception demonstrated that he could contribute as a receiving option in addition to his rushing responsibilities.
His combined offensive contribution was:
- 50 rushing yards.
- 41 receiving yards.
- 91 total yards from scrimmage.
- One rushing touchdown.
- Three receptions.
Coleman was an important part of Washington’s offensive production.
Raiden Vines-Bright’s Performance
Raiden Vines-Bright recorded three receptions for 35 yards.
He averaged 11.7 yards per catch, with a longest reception of 31 yards.
His performance helped Washington distribute receiving production beyond Boston and Coleman.
Other Washington Receivers
Dezmen Roebuck finished with three receptions for 27 yards.
Decker DeGraaf caught four passes for 26 yards, while Kade Eldridge recorded one reception for six yards.
Adam Mohammed contributed two receptions for three yards.
These performances demonstrate that Washington used several receiving options, although none recorded a touchdown.
Michigan Receiving Leaders
| Player | Receptions | Yards | Average | Touchdowns | Long |
| Zack Marshall | 5 | 72 | 14.4 | 1 | 19 |
| Andrew Marsh | 5 | 49 | 9.8 | 1 | 22 |
| Deakon Tonielli | 3 | 38 | 12.7 | 0 | 28 |
| Donaven McCulley | 2 | 21 | 10.5 | 0 | 15 |
| Semaj Morgan | 2 | 20 | 10.0 | 0 | 13 |
| Jordan Marshall | 3 | 20 | 6.7 | 0 | 9 |
| Channing Goodwin | 1 | 10 | 10.0 | 0 | 10 |
| Michigan Total | 21 | 230 | 11.0 | 2 | 28 |
Zack Marshall Leads Michigan’s Receivers
Zack Marshall finished as Michigan’s leading receiver with five catches for 72 yards and one touchdown.
He averaged 14.4 yards per reception.
His receiving production was particularly valuable because it provided Underwood with a reliable option in the passing game.
Marshall’s touchdown also demonstrated Michigan’s ability to convert receiving opportunities into points.
Andrew Marsh Adds Another Touchdown
Andrew Marsh caught five passes for 49 yards.
He averaged 9.8 yards per reception and scored one touchdown.
His five receptions tied Zack Marshall for the most catches among Michigan receivers.
Together, the two players accounted for both of Michigan’s receiving touchdowns.
Deakon Tonielli’s Contribution
Deakon Tonielli recorded three receptions for 38 yards.
His average was 12.7 yards per reception, and his longest catch covered 28 yards.
Although he did not score, his production added another dependable receiving option to Michigan’s offense.
Michigan’s Receiving Balance
Michigan did not depend on one receiver to produce all its passing yards.
Zack Marshall and Andrew Marsh led the group, while Tonielli, McCulley, Morgan, and Jordan Marshall also contributed.
This distribution gave Underwood several options and helped the Wolverines maintain offensive flexibility.
Defensive Player Statistics and Standout Performances
Defense was another major factor in Michigan’s victory.
The Wolverines recorded three interceptions, two sacks, and seven tackles for loss.
Washington recorded one sack and three tackles for loss.
Although Washington finished with more total tackles, Michigan produced more disruptive defensive plays.
Washington Defensive Statistics
| Player | Total Tackles | Solo Tackles | Additional Statistics |
| Makell Esteen | 8 | 8 | Team tackle leader |
| Alex McLaughlin | 8 | 6 | 0.5 tackles for loss |
| Anterio Thompson | 6 | 3 | Not specified |
| Rylon Dillard-Allen | 5 | 5 | Not specified |
| Tacario Davis | 5 | 4 | 1 tackle for loss |
Washington recorded 72 total tackles and 44 solo tackles.
The defense also produced one sack, three tackles for loss, and three passes defended.
Makell Esteen Leads Washington’s Defense
Makell Esteen finished with eight total tackles, all of which were solo tackles.
His performance made him Washington’s leading defensive player by total tackles.
Eight solo tackles indicate that Esteen was regularly involved in stopping Michigan’s offensive players.
Although Washington struggled to prevent Michigan from scoring, Esteen remained productive throughout the contest.
Alex McLaughlin’s Defensive Contribution
Alex McLaughlin also recorded eight total tackles.
He finished with six solo tackles and 0.5 tackles for loss.
His performance placed him alongside Esteen as one of Washington’s most active defensive players.
Tacario Davis Adds Defensive Production
Tacario Davis recorded five total tackles, including four solo tackles.
He also contributed one tackle for loss.
His performance provided Washington with additional defensive activity, although the team struggled to consistently disrupt Michigan’s offensive rhythm.
Michigan Defensive Statistics
| Player | Total Tackles | Solo Tackles | Additional Statistics |
| Jimmy Rolder | 8 | 5 | 1.5 tackles for loss, 1 interception |
| Ernest Hausmann | 7 | 5 | 1 tackle for loss |
| Zeke Berry | 6 | 6 | 1 pass defended |
| Derrick Moore | 3 | 3 | 2 sacks, 2 tackles for loss |
Michigan recorded 46 total tackles and 38 solo tackles.
The Wolverines also produced two sacks, seven tackles for loss, and two passes defended.
Jimmy Rolder’s All-Around Performance
Jimmy Rolder was one of Michigan’s most productive defensive players.
He recorded:
- Eight total tackles.
- Five solo tackles.
- 1.5 tackles for loss.
- One interception.
- Two interception return yards.
His contribution was particularly valuable because he combined regular tackling production with a major turnover.
Rolder’s interception helped Michigan prevent Washington from building offensive momentum.
Ernest Hausmann’s Defensive Work
Ernest Hausmann finished with seven total tackles, five solo tackles, and one tackle for loss.
His performance demonstrated his importance in Michigan’s defensive structure.
He helped limit Washington’s rushing opportunities and contributed to the Wolverines’ overall defensive pressure.
Derrick Moore’s Two Sacks
Derrick Moore delivered an important pass-rushing performance.
He recorded three total tackles, all solo, along with two sacks and two tackles for loss.
His two sacks accounted for Michigan’s team total of two.
Sacks are valuable because they create negative plays, reduce offensive momentum, and make it harder for quarterbacks to sustain drives.
Moore’s performance was one of the strongest individual defensive contributions in the game.
Interceptions: Michigan’s Biggest Defensive Advantage
Michigan recorded three interceptions during the contest.
The players responsible were Cole Sullivan, Jimmy Rolder, and Jacob Oden.
| Michigan Defender | Interceptions | Return Yards | Touchdowns |
| Cole Sullivan | 1 | 8 | 0 |
| Jimmy Rolder | 1 | 2 | 0 |
| Jacob Oden | 1 | 0 | 0 |
| Team Total | 3 | 10 | 0 |
Washington did not record an interception.
This difference was one of the most important statistical factors in the game.
Cole Sullivan’s Interception
Cole Sullivan recorded one interception and returned it for eight yards.
His contribution gave Michigan another defensive takeaway and helped the Wolverines maintain control of the contest.
Jimmy Rolder’s Interception
Rolder added one interception with two return yards.
His contribution was particularly impressive because he also finished as one of Michigan’s leading tacklers.
Jacob Oden’s Interception
Jacob Oden completed Michigan’s interception total with one additional takeaway.
Although he recorded no return yards, the interception still ended a Washington possession.
Why Turnovers Were So Important
Michigan’s three interceptions created a major statistical advantage.
Washington had enough passing yardage to remain involved in the game, but it could not consistently protect the football.
Michigan, on the other hand, completed its passing work without an interception.
The result was a clear difference in possession security.
A team can produce impressive yardage and still struggle to win if it repeatedly gives the opposing offense additional opportunities.
That was an important lesson from this matchup.
Special Teams Performance
Special teams also contributed to the final result.
Michigan’s kicking game was more productive, while Washington missed its only field-goal attempt.
Kicking Statistics
| Player | Team | Field Goals | Extra Points | Total Points |
| Grady Gross | Washington | 0/1 | 1/1 | 1 |
| Dominic Zvada | Michigan | 1/2 | 3/3 | 6 |
Dominic Zvada made one field goal from two attempts.
His successful kick covered 26 yards.
He also converted all three extra-point attempts, finishing with six kicking points.
Washington’s Grady Gross missed his only field-goal attempt but converted his extra-point attempt.
His final kicking contribution was one point.
Punting Statistics
| Player | Team | Punts | Total Yards | Average | Touchbacks | Inside the 20 | Long |
| Luke Dunne | Washington | 4 | 165 | 41.3 | 1 | 2 | 55 |
| Hudson Hollenbeck | Michigan | 2 | 90 | 45.0 | 0 | 1 | 55 |
Hudson Hollenbeck averaged 45.0 yards per punt, compared with Luke Dunne’s 41.3.
Both players recorded a longest punt of 55 yards.
Dunne had more total punting yardage because Washington punted four times compared with Michigan’s two.
Return Statistics
| Team | Player | Return Type | Returns | Yards | Average |
| Washington | Denzel Boston | Punt | 1 | 4 | 4.0 |
| Michigan | Semaj Morgan | Punt | 1 | 5 | 5.0 |
Neither team recorded a kick return in the supplied box-score data.
Boston recorded one punt return for four yards, while Morgan returned one punt for five yards.
These numbers indicate that neither team generated a major special-teams return play.
Offensive Comparison: Why Michigan Was More Effective
The offensive comparison provides one of the clearest explanations for the final score.
Michigan finished with 417 combined passing and rushing yards, while Washington recorded 249.
| Offensive Category | Washington | Michigan |
| Passing Yards | 209 | 230 |
| Rushing Yards | 40 | 187 |
| Combined Passing and Rushing Yards | 249 | 417 |
| Total Touchdowns | 1 | 3 |
| Rushing Average | 1.7 | 4.7 |
| Passing Average Per Attempt | 6.5 | 8.2 |
Michigan produced 168 more combined passing and rushing yards.
This advantage was largely created by the rushing game.
The passing-yard difference was only 21 yards, but Michigan’s ground attack created a much larger separation.
Michigan Established a Better Offensive Balance
Michigan’s 187 rushing yards and 230 passing yards demonstrate a balanced approach.
The Wolverines did not need to rely on one offensive method.
Jordan Marshall provided consistent rushing production, while Underwood completed passes efficiently.
This balance gave Michigan the ability to adjust its offensive approach without becoming overly dependent on one player.
Washington Had Difficulty Establishing the Run
Washington’s 40 rushing yards were a major limitation.
Jonah Coleman performed reasonably well, but the overall rushing production remained low.
Williams finished with negative rushing yardage, which also affected the team total.
When a team cannot consistently gain yards on the ground, its passing game becomes more important.
That can create predictable situations for the opposing defense.
Michigan was able to take advantage of Washington’s offensive limitations.
Defensive Comparison: Tackles Versus Impact Plays
Washington recorded 72 total tackles, while Michigan recorded 46.
At first glance, Washington’s higher total might suggest that its defense was more active.
However, total tackles do not provide a complete picture of defensive effectiveness.
The more revealing statistics were sacks, tackles for loss, and interceptions.
| Defensive Category | Washington | Michigan |
| Total Tackles | 72 | 46 |
| Solo Tackles | 44 | 38 |
| Sacks | 1 | 2 |
| Tackles for Loss | 3 | 7 |
| Passes Defended | 3 | 2 |
| Interceptions | 0 | 3 |
Michigan produced more tackles for loss and twice as many sacks.
Most importantly, the Wolverines recorded three interceptions.
These impact plays helped Michigan prevent Washington from sustaining offensive drives.
The difference illustrates why defensive performance should be evaluated through several statistical categories rather than tackles alone.
A defense can record many tackles while still allowing the opposing offense to move the ball.
Michigan’s ability to create negative plays and turnovers was more important than its lower tackle total.
Three Major Turning Points in the Game
Although Michigan won by 17 points, several statistical developments help explain how the result took shape.
1. Michigan’s Opening Touchdown
Michigan scored seven points in the first quarter while preventing Washington from scoring.
Starting with a touchdown allowed the Wolverines to establish early control.
Washington responded in the second quarter, but Michigan’s opening score gave it the initial advantage.
2. The Third-Quarter Touchdown
Both teams entered halftime with seven points.
Michigan scored again in the third quarter, taking a 14-7 lead.
This was important because the Wolverines regained the advantage after Washington had tied the contest.
Michigan’s ability to score after halftime demonstrated stronger second-half execution.
3. Michigan’s Fourth-Quarter Control
The Wolverines added 10 points in the final quarter.
Washington did not score.
The final period confirmed Michigan’s advantage and extended the margin to 17 points.
The three interceptions recorded by Michigan’s defense also help explain why Washington could not build a late comeback.
What the Player Statistics Reveal About Michigan
Several important conclusions emerge from the individual and team numbers.
Michigan Had Two Productive Offensive Leaders
Bryce Underwood and Jordan Marshall were the foundation of Michigan’s offensive production.
Underwood recorded 230 passing yards and two touchdowns.
Marshall contributed 133 rushing yards and one touchdown.
Together, they provided 363 passing and rushing yards before considering the contributions of other players.
Their combined production helped Michigan generate 417 total passing and rushing yards.
Michigan Protected the Football
Underwood finished without an interception.
Michigan’s team passing statistics also showed zero interceptions.
This was particularly important against a Washington offense that threw three interceptions.
Ball security allowed Michigan to maintain possession opportunities and avoid unnecessary defensive pressure.
Michigan Had More Explosive Defensive Production
The Wolverines recorded:
- Three interceptions.
- Two sacks.
- Seven tackles for loss.
- Two passes defended.
These statistics demonstrate that Michigan was able to disrupt Washington’s offensive rhythm.
The Receiving Group Supported the Quarterback
Zack Marshall and Andrew Marsh each scored a receiving touchdown.
Other receivers contributed additional yardage, allowing Michigan to distribute its passing production across multiple players.
This reduced the pressure on any single receiver to carry the passing attack.
What the Statistics Reveal About Washington
Washington’s performance also included positive individual contributions.
However, the team struggled to convert those contributions into a competitive final score.
Denzel Boston Was a Productive Receiving Option
Boston led Washington with 71 receiving yards.
His 48-yard longest reception demonstrated that the Huskies could create meaningful passing plays.
Jonah Coleman Provided Offensive Versatility
Coleman recorded 50 rushing yards and 41 receiving yards.
His 91 combined yards from scrimmage made him one of Washington’s most productive offensive players.
He also scored the team’s only touchdown.
Demond Williams Jr. Produced Passing Yardage but Faced Turnover Problems
Williams threw for 209 yards and completed 20 passes.
However, his three interceptions were a major obstacle.
His passing production was not enough to overcome the impact of those turnovers.
Washington’s Rushing Attack Needed More Production
The Huskies finished with only 40 rushing yards.
That number made it difficult to maintain offensive balance.
Michigan’s defense was able to limit the running game while taking advantage of passing situations.
Statistical Lessons From the Matchup
The game offers several useful lessons for understanding college football performance.
1. Passing Yards Do Not Guarantee Offensive Success
Washington recorded 209 passing yards, only 21 fewer than Michigan.
However, the Huskies scored no passing touchdowns and threw three interceptions.
Michigan produced more efficient passing numbers and converted its opportunities into points.
This shows why passing yards should always be evaluated alongside touchdowns, completion percentage, and interceptions.
2. Rushing Efficiency Can Control the Game
Michigan averaged 4.7 yards per carry.
Washington averaged 1.7.
The difference allowed Michigan to generate more offensive production without relying entirely on its quarterback.
3. Defensive Turnovers Can Change Momentum
Michigan’s three interceptions were among the most important statistics.
They stopped Washington’s offensive possessions and gave Michigan additional opportunities.
4. Multiple Offensive Contributors Create Flexibility
Michigan received production from Marshall, Underwood, and several receivers.
This balanced distribution made its offense more difficult to defend.
5. Total Tackles Need Context
Washington recorded more tackles, but Michigan produced more sacks and tackles for loss.
The more disruptive defensive statistics favored Michigan.
Frequently Asked Questions
1. Who won the Washington Huskies vs Michigan Wolverines football game on October 18, 2025?
The Michigan Wolverines defeated the Washington Huskies 24-7 on October 18, 2025. Michigan scored in the first, third, and fourth quarters to secure the victory.
2. How many passing yards did Bryce Underwood record against Washington?
Bryce Underwood completed 21 of 27 passes for 230 yards and two touchdowns. He did not throw an interception and recorded a reported QBR of 69.6.
3. How many rushing yards did Jordan Marshall have?
Jordan Marshall recorded 133 rushing yards on 25 carries, averaging 5.3 yards per carry. He also scored one rushing touchdown.
4. How many interceptions did Demond Williams Jr. throw?
Demond Williams Jr. threw three interceptions during the game. Michigan’s Cole Sullivan, Jimmy Rolder, and Jacob Oden each recorded one interception.
5. Who was Washington’s leading receiver against Michigan?
Denzel Boston led Washington’s receiving group with four receptions for 71 yards. His longest reception covered 48 yards.
6. What was the biggest statistical difference between Washington and Michigan?
The biggest difference was rushing production. Michigan recorded 187 rushing yards, while Washington managed only 40. Michigan also recorded three interceptions compared with none for Washington.
Conclusion
The October 18, 2025 matchup between Washington and Michigan demonstrated the importance of balanced offense, quarterback efficiency, and defensive turnovers in college football.
Michigan secured a 24-7 victory through strong contributions from Bryce Underwood, Jordan Marshall, and its defensive unit. Underwood completed 21 of 27 passes for 230 yards and two touchdowns, while Marshall produced 133 rushing yards and one touchdown.
The Wolverines also recorded 187 rushing yards, compared with Washington’s 40. Their defense created three interceptions, recorded two sacks, and limited Washington to seven total points.
Washington had some encouraging individual performances. Denzel Boston led the receiving group with 71 yards, Jonah Coleman contributed 91 combined rushing and receiving yards, and Makell Esteen led the defense with eight tackles.
However, the Huskies struggled with turnovers and could not establish a consistent rushing attack. Demond Williams Jr.’s three interceptions and the team’s limited ground production made it difficult to challenge Michigan after halftime.
Overall, the washington huskies football vs michigan wolverines football match player stats show that Michigan won through a combination of efficient quarterback play, productive rushing, and aggressive defense. The 24-7 final score reflected the Wolverines’ ability to execute in the most important areas of the game.