Pacers vs Cleveland Cavaliers Match Player Stats
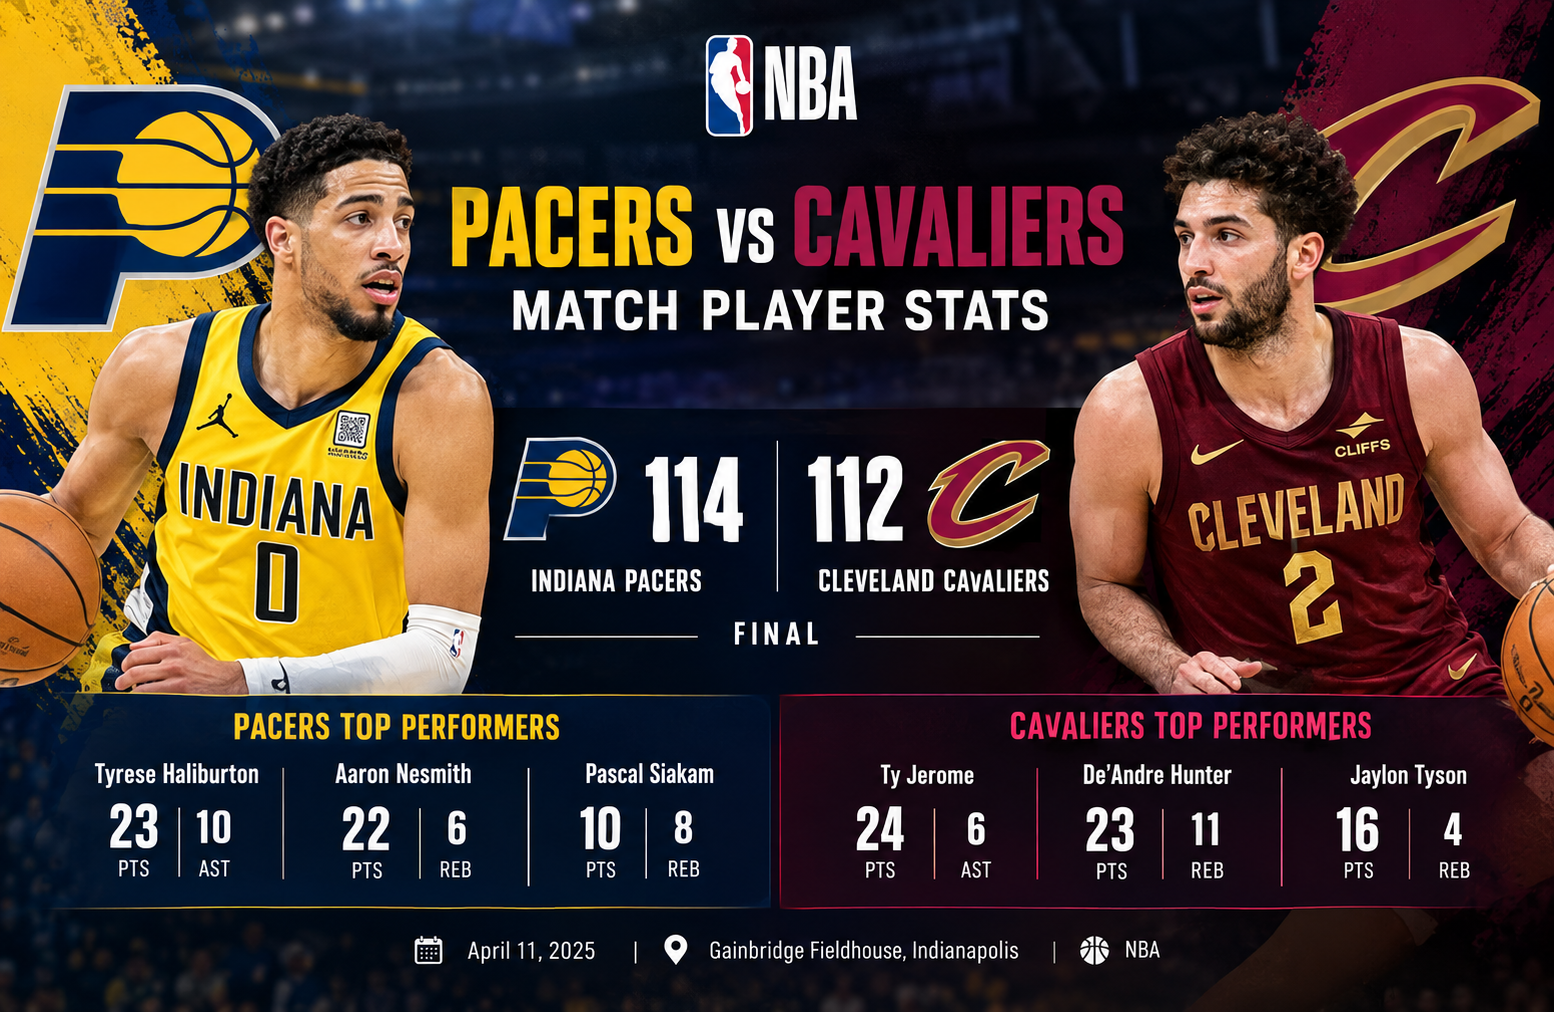
The pacers vs cleveland cavaliers match player stats from April 11, 2025, tell the story of a closely contested NBA game decided by just two points. The Indiana Pacers defeated the Cleveland Cavaliers 114-112 at Gainbridge Fieldhouse in Indianapolis, Indiana. Despite Cleveland’s advantage in three-point shooting and total rebounds, Indiana made better use of its ball movement, interior defense, and ability to convert important possessions. Tyrese Haliburton led Indiana with 23 points and 10 assists, while Ty Jerome paced Cleveland with 24 points. Aaron Nesmith added 22 points for the Pacers, and De’Andre Hunter contributed 23 points and 11 rebounds for the Cavaliers. The result demonstrated how a team can win a tight contest without leading every major statistical category.
This game is particularly interesting because both teams scored 43 field goals, yet Indiana secured the victory through a combination of efficient shooting, fewer turnovers, more assists, and an impressive 11 blocked shots. Cleveland made 17 three-pointers compared with Indiana’s 14, but that long-range advantage was not enough to overcome the Pacers’ defensive impact.
The following breakdown examines the final score, individual player performances, team statistics, starting lineups, tactical differences, and the wider context of the April 2025 season series.
Game Overview: Indiana Pacers vs Cleveland Cavaliers
The April 11 matchup brought together two Eastern Conference teams with strong regular-season records. Cleveland entered the contest with a 63-17 overall record, while Indiana stood at 49-31. The Cavaliers had enjoyed an outstanding season, but the Pacers defended their home court in a game that remained competitive through the fourth quarter.
Indiana Pacers
Home team
114
Winner
FINAL
114-112
2-point margin
Cleveland Cavaliers
Away team
112
Lost by 2
Date
April 11, 2025
Venue
Gainbridge Fieldhouse
Location
Indianapolis, Indiana
Attendance
17,020
Source: ESPN’s NBA box score for the April 11, 2025 game.
Quarter-by-quarter scoring
The teams followed different scoring patterns throughout the game. Indiana started strongly, Cleveland responded in the second quarter, and the Pacers recovered their advantage after halftime.
| Quarter | Cleveland Cavaliers | Indiana Pacers |
| First | 23 | 28 |
| Second | 33 | 24 |
| Third | 26 | 29 |
| Fourth | 30 | 33 |
| Total | 112 | 114 |
Indiana established a five-point lead in the opening quarter. Cleveland then outscored the Pacers by nine points in the second period, giving the visitors a 56-52 halftime advantage.
The Pacers responded after the break, winning the third quarter 29-26 and the fourth 33-30. Their ability to improve their scoring output in the final two periods proved decisive.
The quarter totals also explain why the final margin was so small. Cleveland had the better second quarter, but Indiana’s combined six-point advantage across the first, third, and fourth quarters was enough to secure the win.
Pacers vs Cleveland Cavaliers Match Player Stats: Complete Box Score
The individual numbers reveal how Indiana overcame Cleveland’s shooting advantage. Both teams made 43 field goals, but the Pacers produced more assists, committed fewer turnovers, and protected the rim far more effectively.
Indiana Pacers player statistics
| Player | PTS | REB | AST | STL | BLK | FG |
| Tyrese Haliburton | 23 | 8 | 10 | 0 | 3 | 8-16 |
| Aaron Nesmith | 22 | 6 | 1 | 0 | 0 | 7-14 |
| Jarace Walker | 15 | 3 | 0 | 0 | 0 | 6-7 |
| Myles Turner | 13 | 7 | 1 | 0 | 4 | 4-9 |
| Bennedict Mathurin | 13 | 3 | 1 | 1 | 0 | 6-14 |
| Pascal Siakam | 10 | 8 | 2 | 0 | 1 | 4-10 |
| Obi Toppin | 10 | 4 | 2 | 0 | 2 | 4-7 |
| T.J. McConnell | 6 | 3 | 4 | 0 | 1 | 3-6 |
| Andrew Nembhard | 2 | 1 | 7 | 2 | 0 | 1-8 |
| Thomas Bryant | 0 | 3 | 0 | 0 | 0 | 0-2 |
PTS = points, REB = rebounds, AST = assists, STL = steals, BLK = blocks, FG = field goals made-attempted. Figures are from the game box score.
Haliburton led the Pacers in scoring and assists, while Nesmith supplied crucial secondary scoring. Walker made six of seven field-goal attempts, giving Indiana an efficient contribution off the bench. Turner added four blocks, an important part of the team’s overall defensive total.
Cleveland Cavaliers player statistics
| Player | PTS | REB | AST | STL | BLK | FG |
| Ty Jerome | 24 | 2 | 6 | 0 | 1 | 9-16 |
| De’Andre Hunter | 23 | 11 | 2 | 2 | 1 | 9-19 |
| Jaylon Tyson | 16 | 3 | 3 | 0 | 0 | 7-17 |
| Sam Merrill | 15 | 3 | 4 | 1 | 1 | 5-9 |
| Isaac Okoro | 13 | 2 | 2 | 0 | 0 | 5-11 |
| Dean Wade | 8 | 4 | 4 | 2 | 0 | 3-7 |
| Tristan Thompson | 7 | 12 | 0 | 0 | 0 | 3-8 |
| Javonte Green | 3 | 2 | 2 | 1 | 0 | 1-3 |
| Jarrett Allen | 3 | 10 | 1 | 0 | 0 | 1-4 |
| Craig Porter Jr. | 0 | 1 | 0 | 0 | 0 | 0-4 |
The table lists players who recorded minutes in the game. Players who did not enter the game are excluded.
Jerome was Cleveland’s leading scorer, shooting efficiently from the floor and connecting on four three-pointers. Hunter delivered a strong all-around performance with 23 points and 11 rebounds. Merrill also provided valuable perimeter scoring, making five of his eight attempts from beyond the arc.
These performances kept Cleveland competitive even though the team was missing several of its regular stars.
Tyrese Haliburton’s Performance: The Pacers’ Offensive Leader
Tyrese Haliburton finished with 23 points, eight rebounds, and 10 assists. His combination of scoring and playmaking made him the most influential offensive player for Indiana.
Haliburton’s complete statistical line
- Points: 23
- Rebounds: 8
- Assists: 10
- Field goals: 8 of 16
- Three-pointers: 4 of 11
- Free throws: 3 of 4
- Turnovers: 2
- Blocks: 3
- Plus/minus: +15
His 10 assists were particularly important because Indiana recorded 28 assists as a team. That total indicates that the Pacers were creating scoring opportunities through passing rather than relying entirely on individual shot creation.
Haliburton also recorded three blocks, an unusual contribution for a guard and a meaningful part of Indiana’s defensive performance. His overall plus/minus of +15 means the Pacers outscored Cleveland by 15 points during his time on the floor.
Plus/minus should not be confused with a player’s individual point differential or a direct measure of personal skill. It reflects the team’s scoring margin while that player participates, and teammates, opponents, and lineup combinations all affect it.
Why Haliburton’s playmaking mattered
A player can influence a close game without being the highest scorer. Haliburton’s 10 assists helped Indiana spread the ball across the floor, find open shooters, and create opportunities before Cleveland’s defense could settle.
Three aspects of his performance stand out:
- Scoring and creation: He scored 23 points while also setting up teammates, forcing Cleveland to account for both threats.
- Control of possessions: His two turnovers were modest relative to his 10 assists, helping Indiana maintain offensive continuity.
- Late-game impact: Haliburton scored important points during Indiana’s fourth-quarter push, including key three-pointers that helped the Pacers regain control.
The larger lesson is that assist totals become more meaningful when considered alongside turnovers and team shooting. Indiana’s 28 assists and nine turnovers provided a strong balance between creating opportunities and protecting possession.
Aaron Nesmith’s Scoring and Jarace Walker’s Efficiency
Haliburton was not the only reason Indiana reached 114 points. Aaron Nesmith contributed 22 points, while reserve forward Jarace Walker scored 15 points on outstanding shooting efficiency.
Aaron Nesmith: 22 points
Nesmith made seven of 14 field-goal attempts, including three of six from three-point range. He also converted five of six free throws and collected six rebounds.
His performance gave Indiana a dependable second scoring option. That mattered because Cleveland’s defense had to focus on Haliburton’s playmaking and perimeter threat.
Nesmith’s three-point shooting was also efficient. He made half of his attempts from deep, although his contribution extended beyond long-range scoring through his work on the glass.
Jarace Walker: 15 points off the bench
Walker shot six of seven from the field and three of four from three-point range. His 15 points provided a significant boost without requiring a large number of attempts.
This is a useful example of why bench production should be evaluated through more than total points. A reserve who scores efficiently can help a team maintain its offense while starters rest.
Walker did not record an assist in the box score, but his scoring efficiency helped Indiana convert possessions into points. His performance was especially valuable in a game decided by only two points.
Myles Turner: Rim protection and interior defense
Turner scored 13 points, collected seven rebounds, and recorded four blocks. Those blocks were part of Indiana’s team total of 11, compared with only three for Cleveland.
His offensive contribution was steady rather than dominant, but his defensive presence was central to the matchup. Blocks can discourage attempts around the basket, change driving angles, and force opponents to take less comfortable shots.
The total does not mean that every Cleveland miss resulted from Turner’s defense. However, four blocks from one player, combined with seven more from the rest of Indiana’s lineup, demonstrate how heavily the Pacers influenced shots near the rim.
Cleveland Cavaliers Player Analysis
Cleveland lost the game, but several players delivered impressive individual performances. Jerome and Hunter combined for 47 points, while Merrill added 15 points with highly efficient three-point shooting.
Ty Jerome: Cleveland’s leading scorer
Jerome recorded 24 points, six assists, two rebounds, and one block. He made nine of 16 field-goal attempts and four of six three-pointers, finishing with a strong shooting performance.
His 24 points made him the game’s leading scorer. He also created opportunities for teammates, giving Cleveland a second source of offense beyond individual scoring.
Jerome’s efficiency is worth noting. He did not need an unusually high number of attempts to reach 24 points, and his four made three-pointers helped Cleveland take advantage of Indiana’s perimeter defense.
Despite his production, the Cavaliers fell short. This illustrates an important distinction in basketball analysis: an excellent individual performance does not automatically translate into a team victory.
De’Andre Hunter: Scoring and rebounding
Hunter finished with 23 points, 11 rebounds, two assists, two steals, and one block. He made nine of 19 shots from the field and three of seven three-pointers.
His double-double gave Cleveland a reliable contributor in both scoring and rebounding. Hunter’s 11 rebounds were especially important because Indiana’s defensive approach limited easy opportunities around the basket.
Hunter also recorded a +18 plus/minus, the strongest figure among the Cavaliers’ listed players. That number suggests Cleveland performed well during his minutes, but it does not negate the final loss. Plus/minus captures a particular lineup’s results, not a complete individual evaluation.
Sam Merrill: A major perimeter threat
Merrill scored 15 points and made five of eight three-pointers. He also recorded four assists, three rebounds, one steal, and one block.
His 62.5% three-point shooting gave Cleveland a strong perimeter option. When a shooter converts five of eight attempts from deep, the defense must respect that threat and adjust its coverage.
Merrill’s contribution also demonstrates why three-point percentage and three-point volume should be considered together. Making five shots from beyond the arc is more impactful than posting a high percentage on only one or two attempts.
Jarrett Allen and the rebounding battle
Allen recorded three points and 10 rebounds in limited playing time. His rebounding helped Cleveland finish with 50 total boards, four more than Indiana’s 46.
Although Allen’s scoring was limited, rebounds are a separate contribution. Defensive rebounds can end an opponent’s possession, while offensive rebounds can create second chances. Cleveland’s 11 offensive rebounds show that the Cavaliers did find opportunities to extend possessions.
However, those extra rebounds did not produce enough of an overall advantage to overcome Indiana’s defensive disruption and more frequent assists.
Team Statistics Comparison: Where the Game Was Won
The full team comparison provides the clearest explanation of Indiana’s narrow victory.
| Statistic | Cleveland | Indiana |
| Points | 112 | 114 |
| Field goals | 43-98 | 43-93 |
| Field-goal percentage | 44% | 46% |
| Three-pointers | 17-37 | 14-41 |
| Three-point percentage | 46% | 34% |
| Free throws | 9-13 | 14-20 |
| Free-throw percentage | 69% | 70% |
| Total rebounds | 50 | 46 |
| Offensive rebounds | 11 | 10 |
| Defensive rebounds | 39 | 36 |
| Assists | 24 | 28 |
| Turnovers | 11 | 9 |
| Steals | 6 | 3 |
| Blocks | 3 | 11 |
| Personal fouls | 16 | 16 |
1. Indiana shot more efficiently overall
Both teams made 43 field goals, but Indiana attempted five fewer shots. The Pacers finished at approximately 46% from the field, compared with 44% for Cleveland.
The difference was small, but it mattered in a two-point game. Indiana created more scoring efficiency from its available attempts, even though Cleveland was substantially more accurate from three-point range.
2. Cleveland won the three-point comparison
The Cavaliers made 17 of 37 three-pointers, while Indiana converted 14 of 41. Cleveland therefore made three more shots from beyond the arc.
That advantage would normally be a major positive. Three additional made three-pointers are worth nine points, but those extra points cannot be considered in isolation. Indiana made more free throws and achieved a higher overall field-goal percentage.
The lesson is not that three-point shooting was unimportant. Rather, Cleveland’s perimeter advantage was offset by other categories.
3. Free throws favored Indiana
Indiana made 14 of 20 free throws, compared with Cleveland’s nine of 13.
The Pacers converted five more free throws, creating a meaningful scoring difference. Their percentage was only marginally higher, but they attempted and made more free throws overall.
This distinction matters when reading box scores. Free-throw percentage tells you how accurately a team converted its opportunities, while free-throw totals show how many points those opportunities actually generated.
4. Indiana created more assists
Indiana recorded 28 assists against Cleveland’s 24. Four additional assists do not directly explain every made basket, but the difference supports the view that Indiana generated more scoring through coordinated offense.
The Pacers had 43 made field goals and 28 assists, while Cleveland had 43 made field goals and 24 assists. In other words, Indiana assisted on a larger share of its made shots.
5. Turnovers favored Indiana
The Pacers committed nine turnovers, while the Cavaliers committed 11.
Two fewer turnovers can be important in a tight contest because each lost possession reduces a team’s chance to score. Turnovers can also give the opponent transition opportunities before the defense is organized.
It would be inaccurate to claim that these two turnovers alone decided the game. However, the difference fits a broader pattern: Indiana preserved possessions more effectively while creating more assisted scoring.
6. Indiana dominated the blocks category
The most striking defensive difference was 11 blocks for Indiana compared with three for Cleveland.
Turner’s four blocks led the Pacers, while Haliburton added three. Other Indiana players contributed to the total, producing a team-wide defensive effect rather than relying on one rim protector.
Blocks are not a complete measure of defense. They do not capture every contested shot, forced pass, or defensive rotation. Still, an eight-block advantage is substantial and helps explain how Indiana could win despite Cleveland’s three-point shooting success.
How Indiana Won Despite Cleveland’s Three-Point Advantage
A final score often hides the most important details of an NBA game. Cleveland made more three-pointers and collected more rebounds, but Indiana found other ways to create a narrow advantage.
Three factors stand out when examining this matchup.
Ball movement created better opportunities
Indiana’s 28 assists indicate that the Pacers moved the ball effectively. Their offense did not depend exclusively on one scorer, even though Haliburton led the team in points.
Good ball movement can force defenders to rotate, create open shooting lanes, and produce opportunities closer to the basket. It can also help a team respond when its first offensive option is unavailable.
Cleveland’s 24 assists were respectable, but Indiana finished with four more. In a contest where both teams made the same number of field goals, the difference suggests that the Pacers created a slightly different mix of scoring opportunities.
Defensive pressure changed the shot environment
Indiana’s 11 blocks deserve particular attention. Cleveland shot 44% from the field, a reasonable overall figure, but its players had to contend with a defense capable of challenging shots around the rim.
A blocked shot can directly end an attempt, but rim protection also influences decisions before a shot occurs. Ball handlers may hesitate, pass earlier, or choose a more difficult angle when a defender is positioned near the basket.
The Pacers combined this interior presence with disciplined possession management. Their nine turnovers meant they gave away fewer possessions than Cleveland, helping them make better use of their offensive opportunities.
The fourth quarter rewarded Indiana’s execution
Indiana scored 33 points in the fourth quarter, compared with Cleveland’s 30. That three-point difference was decisive in a game with a two-point final margin.
According to the game recap, the Pacers produced a key 12-0 run late in the third quarter and Haliburton hit important three-pointers during the closing stretch. Cleveland continued to threaten, but its final attempt to tie or win the game did not fall.
This sequence demonstrates why quarter-by-quarter scoring and play-by-play details matter. A team can lose the overall three-point comparison yet win through a timely run, defensive stops, and efficient execution in the final minutes.
Starting Lineups and Bench Contributions
The starting lineups provide useful context for understanding the individual performances.
Indiana Pacers starting lineup
- Tyrese Haliburton
- Aaron Nesmith
- Andrew Nembhard
- Pascal Siakam
- Myles Turner
Indiana’s starting group combined Haliburton’s playmaking, Nesmith’s shooting, Siakam’s versatility, and Turner’s interior defense. Nembhard contributed seven assists despite scoring only two points.
Nembhard’s line is an excellent reminder that scoring totals do not tell the whole story. He made one of eight shots, but his seven assists helped Indiana create offense for other players. He also recorded two steals and committed no turnovers.
Siakam contributed 10 points and eight rebounds. His scoring was modest relative to some teammates, but his rebounding and ability to operate in different areas of the court helped balance the lineup.
Cleveland Cavaliers starting lineup
- Ty Jerome
- Sam Merrill
- De’Andre Hunter
- Dean Wade
- Jarrett Allen
Cleveland’s lineup in this game differed from its usual full-strength configuration. Donovan Mitchell, Darius Garland, and Evan Mobley were rested, according to contemporary game coverage. The Cavaliers had already secured the Eastern Conference’s top seed, making late-season player management a relevant part of the context.
That situation helps explain why Jerome and Hunter carried such significant scoring responsibilities. Jerome supplied 24 points and six assists, while Hunter recorded 23 points and 11 rebounds.
Merrill’s five three-pointers provided another important source of offense. Even without several established stars, Cleveland remained competitive and entered the final period with a realistic chance to win.
Which bench players made the biggest difference?
Indiana received 15 points from Walker, 13 from Mathurin, 10 from Toppin, and six from McConnell. Walker was particularly efficient, while Toppin added four rebounds and two blocks.
Cleveland’s bench contributions included 16 points from Jaylon Tyson in the box score supplied for this matchup, alongside 13 points from Okoro and seven points and 12 rebounds from Thompson.
The comparison shows that both teams received useful production beyond their starting groups. Indiana’s bench scoring, combined with its stronger rim protection, helped support the starters during a close contest.
Season Series: Pacers vs Cavaliers in 2025
The April 11 listing was part of a four-game regular-season series between Indiana and Cleveland. The series record is useful because it places the narrow victory within the wider matchup rather than treating it as an isolated result.
| Game | Result | Winner |
| January 13, 2025 | Indiana 108, Cleveland 93 | Indiana |
| January 15, 2025 | Cleveland 127, Indiana 117 | Cleveland |
| April 10, 2025, US local date | Indiana 114, Cleveland 112 | Indiana |
| April 13, 2025 | Indiana 126, Cleveland 118, 2OT | Indiana |
Indiana finished the regular-season series with a 3-1 advantage. The third meeting is sometimes displayed as April 11 on international listings because of time-zone differences, while the US game record identifies it as April 10.
For readers checking the original numbers, the official ESPN box score and game information provide the individual and team statistics for the 114-112 result.
The fourth game was also significant. Indiana defeated Cleveland 126-118 in double overtime on April 13, completing a strong finish to the regular-season matchup.
However, the four-game series should not be interpreted as proof that Indiana was always the better team. Cleveland had a 63-17 record entering the April 10 US game, while Indiana was 49-31. Cleveland’s record reflected its outstanding regular season, and the circumstances of the April meeting included the absence of key players.
The more defensible conclusion is that Indiana matched up effectively with Cleveland during the regular season and delivered in the two teams’ late-season meetings.
What the Player Statistics Tell Us About Basketball Analysis
A useful box-score breakdown goes beyond listing points and rebounds. The best analysis connects individual numbers to the way a game unfolded.
The following principles help readers interpret this matchup and other NBA contests.
Look beyond the highest scorer
Jerome led all players with 24 points, but Cleveland lost. Haliburton scored 23 while recording 10 assists, and Indiana won.
This does not mean assists are always more valuable than points. It means that scoring should be evaluated alongside playmaking, shooting efficiency, defense, and team results.
Compare attempts as well as makes
Both teams made 43 field goals. Indiana attempted 93 shots, while Cleveland attempted 98.
Looking only at makes would suggest that the teams performed equally in this category. Adding attempts reveals that Indiana converted its opportunities at a higher rate.
The same principle applies to three-pointers and free throws. Percentages show accuracy, while attempts reveal volume.
Interpret plus/minus carefully
Plus/minus measures the team’s net point differential while a player is on the court.
Hunter’s +18 and Haliburton’s +15 were strong figures, but they reflect different lineup contexts. A positive rating does not mean every possession was successful, and a negative rating does not necessarily indicate poor individual play.
For a more complete evaluation, compare plus/minus with minutes played, shooting efficiency, turnovers, assists, rebounds, and defensive contributions.
Separate individual production from team execution
A player can have a productive night while the team loses. Conversely, a player who scores relatively few points can make an important contribution through passing, rebounding, screens, and defense.
Nembhard’s seven assists and two steals, for example, show why his two points do not adequately describe his contribution.
Likewise, Allen’s 10 rebounds mattered even though he scored only three points.
Use context before drawing conclusions
Cleveland’s late-season circumstances matter when assessing the result. The Cavaliers had secured the top seed and rested several key players. That context does not erase Indiana’s win, but it helps explain why this game’s lineup and scoring distribution differed from what might be expected in a full-strength playoff contest.
Responsible basketball analysis acknowledges these circumstances instead of making sweeping claims from a single box score.
Frequently Asked Questions
1. Who won the Pacers vs Cleveland Cavaliers game on April 11, 2025?
The Indiana Pacers won 114-112. The game was played in Indianapolis and is dated April 10 in US local-time records, although some international listings show April 11.
2. Who scored the most points in the game?
Ty Jerome led all players with 24 points for Cleveland. Tyrese Haliburton led Indiana with 23 points, 10 assists, and eight rebounds.
3. What were Tyrese Haliburton’s stats against Cleveland?
Haliburton recorded 23 points, eight rebounds, 10 assists, four made three-pointers, and three blocks. He made eight of 16 field-goal attempts and finished with a +15 plus/minus.
4. How many points and rebounds did De’Andre Hunter record?
Hunter finished with 23 points and 11 rebounds, along with two assists, two steals, and one block. He made nine of 19 field-goal attempts.
5. Why did Indiana win despite making fewer three-pointers?
Indiana made 14 three-pointers compared with Cleveland’s 17, but the Pacers shot a higher overall field-goal percentage, made five more free throws, recorded four more assists, committed two fewer turnovers, and blocked eight more shots. These combined advantages helped Indiana win by two.
6. What was the regular-season series record between Indiana and Cleveland?
Indiana won three of the four regular-season meetings in 2024-25. Cleveland won the January 15 matchup, while Indiana won the games on January 13, April 10, and April 13.
Conclusion
The pacers vs cleveland cavaliers match player stats from this closely contested game reveal how Indiana secured a 114-112 victory through balanced scoring, effective passing, and strong interior defense. Tyrese Haliburton led the Pacers with 23 points and 10 assists, while Aaron Nesmith contributed 22 points and Jarace Walker added an efficient 15-point performance off the bench.
Cleveland also had outstanding individual performances. Ty Jerome scored 24 points, De’Andre Hunter recorded 23 points and 11 rebounds, and Sam Merrill made five three-pointers. The Cavaliers’ 17 made three-pointers and 50 rebounds demonstrated their offensive and rebounding strengths, but Indiana’s 28 assists, nine turnovers, and 11 blocks helped determine the outcome.
The most important takeaway is that basketball results depend on the combined effect of scoring, efficiency, ball movement, and defense. Cleveland excelled from beyond the arc, while Indiana found advantages in several other areas. The two-point margin reflects how closely matched the teams were on the scoreboard, even as their statistical strengths differed.